Review of Implementation of Augmented Reality into the Georeferenced Analogue and Digital Maps and Images - MDPI
←
→
Page content transcription
If your browser does not render page correctly, please read the page content below
information
Article
Review of Implementation of Augmented Reality
into the Georeferenced Analogue and Digital Maps
and Images †
Piotr A. Werner
 Spatial Information Systems Laboratory, University of Warsaw, Faculty of Geography and Regional Studies,
 Krakowskie Przedm.30, 00-927 Warsaw, Poland; peter@uw.edu.pl; Tel.: +48-22-5520-652
 † The core of paper includes the thread presented at the IS4SI 2017 Summit DIGITALISATION FOR A
   SUSTAINABLE SOCIETY, Gothenburg, Sweden, 12–16 June 2017. The thread concerning geovisualization is
   based on conclusions of the discourse with students within the framework of author’s course “Cognitive Science
   and Geoinformation”, courtesy: Adam Mickiewicz University in Poznan, Poland, Spring 2018.

 Received: 28 November 2018; Accepted: 24 December 2018; Published: 30 December 2018

 Abstract: Augmented reality (AR) combines information from databases with information derived
 directly through the human senses or different sensors. AR is the organic, real-time, and dynamically
 overlaying virtual images created by computers and other information on a real environment that
 the observer can see. Virtual information changes according to the movement of the observer, as if
 that virtual information truly exists in the real world. The convergence of geographic information
 systems (GIS), web mapping, mobile technology, and augmented reality (AR) implies the emergence
 of location based systems (LBS) and, in turn, the diminishing use of traditional analog maps by
 smartphone users. The focus and review of current achievements in this subject on the wider trends of
 the use of AR also prove that coding of some data and metadata on an image or a map (both in digital
 and analogue form) permits inter alia the inclusion of, for example, a paper map or analogue image
 into the chain of digital devices use. Some solutions, remarks, and comments concerning functioning
 of the digitally augmented (printed) map and their digital counterparts within the information society
 are presented.

 Keywords: augmented reality; data; metadata; map; image; cartography; GIS; mobile technology

1. Introduction
     Geographers use metaphors. The most known geographic metaphor is related to Johannes
Vermeer’s famous painting ‘The Geographer’ (1668–1669), which can be interpreted as an origin of the
idea of virtual reality [1]. Printed (paper) maps and analogue photos (images) are yet (less and less) in
use and, nowadays, there is a rising challenge of the growing use of mobile (digital) ones. Technology
also influences the traditional understanding of map definition in geography and cartography.
     Eyesight is important in cognitive processes. Humans learn during movement and discover
the environment (milieu) and eyes acquire the necessary information. Multiplicity of images
shapes the sensitivity, thinking, and world perception. People are moving away from verbal
communication to image (visual) messages and, nowadays, the supersession of text context by images
dominates. Visualization uses the techniques of image, animation, or diagram creation aimed at
forwarding messages.

Information 2019, 10, 12; doi:10.3390/info10010012                            www.mdpi.com/journal/information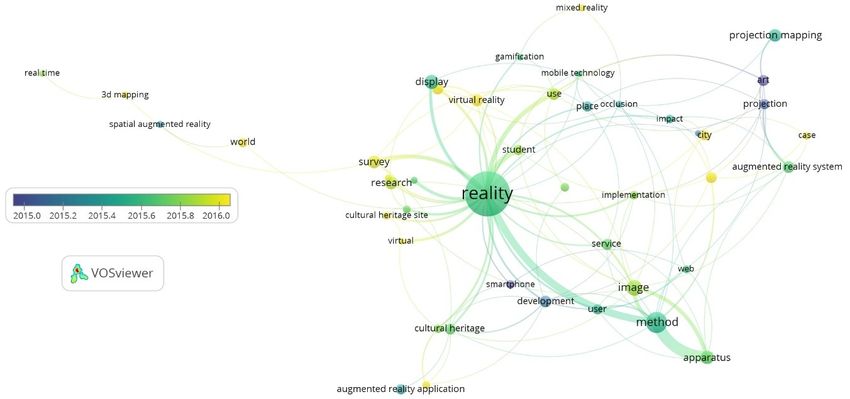
Information 2019, 10, 12                                                                             2 of 14

2. Geovisualization, Digital Maps, and Their Usefulness in Information Society
      Maps are spatial notations of the reality surrounding us and have been linked to the process of
civilization changes since the earliest of times. The problem of map ontogenesis is the question of
human–milieu relation. The optimal solution to this issue results from integrated human structures:
somatic, psychological, and mental, revealed during human actions in the environment, including the
creative and useful role of vision of the map as well. Thus, a map is an oriented information entity
based on unity of three concepts: system (target), model (information), and image (transmission),
“tria iuncta in uno” (Latin) [2]. Taking into account that the relation between the map and human action
is causal, the content of definition of a map, according to A.Makowski, is as follows: “Geographic map
is a systemic model-image information entity, mapping space-time situations in context of human
intentional action in adopted georeferenced system coordinates.” [3]
      All recent maps are instances derived from geospatial databases (Figure 1). Visualization using
maps is an intermediate tool between the human and information system, aimed data analyses,
and presentation of results of these analyses.

      Figure 1. Map instances derived from geospatial database. Legend of symbols: 2D, 3D—spatial
      dimensions, T—time, H—height/depth, A—animation, I—interaction, SciVis—scientific visualization.

     In parallel, geovisualization is understood as the use of visual aspects of spatial information aimed
at building the knowledge of milieu (environment) in a holistic approach and making it more easily
understood. These processes are supported through the development of techniques and solutions that
allow visual interaction between the user and available spatial data, as well as presenting them in
the form of spatially registered graphical models. Technologically, geovisualizations are applicable as
graphical, scientific, and/or knowledge visualizations. Cartography defines the rules of visualization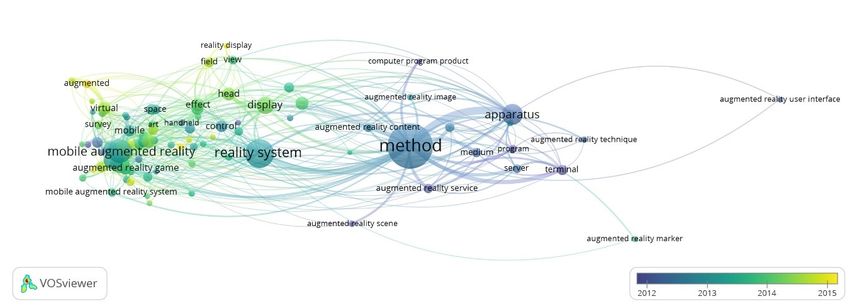
Information 2019, 10, 12                                                                            3 of 14

of spatial data on plane (2D). Three-dimensional geovisualizations, using different raster, vector, or TIN
(triangulated irregular network) models combined with images, can achieve a very realistic model of
the world. Pillars of geovisualization are, inter alia, methods of cartography, scientific visualization,
image analysis, symbolic qualitative and quantitative information visualization, and exploratory
spatial data analysis (ESDA).
      Almost all map instances characterize interaction and feedback to geospatial database. They make
possible updates of the digital maps, but only the hardcopy, that is, the printout of map, is a finished
product and seems to be completely separated from the geospatial database. An update of the hardcopy
requires restarting the whole production process, and feedback with the geospatial database is limited
or does not exist. Interaction of the hardcopy with digital devices is minimal.
      Classic processing of spatial data in geographic information systems (GIS) involves several
stages: fieldwork and acquisition of spatial data, archiving (management and editing), spatial analysis
procedures (e.g., generalization), geovisualization (display on demand), and (in case of need,
final) printout.
      Different applications of maps and, recently, geovisualizations are continuously expanding.
Descriptions of use in scientific literature involves, inter alia, activities supporting analysis and
studies of environmental conditions of geographical human or natural objects, as well as extreme
natural hazards. They allow accurate and precise interpretation of phenomena and their spatial
changes. Traditional approaches, which use 2D maps (even digital), are time-consuming and decrease
the number of studied features, diminishing the extent of analysis. Two-dimensional and 3D
geovisualizations affect the final results of the projects (design), facilitate making decisions related
to rational space management, and offer protection against the effects of geo-hazards. It seems that
with the further development of technology, the extent and detail of geovisualizations and range of
applications will grow. The knowledge of cognitive relations and human perception targets the best
possible graphic information display. These are the basement of most of users’ easier perception of
complicated spatial dependences.
      Most often, static images overlaid on 3D surfaces in geovisualizations are used, as well as maps
providing dynamic linking to related text information, animation, and/or fly over models. Time aspect
is also important, seeing that it may be applied to comparative or time analysis. Geovisualization
has found application in spatial planning (e.g., photorealistic city models), archeology (3D catalogs
of artefacts, mapping of archaeological sites), crisis management (interactive modeling of hazards),
and environmental protection (different impact maps of environmental factors, determination of
buffer zones). Geovisualizations may also display the non-geographical information related to linking
them with places of their origin (or possible target locations), that is, Geography of Hate project
(covering Geotagged Hateful Tweets in the United States from June 2012 to April 2013, [4]).
      This way of reality representation puts emphasis, after all, on methods of scientific visualization
in studies and decision processes. The application of different methods of geovisualizations allows
the better understanding of the problem under analysis, as well as deeper insight into data in their
spatial aspects and then inferring based on revealed information, necessary to undertake the right
spatial decisions.
      This way, geovisualization seems to be the important element in spatial planning, because
it supports processes of public (social) participation. Visual interactions (more intense than with
traditional maps) of users with available data presented in the form of georeferenced spatial
models (not only in form of maps) result in the process of creation of knowledge. Consequently,
active inhabitants, perceiving the holistic model of the real world, are able to influence the processes
of undertaking spatial decisions. Geovisualization in the context of spatial planning involves all the
processes reinforcing the sharing and understanding of geospatial information, using, inter alia, 3D
models, animations, and simulations of spatial processes, which in turn have a better affect on spatial
imagination than traditional (printed) maps or even maps displayed on computer screens.
Information 2019, 10, 12 4 of 14
However, some (popular, common sense) opinions express and stress the relation of
geovisualization to any presentation that is associated to any human daily activity in a defined
location; every map, guidepost, sketch, and verbal message may be also named using this term. It can
be problematic to think about oral messages or body language as geovisualization, but it does not
matter if the visualization is on paper, on electronic display, or a reconstruction in the brain based on
acquired information (one exemplified conclusion, drawn from seminar discourse).
People still buy and use printed (paper) maps, despite the digital technologies expansion, for
instance, they still buy and read newspapers and books, or display their scanned images on digital
devices. Popular online advice from experienced travelers includes, for example, that a separate
problem is the fact that during travel with the support of a GPS (Global Positioning System) device,
the majority of users come to the conclusion that the paper map may (and absolutely should in any
case) calmly lie in a backpack. GPS information completely supports orientation in the hardest terrain,
even if the digital map is not very detailed on the device or presents only the waypoints [5].
The paper maps still are in use parallel to mobile maps. One should at least attempt to diagnose
several reasons for this situation [6]. The use of maps characterizes habits shaped during curricular and
extracurricular education, that is, formal and tacit knowledge of printed maps, atlases, and guidebooks.
However, the devices may lose the WiFi or GPS signal (regardless of reason). Users have to rely on
knowledge and skills. They can acquire ready made (professional) digital maps on demand, used later
offline or prepare own digital map before, using accessible source of spatial data and widely available
software and geolocation tools. At last, they can use purchased earlier printed maps and guides.
Moreover, there is also a psychological human mechanism, that is, belief in the “durability” of a
printed image, which is available any time without additional equipment. Finally, the hardcopy—that
is, printed maps—document the state of the real world at a defined point in time and may be the proof
(according to law) of any public or individual decisions, actions, projects, and claims. Several other
reasons (omitted above) can be mentioned, for example, maps become historical documentation and
also present aesthetical value as works of art.
“Online/mobile maps and products of traditional cartography have different affordances due to
the different media in which they are presented (e.g., static paper vs. dynamic screens)”. However,
currently the majority of online and mobile digital maps characterize “primary high-level purpose:
orientation and navigation” [7].
Digital map studies prove that the base layer of these types of maps use location-aware
cartographic approaches and possibly topographic maps (or satellite images) to switch on.
Location-aware approaches mean intelligent presentation based on the location being viewed,
especially for indoor plans or local area maps (e.g., campus, park, zoo, cemetery). The next common
feature for these types of maps is you-are-here (YAH) dots. Mobile maps can afford an experience in
which a space moves around a user (allocentric YAH dots), in contrast to maps that afford an experience
in which a user moves around a space (egocentric YAH dots, [7]). Mobile maps also characterize the
presence of additional text information or meta-information associating features presented near YAH
dots. Last but not least, another feature of mobile maps is the ability to rotate relative to a dominant
object on the map (most often water body) to show the actual orientation (“logically-aligned”) of the
map [7].
3. Augmented Reality
The definition of augmented reality (AR), avoiding limitation to specific technologies,
concerns systems involving three characteristics [8]:
• combines real and virtual [elements];
• interactive in real time;
• registered in 3D.Information 2019, 10, 12 5 of 14
AR is dynamic overlay of digital virtual images and information concerning the real environment
that is being observed. Images and virtual information change constantly while observer is
moving. AR involves integrating synthetic information into the real environment and the overlay of
spatially-registered computer graphics over a live image of the real world. The range of applications
of AR include, inter alia, the following [9]:
• geolocation using GPS and geographic information systems (GIS);
• geonavigation, especially marine and air traffic;
• car navigation, including autonomous car driving;
• UAV (unmanned aerial vehicle) geonavigation;
• geovisualizations of interactive maps, that is, displaying and interactive analysis of terrain,
interactive 3D maps, and landscape visualizations;
• building information modeling (BIM): visualization and modeling of buildings and/or urban
fabric, also using mobile applications;
• support for visitors: displaying tags and labels of observed objects;
• simulations: flight and drive simulators;
• virtualization of conferences;
• Information
entertainment and education (e.g., mobile treasure hunt games for outdoor learning);
2018, 9, x FOR PEER REVIEW 5 of 13
• searching by images (the newest service supported by, for example, Google, is related to
geolocation
searching using images
by images of terrain
(the newest objects,
service that is, search
supported by,places by images);
for example, Google, is related to
• geolocation
assembly using by
process images of terrain
leveraging objects, thatreality,
augmented is, search places
cloud by images);and mobile devices
computing,
assembly
(which process
include by leveraging
mobile augmented augmented reality,
reality (MAR) andcloud computing,
digital and mobile devices (which
maps [10]).
include mobile augmented reality (MAR) and digital maps [10]).
Two different augmented reality display concepts exist to superimpose graphics onto the user’s
view ofTwothedifferent
real world; augmented reality display
video see-through andconcepts exist to superimpose
optical see-through graphicsdisplays
head-mounted onto the (HMD)
user’s
view of the real world; video see-through and optical see-through head-mounted displays
have been the traditional output technologies for augmented reality applications for almost forty years. (HMD)
have new
Rather beenisthe
thetraditional output technologies
spatial augmented for augmented
reality approach (SAR). SARreality applications
involves new displayforparadigms
almost forty
that
exploit large spatially-aligned optical elements, such as mirror beam combiners, transparentdisplay
years. Rather new is the spatial augmented reality approach (SAR). SAR involves new screens,
paradigms that exploit large spatially-aligned optical elements, such as mirror beam combiners,
or holograms, as well as video projectors. In many situations, SAR displays are able to overcome
transparent screens, or holograms, as well as video projectors. In many situations, SAR displays are
technological and ergonomic limitations of conventional AR systems [11].
able to overcome technological and ergonomic limitations of conventional AR systems [11].
Milestones of AR have been presented in several publications [12–15]. All of them point out
Milestones of AR have been presented in several publications [12–15]. All of them point out
reference to diagrams depicting the reality–virtuality continuum by Paul Milgram and Fumio
reference to diagrams depicting the reality–virtuality continuum by Paul Milgram and Fumio
Kishino [16] (Figure 2). There are two types of mixed reality, that is, augmented reality (AR) and
Kishino [16] (Figure 2). There are two types of mixed reality, that is, augmented reality (AR) and
virtuality (AV), which are in the scope of interest of geographers and cartographers.
virtuality (AV), which are in the scope of interest of geographers and cartographers.
Figure2.2.Reality–virtuality
Figure Reality–virtuality continuum.
AArecent
recentpoint
pointofofview,
view,emphasizing
emphasizingrather
ratherthe
the way
way people
people experience the physical
experience the physicaland
andvirtual
virtual
environment,
environment, operates withwith
operates the umbrella term extended
the umbrella reality (XR),
term extended encompassing
reality virtual, augmented,
(XR), encompassing virtual,
augmented,
and and [17].
mixed reality mixed reality [17].
“Industry
“Industry analysts
analysts have
have dubbed
dubbed ARAR the
the “eighth
“eighth mass
mass medium”
medium” ofof communications.”[18]
communications.” Rootsof
[18] Roots
ARoftechnologies
AR technologies adoption
adoption are
are seen in seen in and
theories theories and well-grounded
concepts concepts well-grounded in psychology,
in behavioral behavioral
psychology, sociology, and the economy, including TAM (technology acceptance theory), UTAUT
(unified theory of acceptance and use of technology), U> (uses and gratification theory), media
richness theory, and social presence theory. The perceived benefits of XR technology based on
different dimensions have been defined as (i) technology-specific, that is, utilitarian, hedonic, and
social; (ii) fashion-specific, that is, impression management and wearable comfort; and (iii) media-Information 2019, 10, 12 6 of 14
sociology, and the economy, including TAM (technology acceptance theory), UTAUT (unified theory
of acceptance and use of technology), U> (uses and gratification theory), media richness theory,
and social presence theory. The perceived benefits of XR technology based on different dimensions
have been defined as (i) technology-specific, that is, utilitarian, hedonic, and social; (ii) fashion-specific,
that is, impression management and wearable comfort; and (iii) media-specific, that is, sensual benefit,
immersion, experienced realism, and virtual presence [17]. A systematic review of AR usability studies
has been compiled by Dey et al. [19]. Most of the examples concern indoor situations, but the main trend
observed is the domination of use smartphones as the primary display (over HMD, head mounted
displays) for AR applications. Authors categorized the phenomena into nine applications areas,
concerning the following: perception, medical, education, entertaining and gaming, industrial
applications, domain of navigation and driving, tourism and exploration, collaboration, and interaction.
It must be stressed that navigation and driving, as well as tourism and exploration, are domains in
which the cartographic pillar plays the most important role, especially outdoor in a realistic testing
environment, including the use and capture of huge volumes of a variety of qualitative and quantitative
spatial data [19]. Other authors define the range of AR applications as follows: tourism and navigation,
entertainment and advertisement, training and education, geometry modeling and scene construction,
assembly and maintenance, and information assistant management [20].
Another feature is the psychological aspect concerning the perception of distances, directions,
and areas while using AR systems. Some results suggest the depth distortions that AR application
developers should expect with mobile and tablet-based AR.
Prevailing use of smartphones’ AR applications has been defined in scientific papers as MAR
(mobile augmented reality). “MAR combines wireless communication, location-based computing and
services (LBS), and augmented reality to create an integrated interactive environment” [21] and is a
challenge for UI (user interface) designers. The extensive use, inter alia, of devices’ sensors, accuracy
of tracing technologies, and UI design is indicated in this context [21].
Tracing and registration in AR systems can be sensor-based and vision-based. “Sensor-based
employ inertial and electromagnetic fields, ultrasonic and radio wave measure and calculate
pose information; vision-based methods estimate gesture information from point correspondent
relationships of markers and features from captured images or videos” [19]. Some (hybrid) systems
use both methods.
The progress of AR technology recently distinguished a fifth generation of media, so-called
wearable augmented reality devices (WARD), which promise a new digital turn after the previous
achievements (milestones: computer offline, Web 1.0, Web 2.0, Mobile Social Web) [22]. The new
wearable AR devices are termed augmented reality smart glasses (ARSGs, e.g., Google Glass or
Microsoft HoloLens). Although they can be seen as a new quality of head mounted devices, in fact,
ARSGs are really perceived as disruptive innovation, because of the potential added internal and
external value creation. Internal value creation involves research and development (fostering and
facilitating innovation processes), promotion of collaboration, and process effectiveness. External value
creation increases the value of firms offering their services and products using ARSGs for customers
because of utilitarian, hedonic, and social/symbolic benefits, as well as strengthening of customer
interactions (services and AR branding) [22]. On the other side, the expected (customers) benefits are
also accompanied by new kinds of expected and perceived (individual) risks, such as the threat of
own and others’ privacy and possible loss of self autonomy due to external interference in certain
situations [23]. The recent classification of AR technologies based on their physical characteristics
distinguishes between virtual and augmented technologies in stationary, mobile, and wearable
technologies, emphasizing smartwatches and virtual reality glasses as strict virtual technologies
and ARSGs as augmented technologies [24].
The main potential of disruptive innovation in the future of ARSGs lies not only in advent
the of technology, but in the possibility of surpassing over mobile devices, such as smartphones or
tablets, because users (consumers) may also consider wearables devices as “fashion” or “fashnology”Information 2019, 10, 12 7 of 14
(fashion and technology or fashionable technology) [25,26]. Pilot studies concerning perceived health
risks on the usage of Microsoft HoloLens did not confirm their direct negative influence, however,
an “indirect negative influence of perceived health risk on behavioral intention to use through perceived
enjoyment” has been confirmed [27].
4. GIS and AR
The progress in the information, communications, and technology (ICT) sector has brought rapid
development of AR coexisting with GIS technology on portable devices. The GIS and AR processing
chain involves gathering of the following: specific user requests, display parameters concerning scale,
symbology and metadata of requested map and users’ position (location), and orientation.
The combination of GIS and AR supports both indoor and outdoor exploration of spatial data.
Augmented virtuality (AV) is related to exploration of geospatial data directly from the real or virtual
(digital) world and may be defined as an augmented map (AM), which implies the extensive use of
maps as the base element of searching for information. Augmented reality (AR) as the interactive tool
makes possible gathering additional information during exploration of the natural environment or
anthropogenic (e.g., urban) milieu, which can be defined as augmented territory (AT).
These types are designed and implemented into mobile applications (e.g., GPS navigation) [11].
Some authors and MAR creators announced AR as the next big innovation. Undoubtedly, MAR is
the candidate technology for disruptive innovation in mapping [28].
Mobile AR and Paper Maps
So far, the combination of GIS and AR is predominantly related to mobile (digital) maps, and there
are few other practical applications except navigation. Ann Morrison (et. al.) experimented with
augmented reality (AR) using a ‘magic lens application’ over a paper map using a smartphone.
“Maps are one of the main application categories for mobile AR. The focus is in augmentation of
physical maps with useful and interesting real-time information. Paper maps have a large static surface
and AR can provide a see-through lens without forcing the user to watch map data only through the
small ‘keyhole’ of the display” [29] (p. 1).
Some findings point out that the type and layout of a physical map that has undergone augmented
reality operation (augmented map) affect its efficiency while using mobile devices (through spatial pattern
analysis and ways of users’ interaction). “The maps act as mediation objects for multimodal discourses
providing resources such as a context and facilitation for embodied communication” [30] (p. 3).
Some other examples are related to geocaching—outdoor recreational activity using GPS receivers
(often in smartphones) and, for example, its latest, new instance Pokémon Go application, globally
available since 2016. However, its root can be derived from orienteering—a formal olympic discipline,
which requires users to possess navigational skills using (specially prepared, without labels) maps and
compass while moving through unknown terrain at speed during the race.
Yet another example of augmented maps—similar to paper, but not exactly—is commercially
available portable document format (PDF) maps offered on the market (e.g., Avenza Maps).
Geospatial PDFs involve georeferenced location data and allow finding specific or users’ locations
and measuring distances, perimeter, and areas using predefined coordinate systems and units, as well
as copying location coordinates for further use. The base layers can be raster, that is, GeoTiff or JPEG
2000, format, and are georeferenced retaining the control points saved in (meta)tags or vectors—using
shape files (ESRI shape file format) with attribute data (dbf, dBase file format). The limited functionality
of geospatial PDF involves the operations of displaying geographical coordinates, as well as searching
and marking the desired locations. Geospatial PDF can also contain the attachments (or links) to the
web pages or other maps, images, or any other documents. This way, the form of tiling of map sheets
into classic atlas form is realized. Another proposal is OpenGeo PDF. “In essence, OpenGeo PDF is
the incorporation of the Open Geospatial Consortium’s (OGC) GeoPackage standard to store featureInformation 2019, 10, 12 8 of 14
attributes in a universally accessible PDF container” [31]. This way, the analog (classic) paper map
gains a new quality that brings the implementation of augmented reality into it closer.
There are several challenges highlighted in the summarizing tendency of augmented expression
for paper maps [32]. The technology using markers is the hardware aspect of the mainstream of possible
future paper map AR systems using mobile terminals (smartphones; however, HMD (head mounted
display) technologies are an alternative solution, ibid.). A key technical challenge is tracking the
location using obviously visible markers on paper maps compared with the location obtained from GPS
signals. The competing solution uses geographical, natural (or artificial) features (or textures) using
smart algorithms for geolocalization supporting GPS signals (ibid.). Combining these two procedures
also requires the use of remote geolibraries, providing both spatial data and applications (in form of
SaaS or PaaS, i.e., software as a service and/or platform as a service technologies). In this case, a reliable
wireless connection is necessary. This way, the paper map must be characterized by value added
information, presenting new utility. The obvious characteristic seems to be wider scene presentation,
which is not (or not adequately) shown on small smartphone displays (despite the possibility of
zooming and panning). The wireless connection characterizes the AR real-time systems—when
the paper map is only the historical documentation (for previously recorded spatial situation
situation) and aims, inter alia, at updating the spatial data. Then, the whole system may function
as the “unified cartography standard” and the “AR system for paper map will be universal” [32].
The geolocation service of such a system (based on GPS signal) should operate without disturbances
even in the case of a lost wireless network connection, necessary for updates or acquisition of detailed
features of spatial data. Another quality, showing the advantage of such a system, is an emergent
phenomenon rising from the quality of the paper map, that is, created and prepared by authorized and
qualified professionals (cartographers), which is used to synthetize and generalize spatial information
in the form of a cartographic map and aims at the non-professionals helping them to undertake their
spatial decisions, targeting their movements, directions, or perception of detailed location features
or values. This conclusion has also been confirmed by studies of the use AR in tourism, which
revealed that the user experience (UX) is formed by the correlation of AR system features and the
perceptions and experience of tourists [33], both in urban heritage areas (outdoor) and inside buildings
(indoor) [34].
On the other side, research experiments proved that experience and qualification of map users
matter. Those that had previous experience of the spatial data handled the tasks better using only
the printed maps, contrary to those less experienced, who smartly and more efficiently used AR [35].
Some other researchers indicated the importance of affordances (theory and concept of assets and
possibilities perceived, developed in psychology), which users can perceive in real and virtual
worlds [36].
5. Map Context and AR Technology in Details
Since some time ago, each year, Gartner, Inc. has identified and reported top strategic technology
trends and hype cycles of emerging technologies on the market. In 2016, the company put virtual
reality and augmented reality in fourth position after intelligent things (third) and intelligent
applications (second) on the list, enumerating the importance of the Information Technologies in
2017. Simultaneously, AR has been pointed out as the information technology that crossed the peak of
inflated expectation and is closer to maturity. Designers, programmers, and users got rid of illusions of
AR and the technology will enter into the next stages of enlightenment and (real) productivity [37,38].
In 2018, Gartner, Inc. highlighted AR as part of a common technology trend (in sixth position) named an
‘immersive experience’, together with VR and MR—all enumerated technologies create “combined shift
in perception and interaction models, changing the way in which people interact with the digital
world” [39].
Scientific approaches differentiate between two main types of AR technologies: marker based
AR (prevailed indoor applications) and markerless/gravimetric AR (used in outdoor applications).Information 2019, 10, 12 9 of 14
Marker-based AR uses template markers or 2D barcodes, (e.g., Quick Response Code i.e. QR-codes,
or similar Datamatrix, etc.). “This reality type uses visual marker known as fiducial or AR card to
determine center, orientation and range of coordinate system. The system detect marker, identify and
calculate pose of the object with help of computer vision techniques. ( . . . ) Marker-less AR utilizes
GPS (geopositioning), compass and other related sensors. Augmented reality browsers help users to
navigate between POIs (Point of Interests) appear on camera view for exploring AR contents based on
location and context.” [15] (p. 115).
Simultaneously, authors point out that there are challenges of mobile augmented reality related to
the following [15]:
• Image capturing capabilities of smartphones cameras, which are dependent on lighting conditions.
• Energy consumption, which remained an open challenge for smartphones (energy efficiency).
• Access a large amount of data of AR applications over networks for locating/navigating points
of interest; any downtime of network access may harm instant response to users (networking,
constraint power computing of MAR, and data management).
• Accuracy of sensor information, which is a vital component for indoor and outdoor navigation.
• Lighting conditions, with which technologies are struggling, to remain readable in bright
outdoor conditions.
• Technology adoption life cycle rising from the fact that people resist change to adopt new
operating mechanisms for handling devices and learning new methods of interactivity and
Information 2018, 9, x FOR PEER REVIEW 9 of 13
realism (UI/UX challenges).
On the
Last butother side,issome
not least significant
the problem voices warn
of security that the of
and privacy growing volume of MAR.
using networked digital data might
disappear
On theasother
a result ofsome
side, a sudden crash, or
significant might
voices be wiped
warn that theout in result
growing of crime
volume of or war. data
digital “…digital
might
data of crucial
disappear importance
as a result to archivists
of a sudden crash, and futurebehistorians
or might wiped out areinpotentially underorthreat
result of crime war. from
“ ...
deletion,
digital corruption,
data theft, obsolescence
of crucial importance and and
to archivists natural or historians
future man-madeare disasters. (…)under
potentially We’rethreat
only from
just
beginningcorruption,
deletion, to understand how
theft, important this
obsolescence and data
naturalis and what the consequences
or man-made disasters. ( . might be ifonly
. . ) We’re we lost
just
it.” [40] Maps, as the most valuable and important product of human culture, science,
beginning to understand how important this data is and what the consequences might be if we lost and economy,
are [40]
it.” especially
Maps, vulnerable
as the mostto the above-mentioned
valuable and important threats.
productOther instances
of human derived
culture, from
science, andgeospatial
economy,
databases
are (as described
especially vulnerable ontoFigure 1), as well as all the
the above-mentioned digital Other
threats. imagesinstances
(photos), derived
can be similarly treated.
from geospatial
databases (as described on Figure 1), as well as all the digital images (photos), can be similarly treated.
6. Summarizing Problems Concerning MAR and Maps
6. Summarizing Problems Concerning MAR and Maps
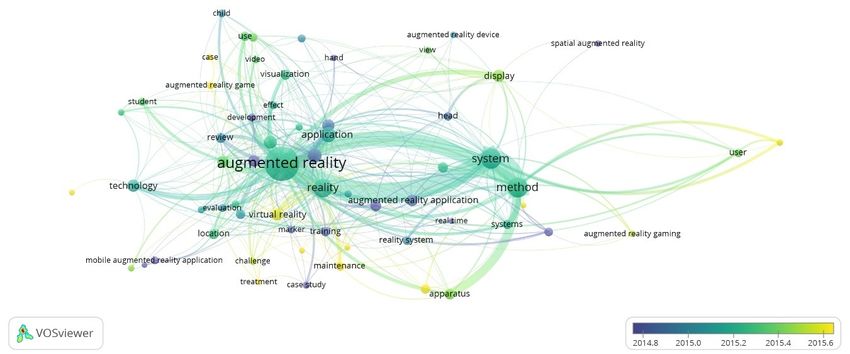
The literature review, covering the time since 2009, reveals the changing focus on problems
concerning AR. Thereview,
The literature database searchedthe
covering with most
time cited
since publications
2009, was
reveals the Microsoftfocus
changing Academic. There
on problems
were 5000 scientific
concerning AR. Thepapers. A contextual
database searched analysis
with mostof titles
citedhas been visualized
publications was using the VOSviewer
Microsoft Academic.
tool (v.1.69,
There were [41],
5000Figure 3). papers. A contextual analysis of titles has been visualized using the
scientific
VOSviewer tool (v.1.69, [41], Figure 3).
Figure 3. Contextual analysis
3. Contextual analysis of
of titles
titles of
of publications
publications concerning
concerning augmented
augmentedreality
reality(AR)
(AR)inin the
the
Microsoft Academic base since 2009.
The centroid weight of issues moved during the observed time from the methodological
problems related to hardware and software challenges to well formed MAR with aspects such as
reality systems, surveys concerning users, applications, learning, and space.
A similar procedure has been applied to the 1000 most cited publications in the Google ScholarFigure
Information 3. 10,
2019, Contextual
12 analysis of titles of publications concerning augmented reality (AR) in the
10 of 14
Microsoft Academic base since 2009.
The centroid
The centroidweight
weight of issues
of issues movedmoved during
during the observed
the observed time
time from thefrom the methodological
methodological problems
related
problemsto hardware
related toand softwareand
hardware challenges
softwaretochallenges
well formedtoMAR
well with
formedaspects
MARsuch asaspects
with reality systems,
such as
reality systems,
surveys surveys
concerning concerning
users, users,
applications, applications,
learning, learning, and space.
and space.
A similar procedure hashas been
been applied to the
the 1000
1000 most
most cited
cited publications
publications in the Google Scholar
base (Figure 4). The current main issues again concern mobile augmented reality systems and their
applications and
applications and users, which
which confirms
confirms previous
previous observations.
observations.
Figure 4.
4.Contextual
Contextualanalysis of titles
analysis of publications
of titles concerning
of publications AR in the
concerning ARGoogle
in theScholar
Googlebase since 2014.
Scholar base
since 2014.
Information 2018, 9, x FOR PEER REVIEW 10 of 13
Considering
Consideringthe thesearch
searchwithin publications
within of the
publications Google
of the Scholar
Google basebase
Scholar of theofterms AR, digital
the terms map,
AR, digital
and paper map, the results reveal slightly different aspects: the mainstream of publications
map, and paper map, the results reveal slightly different aspects: the mainstream of publications focused
on the real
focused onworld using
the real earlier
world usingoverworked achievements
earlier overworked concerning
achievements AR. Current
concerning AR. problems involve
Current problems
depicting the human past and present milieu using either MAR or SAR technologies
involve depicting the human past and present milieu using either MAR or SAR technologies in real- in real-time
(Figure 5).
time (Figure 5).
Figure5.5.Contextual
Figure Contextual analysis
analysis of
oftitles
titlesof
ofpublications
publicationsconcerning
concerningAR
ARand
andmap
mapGoogle
GoogleScholar
Scholarbase
base
since2014.
since 2014.
7. Intelligent Augmented Geovisualization, Digital, and Paper Map
Paul Levinson, in his book, The soft edge a natural history and future of the information
revolution, wrote the following: “(...) an information technology will survive to the extent that it
satisfies human needs better than its rivals. (…) First, the ongoing evolution of new media, usually
with profound unintended consequences, means that the rivals of any given medium are often in
flux. Second, a given medium usually performs a variety of tasks, which results that it may well best
its rivals in one area, and fail against the same or a different set of rivals in another area.” [42] (p. 185).Information 2019, 10, 12 11 of 14
7. Intelligent Augmented Geovisualization, Digital, and Paper Map
Paul Levinson, in his book, The soft edge a natural history and future of the information revolution,
wrote the following: “(...) an information technology will survive to the extent that it satisfies human
needs better than its rivals. ( . . . ) First, the ongoing evolution of new media, usually with profound
unintended consequences, means that the rivals of any given medium are often in flux. Second, a given
medium usually performs a variety of tasks, which results that it may well best its rivals in one area,
and fail against the same or a different set of rivals in another area.” [42] (p. 185).
The idea concerning an intelligent augmented analogue map (or analogue image) is based on the
opinion that a classic map (or image/photo) would have advantages not only in critical situations
(blackout, no mobile or WiFi coverage, or no GPS signal for any reason). A mobile device application
could reveal and interpret especially prepared markers (e.g. radio-frequency identification - RFID
tags) hidden in the analogue map. This set of hidden tags included into the symbology and legend of
the map allows using the map (or image) in the classic, traditional way without disturbing human
perception. Simultaneously, these tags expand the volume of information contained on the printed
paper map (or photo, e.g., they reveal metadata).
From the point of view of a cartographer/geographer, it is necessary to prepare an additional
steganographic information layer of the map, overlaid on basic, printed content, thematic layers and
calibrated with markers, which make its augmenting possible. The mix of known technologies can be
used to include the intelligent, augmented paper map into the digital world, inter alia:
• digital and classic steganography;
• augmented reality, software applications;
• fiducial markers;
• mobile devices with different sensors, GPS, etc.;
• access to GPS and WiFi signal;
• (last but not least) analogue (printed) paper map (or image/photo).
This way, augmented paper (printed) maps (or photos) would become the (more) intelligent
things included into the chain of digital device use, and does not lose its primary function. On the
other side is mobile intelligent application. The new idea to use AR markers is also discussed in
scientific discourse. Once the POI (point of interest) in the real world coupled with its location on the
map (no matter if analogue or digital) is identified, the novel mobile interaction technique utilizing
projected markers (using pico-projectors) makes it possible to reveal additional information about the
place and/or surrounds [43]. Markers can be presented on demand depending only on recognized
locations of POI in the real world (empirical studies provided the value of such a solution, despite some
limitations related to lightning), but the same can be applied to analogue map or images, if only the
location is known. A comparison of users’ behavior during navigation using AR either on a digital
or augmented paper map proved that they “did not subjectively perceive differences between these
options” [44]. On the other side “Augmented Reality compared to virtual reality offers a stronger
feeling of immersion for the user” [45]. The conclusion of merging the natural way using paper and
digital maps seems to be the optimal solution [46].
Another trend is convergence of the two above-mentioned technologies: AR and geovisualization
(AR&GeoVis), which intertwined themselves, and created rather new possibilities in science and
economy (as well as in entertainment, e.g., in games). Science gains from easier identification
and interpretation of spatial patterns and complex relations in a geographical context. Moreover,
an interactive approach of mixing AR&GeoVis reflects variability of geographic objects and facilitates
the right decisions. Geovisualization uses visual representations of geospatial information and
reflects consciousness, understanding, and construction of knowledge about human milieu and
the environment at a geographic scale, and in turn, facilitates the creation of visual representation of
these aspects, more often also using AR tools. It has to be realized in an intelligent way, attracting the
recipients using understandable transfer of information.Information 2019, 10, 12 12 of 14
Advancement of ‘digital geographies’, understood as the modus operandi of geographical studies
and applications in spatial economy, is the signal of fundamental disciplinary turn of geographic praxis.
“Emphasis remains on how an engagement with the digital develops our collective understandings
of cities and development, as well as health, politics, economy, society, culture, and the environment,
among others” [47]. AR plays an important role in this digital turn. The convergence of GIS, AR,
WebGIS, and digital mobile maps, which are the fundamentals of the recent technology named
(generally speaking) story maps, created quite a renewed way of presenting spatial data, and aimed
to reach two targets, scientific and commercial, using online geospatial technologies (e.g., ESRI story
maps, Google Earth Outreach).
Rather new possibilities are opening for intelligent map creation with the use of augmented
reality smart glasses. Extending the volume of attributes and spatial data on maps with georeferenced
digital hologram information from a network may be the next real step in map construction and
ARSGs, cooperating with some of the above-mentioned technologies, and may far better address
human needs such as cognitive, tension-release, affective, social integrative, and personal ones,
gratifying life efficiency, enjoyment, desired enhancement of reality, physical (sensual), social,
and self-expression [24].
Funding: This research received no external funding.
Acknowledgments: Research realized within the framework of the project “ICT in geography” with support of
Faculty of Geography and Regional Studies, University of Warsaw.
Conflicts of Interest: The author declares no conflict of interest.
References
1. Longley, P. Geographic Information Systems and Science; John Wiley & Sons: Hoboken, NJ, USA, 2005;
ISBN 0-470-87000-1.
2. Chrobak, T. Digital Map and Its Usefulness in Information Society; ITU: Geneva, Switzerland, 2015.
3. Makowski, A. System Informacji Topograficznej Kraju: Teoretyczne i Metodyczne Opracowanie Koncepcyjne;
Oficyna Wydawnicza Politechniki Warszawskiej: Warszawa, Poland, 2005; ISBN 978-83-7207-581-9.
4. Hate Map. Available online: http://users.humboldt.edu/mstephens/hate/hate_map.html (accessed on
6 December 2018).
5. GPSmaniak. Available online: http://www.gpsmaniak.com/new/mapy-papier.htm (accessed on 1 January 2016).
6. Werner, P.; Jażdżewska, I.; Zwolinski, Z. Current state and future perspectives of university education of
GIS and geoinformation in Poland. In GIS in Higher Education in Poland: Curriculums, Issues, Discussion;
Wydawnictwo Uniwersytetu Łódzkiego: Łódź, Poland, 2015; ISBN 978-83-8088-140-2.
7. Schöning, J.; Hecht, B.; Kuhn, W. Informing online and mobile map design with the collective wisdom
of cartographers. In Proceedings of the 2014 Conference on Designing Interactive Systems–DIS ’14,
Vancouver, BC, Canada, 21–25 June 2014; ACM Press: Vancouver, BC, Canada, 2014; pp. 765–774.
8. Azuma, R.T. A Survey of Augmented Reality. Presence Teleoperators Virtual Environ. 1997, 6, 355–385.
[CrossRef]
9. Pardel, P. Przeglad˛ ważniejszych zagadnień rozszerzonej rzeczywistości. Stud. Inf. 2009, 30, 82.
10. Gonzalez-Sanchez, J.; Conley, Q.; Chavez-Echeagaray, M.-E.; Atkinson, R.K. Supporting the Assembly
Process by Leveraging Augmented Reality, Cloud Computing, and Mobile Devices. Int. J. Cyber Behav.
Psychol. Learn. 2012, 2, 86–102. [CrossRef]
11. Bimber, O.; Raskar, R. Spatial Augmented Reality Merging Real and Virtual Worlds; Books24x7.com:
Norwood MA, USA, 2005; ISBN 978-1-4398-6494-4.
12. van Krevelen, D.W.F.; Poelman, R. A Survey of Augmented Reality Technologies, Applications and
Limitations. Int. J. Virtual Real. 2010, 9, 1–20.
13. Huang, J. A survey on human-computer interaction in mixed reality. Jisuanji Fuzhu Sheji Yu Tuxingxue Xuebao
J. Comput.-Aided Des. Comput. Graph. 2016, 28, 869–880.Information 2019, 10, 12 13 of 14
14. Arth, C.; Grasset, R.; Gruber, L.; Langlotz, T.; Mulloni, A.; Wagner, D. The History of Mobile Augmented
Reality. Institute for Computer Graphics and Vision, Graz University of Technology: Graz, Austria;
arXiv, 2015; arXiv:1505.01319.
15. Khan, A.; Khusro, S.; Rauf, A.; Mahfooz, S. Rebirth of Augmented Reality-Enhancing Reality via Smartphones.
Bahria Univ. J. Inf. Commun. Technol. 2015, 8, 110.
16. Milgram, P.; Kishino, F. A taxonomy of mixed reality visual displays. IEICE Trans. Inf. Syst. 1994, 77,
1321–1329.
17. Chuah, S. Why and Who Will Adopt Extended Reality Technology? Literature Review, Synthesis, and Future Research
Agenda; Universiti Sains Malaysia, School of Management: Kuala Lumpur, Malaysia, 2018.
18. Wassom, B. Augmented Reality Law, Privacy, and Ethics: Law, Society, and Emerging AR Technologies; Elsevier:
Waltham, MA, USA, 2014.
19. Dey, A. A systematic review of 10 Years of Augmented Reality usability studies: 2005 to 2014. Front. Robot. AI
2018, 5. [CrossRef]
20. Chatzopoulos, D. Mobile Augmented Reality Survey: From Where We Are to Where We Go. IEEE Access
2017, 5, 6917–6950. [CrossRef]
21. Swan, J.E.; Kuparinen, L.; Rapson, S.; Sandor, C. Visually Perceived Distance Judgments: Tablet-Based
Augmented Reality Versus the Real World. Int. J. Hum.–Comput. Interact. 2017, 33, 576–591. [CrossRef]
22. Ro, Y.K.; Brem, A.; Rauschnabel, P.A. Augmented Reality Smart Glasses: Definition, Concepts and
Impact on Firm Value Creation. In Augmented Reality and Virtual Reality; Jung, T., Tom Dieck, M.C., Eds.;
Springer International Publishing: Cham, Switzerland, 2018; pp. 169–181. ISBN 978-3-319-64026-6.
23. Rauschnabel, P.A.; He, J.; Ro, Y.K. Antecedents to the adoption of augmented reality smart glasses: A closer
look at privacy risks. J. Bus. Res. 2018, 92, 374–384. [CrossRef]
24. Rauschnabel, P.A. Virtually enhancing the real world with holograms: An exploration of expected
gratifications of using augmented reality smart glasses. Psychol. Mark. 2018, 35, 557–572. [CrossRef]
25. Kalantari, M. Consumers’ Adoption of Wearable Technologies: Literature Review, Synthesis, and Future
Research Agenda. Int. J. Technol. Mark. 2017, 12. [CrossRef]
26. Rauschnabel, P.A.; Hein, D.W.E.; He, J.; Ro, Y.K.; Rawashdeh, S.; Krulikowski, B. Fashion or Technology?
A Fashnology Perspective on the Perception and Adoption of Augmented Reality Smart Glasses.
iCom 2016, 15. [CrossRef]
27. Stock, B.; dos Santos Ferreira, T.P.; Ernst, C.-P.H. Does Perceived Health Risk Influence Smartglasses
Usage? In The Drivers of Wearable Device Usage; Ernst, C.-P.H., Ed.; Springer International Publishing:
Cham, Switzerland, 2016; pp. 13–23. ISBN 978-3-319-30374-1.
28. Why Augmented Reality Is the Next Disruptive Mapping Technology. Available online: http://
knowledge.wharton.upenn.edu/article/whats-next-for-the-innovation-behind-google-maps/ (accessed on
25 November 2018).
29. Morrison, A. Like bees around the hive: A comparative study of a mobile augmented reality map. Conf. Hum.
Factors Comput. Syst. Proc. 2009, 1889–1898.
30. Morrison, A.; Mulloni, A.; Lemmelä, S.; Oulasvirta, A.; Jacucci, G.; Peltonen, P.; Schmalstieg, D.;
Regenbrecht, H. Collaborative use of mobile augmented reality with paper maps. Comput. Graph. 2011, 35,
789–799. [CrossRef]
31. OpenGeoPDF. Available online: http://www.terragotech.com/products/terrago-publisher/opengeopdf
(accessed on 25 November 2018).
32. Ye, H.; Shi, R.; Li, S. Status and Tendency of Augmented Expression for Paper Map. In Applied Sciences
in Graphic Communication and Packaging; Zhao, P., Ouyang, Y., Xu, M., Yang, L., Ren, Y., Eds.; Springer:
Singapore, 2018; Volume 477, pp. 221–231. ISBN 978-981-10-7628-2.
33. Han, D.-I.; tom Dieck, M.C.; Jung, T. User experience model for augmented reality applications in urban
heritage tourism. J. Herit. Tour. 2018, 13, 46–61. [CrossRef]
34. Hammady, R.; Ma, M.; Powell, A. User Experience of Markerless Augmented Reality Applications in
Cultural Heritage Museums: ‘MuseumEye’ as a Case Study. In Augmented Reality, Virtual Reality, and
Computer Graphics; De Paolis, L.T., Bourdot, P., Eds.; Springer International Publishing: Cham, Switzerland,
2018; Volume 10851, pp. 349–369. ISBN 978-3-319-95281-9.Information 2019, 10, 12 14 of 14
35. de Almeida Pereira, G.H.; Stock, K.; Stamato Delazari, L.; Centeno, J.A.S. Augmented Reality and Maps:
New Possibilities for Engaging with Geographic Data. Cartogr. J. 2017, 54, 313–321. [CrossRef]
36. Malinverni, L.; Maya, J.; Schaper, M.-M.; Pares, N. The World-as-Support: Embodied Exploration,
Understanding and Meaning-Making of the Augmented World. In Proceedings of the 2017 CHI Conference
on Human Factors in Computing Systems, CHI ’17, Denver, CO, USA, 6–11 May 2017; ACM Press:
Denver, CO, USA, 2017; pp. 5132–5144.
37. Gartner’s 2016 Hype Cycle for Emerging Technologies Identifies Three Key Trends that Organizations Must
Track to Gain Competitive Advantage. Available online: https://www.gartner.com/newsroom/id/3412017
(accessed on 6 May 2017).
38. Gartner Identifies the Top 10 Strategic Technology Trends for 2017. Available online: https://www.gartner.
com/newsroom/id/3482617 (accessed on 6 May 2017).
39. Gartner Identifies the Top 10 Strategic Technology Trends for 2019. Available online: https:
//www.gartner.com/en/newsroom/press-releases/2018-10-15-gartner-identifies-the-top-10-strategic-
technology-trends-for-2019 (accessed on 27 November 2018).
40. Wall, M. Does Digital Mean the End of History? 2015. Available online: http://www.bbc.com/news/
technology-32315449 (accessed on 3 May 2016).
41. Van Eyck, N.J.; Waltman, L. VOSviewer–Visualizing Scientific Landscapes. Available online: http://www.
vosviewer.com// (accessed on 4 May 2017).
42. Levinson, P. The Soft Edge a Natural History and Future of the Information Revolution; Routledge: London, UK;
New York, NY, USA, 1998; ISBN 0-415-15785-4.
43. Häkkilä, J.; Rantakari, J.; Virtanen, L.; Colley, A.; Cheverst, K. Projected Fiducial Markers for Dynamic
Content Display on Guided Tours. In Proceedings of the 2016 CHI Conference Extended Abstracts on
Human Factors in Computing Systems, CHI EA ’16, Santa Clara, CA, USA, 7–12 May 2016; ACM Press:
Santa Clara, CA, USA, 2016; pp. 2490–2496.
44. Besharat, J.; Komninos, A.; Papadimitriou, G.; Lagiou, E.; Garofalakis, J. Augmented paper maps: Design of
POI markers and effects on group navigation. J. Ambient Intell. Smart Environ. 2016, 8, 515–530. [CrossRef]
45. Hadalová, Z.; Samuelčík, M.V. Augmented Map Presentation of Cultural Heritage Sites; CRC Press:
Boca Raton, FL, USA, 2014; pp. 345–349.
46. Chatain, J.; Demangeat, M.; Brock, A.M.; Laval, D.; Hachet, M. Exploring input modalities for interacting
with augmented paper maps. In Proceedings of the 27th Conference on l’Interaction Homme-Machine–IHM
’15, Toulouse, France, 27–30 October 2015; ACM Press: Toulouse, France, 2015; pp. 1–6.
47. Ash, J.; Kitchin, R.; Leszczynski, A. (Eds.) Digital Geographies, 1st ed.; SAGE Publications:
Thousand Oaks, CA, USA, 2018; ISBN 978-1-5264-4729-6.
© 2018 by the author. Licensee MDPI, Basel, Switzerland. This article is an open access
article distributed under the terms and conditions of the Creative Commons Attribution
(CC BY) license (http://creativecommons.org/licenses/by/4.0/).You can also read