Royal College environmental scan - Cutting through the health system information fog: The Royal ...
←
→
Page content transcription
If your browser does not render page correctly, please read the page content below

Cutting through the health
     system information fog:
Royal College environmental scan

                      2014
                  Spring Edition
Introduction
This environmental scan is an evergreen document. It synthesizes major health
policy related events, data, and other information that were mostly released in 2013.
In keeping with previous editions, this reference document provides a national
overview of key indicators and trends in the following four domains:

• Socio-demographic environment,

• Political environment,

• Economic environment,

• Healthcare system environment: Access, quality, and human resources for health.

It is hoped that this summary provides a useful snapshot of information that affected
our healthcare system in 2013. Information considered relevant from previous
iterations of the report has also been retained. We encourage Fellows and all other
readers to contact us at healthpolicy@royalcollege.ca if they have any comments,
questions, or to suggest new content areas for future iterations of this environmental
scan.

Research, analysis and writing team

Arun Shrichand, Senior Policy Analyst
Danielle Fréchette, Executive Director
Office of Health Systems Innovation and External Relations
Socio-demographic environment

Health Conditions
Chronic Diseases in Canada

Chronic diseases are the leading causes of death in the world, accounting for 63% of
deaths worldwide. 1 The gross impact of these diseases on deaths and disability
resonates in Canada as well. Major chronic diseases such as cancers, diabetes,
cardiovascular and respiratory diseases attributed for 72% of deaths in 2008 2, and in
a 2011 survey 56% of Canadians aged 12 and over reported that they suffered from
at least one common chronic condition. 3

              Graph 1: Canada, Leading causes of death by proportion,
                                      2011

                All other
                  30%

                                                      Cancers
                                                       30%

                                                                      Chronic lower
                                                                       respiratory
                               Heart disease
                                                                        diseases
                                and stroke
                                                                           5%
                                   25%
                                                                               Diabetes
 Source: Statistics Canada,                                                      3%
 Leading Causes of Death,                       Alzheimer's     Unitentional
 2014                                             disease         Injuries
                                                  2.60%             4%

Cancer

Cancer is the leading cause of death in Canada. Estimates project 187,600 new cases
and 75,500 deaths in Canada due to cancer in 2013. 4 Mortality rates are expected to
be higher for males than females, with 51% of a new cases leading to deaths in
males, in contrast to 49% in females. 5

                                                                                          1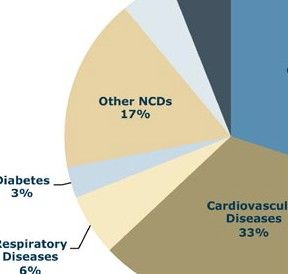
Graph 2: Estimated cases per 100,000, by province, by
                                            gender, Canada, 2013
                    1000
                                                                                           Females       Males
Cases per 100,000

                     900
                     800                                                                                  3
                                                                      3       3        3        3
                     700                            3          3                                          7            3
                            3         3       3                       9       7        8        4
                     600                            6          7                                          0            7
                            2         3       5                       4       0        5        4
                     500                            6          9                                                       1
                            9         7       7
                     400
                                                               4      4       4        4        4         5            4
                     300    4         4       4     4
                                                               3      6       9        7        9         0            3
                     200    0         1       0     2
                                                               5      2       1        2        0         0            7
                     100    2         5       6     8
                       0
                            BC        AB      SK   MB         ON     QC       NB       NS      PEI       NL           CDA

    Source: Canadian Cancer Society, Canadian Cancer Statistics , 2013

                           Graph 3: Estimated new cases and deaths, major cancers,
                                                Canada, 2013
       30,000
                                                   25,500
                             23,600                                       24,000                     23,900
       25,000
                                                            20,200
       20,000

       15,000
                                                                                                              9,200
       10,000
                                                                                   5,100
                                      3,900
                5,000

                      0
                                 Prostate               Lung                  Breast                 Colorectal

          Source: Canadian Cancer Society, Canadian Cancer Statistics, 2013       Total New Cases             Deaths

Over half (52%) of all newly diagnosed cases were lung, colorectal, prostate and
breast cancers. 6 Lung cancers attributed to a little over a quarter of all cancer
deaths. 7 Prostate cancer is the most commonly diagnosed cancer in Canadian males
and breast cancer is most commonly diagnosed in females 8. Overall, mortality rates
in cancer have declined in the last two decades, with notable decreases in lung,
colorectal and prostate cancers for men and decreases in deaths from breast,
cervical, and ovary cancers for women. Incidence rates, however, have increased in
select cancers such as liver and thyroid cancer over that same time period. 9

Cardiovascular Disease

Despite a dramatic decline in the rate of heart disease and stroke over the past 10
years (40%) 10, cardiovascular diseases remain as one of the leading causes of death
amongst Canadians. Statistics Canada reports that in 2009, cardiovascular diseases
accounted for over 68,342 deaths. 11 315,000 Canadians suffer from the effects of a
stroke and it still remains as the main reason for hospitalizations, accounting for
38,341 cases. 12

The Cardiovascular Health in Ambulatory Care Research Team (CANHEART) health
index, a measurement for optimal heart health, analyzed responses from 464,883
Canadians that participated in the Canadian Community Health Survey from 2003-

                                                                                                                            2
2011. Maclagan et al. found that according to their CANHEART health index (which
is based on health behaviours and factors that influence heart health), less than 10%
of adults and 20% of youth met the criteria for ideal cardiovascular health. The
researchers cited increasing trends of overweight/obesity, hypertension and diabetes
as key factors that have influenced these scores. 13
Diabetes
Statistics Canada reports that in 2012, 1.9 million Canadians aged 12 and over
reported living with diabetes. 14 The prevalence rates of diabetes increased by a
staggering 70% from 1998-1999 to 2008-2009, with the greatest level of increase
being observed in adults aged between 35-44 years. 15
A significant number of diabetics tend to have compounding chronic diseases to
contend with. Over a third of Canadian adults with diabetes reported having two or
more other serious chronic conditions. Diabetics are also over three times more likely
to be hospitalized with cardiovascular disease than individuals without diabetes. It is
perhaps no surprise that, although only 3.1% of all deaths in Canada are solely
attributed to diabetes, almost 30% of all individuals who died in 2008-2009 suffered
from diabetes along with other conditions. 16
Current incidence and mortality rates suggest that the number of Canadians living
with diabetes will reach 3.7 million by 2018-19.
Graph 4: Age standardized prevalence and number of cases of
diagnosed diabetes, aged one year and older, Canada, 1998-99
to 2008-09
1,400,000 0.06
1,200,000 0.05
1,000,000
0.04
800,000
0.03
600,000 Number of females
0.02
400,000 Number of males
200,000 0.01
Total Prevalence (%)
0 0
Cases Source: Public Health Agency of Canada, Diabetes in Canada, 2011 Prevalence
Injuries
Personal injury is the leading cause of death amongst children and young adults. In
2007, intentional injuries, namely suicides, accounted for nearly a quarter of all
injury related fatalities. More than four million Canadians aged 12 years and older
suffered an activity-limiting injury. Falls were the leading cause of injury in 2009-
32010, with over half of seniors and adolescents suffering from it. Almost half of all
injuries for working age adults (20 to 64) were related to sports and work injuries. 17
Graph 5: Injury related causes of The Royal College has f o r m e d
death, 2007 the Advisory Committee on
Injury Control and
Reduction Advisory
Committee (ICRAC).
Homicides ICRAC’s membership
3% includes physicians who
are subject matter experts
Poisoning and the committee will
9% provide advice and
Suicides recommendations on injury
24% reduction and control
actions where the Royal
Falls College can have influence
18% and effect under its
mandate.
Transport
related
deaths 21%
Source: Statistics Canada,
Injuries in Canada, 2011
Mental Illness
The World Health Organization estimates that over a quarter of the world’s
population suffers from one of more mental conditions during their lifetime.
In terms of prevalence, mental illness arguably Specialty medicine must continue to
impacts the Canadian population at levels strive towards enhancing the
similar to major chronic diseases 18. Over a provision of health care to all
million Canadians are reported to experience a Canadians, including those with
mental illness. A commitment that
major depressive episode annually. 19 ln the the Royal College takes seriously –
2012 iteration of the Canadian Community the College is partnering with the
Health survey, 2.8 million Canadians (10.1% Mental Health Commission of
of the population) aged 15 years and older Canada, Canadian Psychiatric
Association, and the College of
reported symptoms consistent with at least one Family Physicians of Canada to
mental or substance use disorder such as a explore approaches to support
major depressive episode, bipolar disorder, clinicians in providing optimal health
generalized anxiety disorder, and alcohol, care for patients with mental health
conditions. The recently approved
cannabis or other drug abuse or dependence. 20 Mental Health Core Competencies
lay the groundwork for future
Various epidemiological studies have revealed collaboration
higher rates of major depression among
females, young adults, once-married
individuals (widowed, separated or divorced), and low income peoples. 21 The
workplace environment has also elicited concerns over mental health; the Mental
Health Commission of Canada estimates that mental illnesses account for nearly one-
third of all short and long-term disability claims. Furthermore, the MHCC reports
mental illness issues in the workplace costs $20 billion – nearly 40% of the total
economic burden caused by mental illness annually. 22
4Risk Factors
Obesity
The World Health Organization As part of efforts of developing a national approach
points out that overweight and on health promotion and prevention, the F/P/T
obesity are the fifth leading risks governments (excluding Quebec) have established a
joint framework to address Childhood obesity.
for global deaths. Additionally,
Actualizing the framework may be a challenge
obesity is a major risk factor for however. The CIHI and Public Health Agency point
numerous diseases, including out that there is a dearth of evidence on effective
cardiovascular diseases, diabetes, interventions, stating that “Relatively few
population-level obesity prevention and management
musculoskeletal disorders and
interventions, especially public policy approaches
certain cancers. Childhood that target broader environmental factors, have been
obesity has also been associated systematically evaluated either for their effectiveness
with increased breathing or cost-effectiveness. The need for more research is
particularly pressing for obesity prevention, for which
difficulties, risk of fractures,
evidence of efficacy is limited to a small number of
hypertension, cardiovascular studies. (Public Health Agency of Canada, Obesity in
concerns and psychological Canada, 34)
effects. Globally, approximately
Curbing Childhood Obesity: A Federal, Provincial and
1.5 billion were reported
Territorial Framework for Action to Promote Health
overweight, and nearly 500 Weights, can be accessed online at
million people were obese in http://www.phac-aspc.gc.ca/hp-ps/hl-
2008. 23 mvs/framework-cadre/intro-eng.php
The preponderance of obesity is reflected in Canada as well. Looking at various
Canadian surveys conducted between 1985 and 2011, Twells, Gregory, Reddington &
Midodzi found that obesity rates have tripled during this time period. Based on linear
regression analysis, the authors project that approximately 21% of adults will be
obese by 2019. 24
Provincially, Statistics Canada's Canadian Community Health Survey reports New
Brunswick recorded the highest prevalence of obesity at 28% and British Columbia
had the lowest rates at 14.1%. As the graph below shows, apart from Yukon, all
provinces and territories have witnessed an increase in self-reported obesity over the
last decade.
Graph 6: Prevelance (%) of self-reported obesity, by
province, 2003, 2012, Canada
30%
2003
28.0%
25% 2012
26.4%
26.3%
26.10%
25.4%
25.1%
% of population
22.5%
20%
19.9%
18.8%
18.4%
18.3%
15%
17.2%
14.1%
10%
20.8%
21.3%
20.4%
20.6%
14.1%
15.2%
18.7%
20.3%
15.9%
11.9%
21.3%
22.6%
21.4%
5%
0%
NL PEI NS NB QC ON MB SK AB BC YK NT NUN
Source: Statistics Canada, Health Indicator Profile, 2013
5Smoking
Smoking rates in Canada can be considered as a public health success story.
Effective legislations and other interventions have been implemented at the F/P/T
level 25, and more households and workplaces have become smoke-free. 26
As few as 16% aged 15 and above classify themselves as smokers, which is a new
record low in Canada. 27 These rates are some of the lowest rates of smoking among
OECD countries 28 such as the US, where 28% of adults 18 and above reported
smoking cigarettes in 2012. 29
Notwithstanding, smoking undoubtedly remains a major risk factor to health
outcomes in Canada today. It is the primary risk factor in respiratory diseases such
as chronic obstructive pulmonary diseases, asthma, and lung cancer 30. Historical
remnants of traditionally high smoking rates in Quebec and Atlantic Canada have
been correlated to the high prevalence rates of lung cancer in the two regions
today. 31
Taking Different Paths
While smoking rates have declined, the prevalence of obesity and overweight in Canada has
increased significantly over the last decade.
Graph 7: Obesity and smoking rates, 2003-2012, Canada
25%
20%
% of population
15%
10% Current Smokers < 15 years
Self Reported Obesity, Adults
5%
0%
2003 2005 2007 2008 2009 2010 2011 2012
Source: Statistics Canada, Health Indicator Profile, 2012 . Health Canada, Canadian Tobacco Use
Monitoring Survey , 2012
Hypertension
Globally, high blood pressure is the leading risk for mortality 32, linked to a host of
issues to the arteries (ex. aneurism), heart (coronary heart disease, heart failure
etc.), brain (stroke, dementia etc.) and kidneys (failure, scarring etc.). 33 Of
Canadians aged 12 and above, 17.6% reported high blood pressure in 2011.
Historically, females have reported higher blood pressure; however in recent years
there has been a convergence between the two sexes. 34
6Medical conditions such as obesity have been linked to high blood pressure; in 2011,
32.4% of Canadians who were obese reported having high blood pressure, compared
to 15.8% of those who were not obese. 35
Health Indicators – How we compare
The Conference Board of Canada, an independent research organization, publishes
an annual report card on Canada’s performance on various socio-economic indicators
compared on a global scale. The report, titled How Canada Performs, assesses
population health status through an A-B-C-D grading system, based on the countries’
relative ranking to other peer countries identified in the report.
As the table below shows, Canada ranked strong (A grade) compared to its peers in
regards to self-reported health status, premature mortality, and mortality due to
circulatory diseases. However, in indicators such as infant mortality and mortality
due to cancer, diabetes and musculoskeletal diseases, Canada received a ‘C’ grade –
potentially areas that merit further consideration moving forward.
Health Indicators: International Comparisons
Canada Australia Denmark Finland France Germany Netherlands Norway Sweden U.K. U.S.
Life
Expectancy B B D C B C B B B C D
Self-
Reported A A A B B B A A A A A
Health
Status
Premature
Mortality A A B B B A A A A B D
Mortality:
Cancer C A D A B B D B A C B
Mortality:
Circulatory A A C D A D B B C C C
Diseases
Mortality:
Respiratory B A C A A A C C A D C
Diseases
Mortality:
Diabetes C B B A A B B A B A C
Mortality:
Musculo- C C D B C A C B B D C
skeletal
System
Diseases
Mortality:
Mental B B D C B B D C C C C
disorders
Infant
Mortality C B A A B B B A A C D
Source: Conference Board of Canada, How Canada Performs, 2013
7Populations at Risk
Seniors
Although Canada’s seniors are living longer, the physical and mental health of the
population is an area of concern. The graph below highlights some of the health
concerns facing this population group.
Select health concerns facing seniors
Three out of every
43% of all new
four Canadians
cancer cases will
aged 65 and older
occur in people
reported having at
aged 70 and
least one chronic
above**
condition*
From 1998-99 to Nearly half of
2008-09, seniors seniors living in
aged between 60- residential care are
64 years had the estimated to live
highest increase in with a diagnosis or
incidence of symptoms of
diabetes*** depression****
* CIHI, Health Care in Canada, 1
** Canadian Cancer Society, Canadian Cancer Statistics 2013, 27
*** Public Health Agency of Canada, Diabetes in Canada: Facts, 17
**** Public Health Agency of Canada, Report on the State, 18
Canada, like many other nations, has had a notable shift in age distributions towards
older ages. The 2011 Census shows that seniors accounted for 14.8% of population
in 2011, up from 13.7% in 2006. From 2011 to 2031, Canada’s largest birth cohort,
known as the ‘baby boom’ generation (born between 1946-1965), will turn 65
and the proportion of seniors will thus grow at a higher rate 36.
Concerns have been expressed over the impact of this cohort on the health care
system as a whole. According to the latest available data published in 2013, seniors
aged 65 and older, who comprised approximately 15% of the total population in
2011, accounted for 45% of all health care spending in that year 37. While
population aging at the aggregage level has been a very modest cost driver overall
(contributing an annual average growth of only 0.9%), the patterns are quite
variable across Canada, having greater effect in the Atlantic provinces and Quebec
compared to Ontario and Western Canada for example. 38
8Within this subset of the population, seniors Keeping an eye on
aged 80 and above will be of particular concern,
given the high costs of care for those near the
demographics will be all
end of life and those with multiple chronic the more important in
conditions (which tends to be more prevelant years to come. The
increasing number of
39
amongst older seniors) . In 2011, per capita
spending by provincial and territorial those aged 80 and over
governments for those 80 and older was has proven to be an
$20,387, compared to $6,431 for those aged 65
to 69.
40
As the graph below shows, seniors
important driver of health
aged 80 and over are expected to double in expenditure growth
numbers over the coming decades.
Graph 8: Population projection, older seniors aged 80 and over
(millions), 2016 - 2036
3.5
3 3.3
3.1
population (million)
2.5
2.7
2 2.3
2.0
1.5 1.8
1.5 1.6
1
0.5
0
2016 2019 2022 2025 2028 2031 2034 2036
*Population estimate based on Medium-growth and historical migration trends from 1981-2008
Source: Statistics Canada, Population Projections for Canada, Provinces and Territories, 2010
Keeping these demographic shifts in mind, experts such as Samir Sinha,
geriatrician and lead of the Ontario Senior Care Strategy, point out that hospital
care needs to evolve accordingly. He states that “our current acute care model
… was developed years ago when most adults tended not to live past 65 … and
usually had only one active issue that brought them to hospital”. 41
Indeed, innovative models of geriatric care need to be incorporated across the
continuum, from acute care to community and continuing care settings. It merits
strong consideration for federal, provincial, territorial and municipal governments
(who are now increasingly involved in providing long term care services) to establish
a pan-Canadian senior strategy moving forward.
Rural populations
Canadians in rural areas have higher mortality rates due to high rates of circulatory
and respiratory diseases, injury and suicide 42. Higher risk factors such as smoking,
obesity and higher blood pressure 43 have also been reported in rural areas and this
has been reflected in higher risks of hospitalization. 44
9There are caveats however - research has intimated that certain rural areas, namely
strong Metropolitan Influenced Zones (municipalities with more than 30% of
residents who commute to work in an urban core 45) enjoy better health status to the
extent that they are in fact less susceptible to certain health conditions than
populations in urban areas. 46
Indigenous peoples
Indigenous Peoples, who made up close to 4.3 per cent of the total Canadian
population in 2011, suffer the worst health of any population in Canada. They face
higher burdens of health issues in early childhood development, maternal health,
community health, mental health, chronic disease and infectious diseases. 47
The prevalence of diabetes has been shown to be significantly higher among First
Nations individuals (17.2%) on reserve compared to the general population (5%).
The HIV infection rate for Indigenous Peoples is more than three and a half times
higher than the non-Indigenous population. 48 Suicide and major depression rates are
high and over a quarter have reported problems with alcohol and a third have
experienced sexual abuse during childhood. 49 Obesity is also more prevalent among
Indigenous Peoples with over a quarter of off-reserve Indigenous adults being obese
in 2007/08 compared to 17.4% of non-Indigenous adults. 50 A 2006 study showed
that 39% of Métis, 46% of First Nations not living on a reserve and 68% of Inuit
were daily or occasional smokers, compared to 19% of the general Canadian
population. One in 20 Indigenous people are former students of the oppressive
Residential School System; these victims touch most Indigenous families and
communities, perpetuating historical traumas from one generation to the next. 51
Low income peoples
Low socio-economic status groups have Social determinants of health
poorer health status, reporting lower life
The health status of population groups such
expectancy rates 52 and higher as Indigenous and low income peoples are
hospitalization rates for conditions strongly influenced by limited access to
including mental illness, diabetes, social, cultural and economic resources
epilepsy, chronic obstructive pulmonary (which for Indigenous populations is further
compounded by historical remnants of
disease, asthma, heart failure and racism and colonialism). Addressing these
53
pulmonary edema and hypertension . social determinants of health are crucial to
The growing income inequality that has health and wellness equity at the individual,
occurred since the late 1990s in community and jurisdictional levels.
Canada 54 does raise concerns that
wealth distribution may continue to
influence long term health outcomes in the future.
Utilizing mortality data from the 1991-2006 Canadian censuses, Tjepkema and
Wilkins highlight the disparity in life expectancy amongst indigenous Canadians and
low income peoples in comparison to the general population. As the graphs below
illustrate, there is significant disparity in life expectancy at age 25 for males and
females from the highest income quintile than those of indigenous ancestry and low
income.
10Graph 9: Males, Remaining life expectancy at age 25,by income
adequacy quintile and indigenous ancestary
Highest income quintile 55.3
Total Cohort 52.6
Métis 48.5
Lowest income quintile 48.2
Non-Status Indian 48.1
Registered Indian 46.9
40 45 50 55 60
Source: Statistics Canada. Tjepkema and Wilkins, 2011
Years remaining
Graph 10: Females, Remaining life expectancy at age 25,by income
adequacy quintile and aboriginal ancestary
Highest income quintile 59.9
Total Cohort 57.9
Métis 52.5
Lowest income quintile 55
Non-Status Indian 53.3
Registered Indian 51.1
46 48 50 52 54 56 58 60
Years Remaining
Source: Statistics Canada. Tjepkema and Wilkins, 2011
11Political environment
2014 Canadian federal budget
With a majority government, the Conservative government passed its 2014 budget
on February 11th, 2014. It has been billed as a ‘stay the course’ type budget,
keeping spending at $279 billion 2014-2015, compared to $280 billion from the year
before. 55 56
The Conservative government has stated that the budget is framed around reducing
the federal deficit to $2.9 billion in 2014-15, and eventually balancing out to a $6.4-
billion surplus in 2015-16. Segments of the media 57 speculate this will likely be
hailed as a speaking point for fiscal responsibility in the next federal election, which
is slated for fall 2015.
From a health care lens, some highlights include:
• The Territorial Health Investment Fund: A $70 million investment over
three years to the three territories (Nunavut, Northwest Territories and
Yukon), to reduce their reliance on outside health care systems and
medical travel for care.
• Goods and Services Tax/Harmonized Sales tax exemption for
Canadians receiving professional services from acupuncturists’ and
naturopaths, similar to what is already in effect for other health
providers such as doctors, dentists, nurses and optometrists.
• Enhanced funding (specific increase not revealed) for the federal
Nutrition North Canada program, which provides subsidies to retailers
that provide health foods to isolated Northern Communities. The
program has been receiving 60 million a year since 2011.
• $44.9 million over five years to the government’s National Anti-Drug
Strategy. The budget points out that prescribed opioid usage has
increased by 200% since the year 2000, and the strategy is in
response to the concurrent increase in prescription drug abuse that has
been witnessed among Canadians aged 15 and above. The budget
states that the funding will “educate Canadian consumers on the safe
use, storage and disposal of prescription medications, enhance
prevention and treatment services in First Nations communities,
increase inspections to minimize the diversion of prescription drugs
from pharmacies for illegal sale, and improve surveillance data on
prescription drug abuse in Canada.” 58
12End of the 2004 F/P/T Health Accord
In December 2011, the federal government
The 2004 accord formalized a
surprisingly announced significant changes
ten year agreement by First
to the Canada Health Transfer (CHT),
Ministers on a series of
following the expiration of the 2004
commitments to improve
Federal/ Provincial/ Territorial (F/P/T)
st Canada’s health care system.
Health Accord on March 31 , 2014. The
The accord established a
federal government announced that
funding scheme that the
following the 2016-2017 fiscal year, there
federal government agreed to
will no longer be an automatic 6% annual
transfer to provincial/territorial
increase (termed as the annual escalator) in
governments mostly through
health care funding. Instead, annual
the Canada Health Transfer.
increases in the Canada Health Transfer will
be tied to nominal Gross Domestic Product
(GDP), with a minimum 3% guaranteed. Based on long term trends, the
Department of Finance projects annual increases of 4% annually. 59
Graph 11: Federal funding scenarios
60
55
50
6% increase
Billions of dollars
45 4% increase
3% increase
40
35
30
25
2012- 2013- 2014- 2015- 2016- 2017- 2018- 2019- 2020- 2021- 2022- 2023-
13 14 15 16 17 18 19 20 21 22 23 24
6% increase 29 30.74 32.58 33.54 36.61 38.81 41.14 43.61 46.22 48.99 51.93 55.05
4% increase 29 30.74 32.58 33.54 36.61 38.08 39.6 41.18 42.83 44.54 46.33 48.18
3% increase 29 30.74 32.58 33.54 36.61 37.71 38.84 40.01 41.21 42.44 43.72 45.03
Source: CBC News, Premiers Split over Flaherty, 2011
In response, the Council of the Federation (COF), a joint body comprised of Canada’s
thirteen provincial and territorial health ministers, determined it needed to explore
collaborative efforts in transforming the delivery of health care services across the
country. The COF formed the Health Care Innovation Working Group, which released
a report in 2012 recommending a pan-Canadian approach for provinces/territories in
a myriad of areas including clinical practice guidelines, competitive pricing for
pharmaceutical drugs, and team based models in areas affecting senior, aboriginal
13and mental health. 60 However following the release of this report, the working
group’s efforts have been limited to one area - pharmaceutical drugs. A set price for
the six common generic drugs was established, resulting in annual savings worth
$100 million to the provinces and territories. Additionally, the COF announced that it
was currently in negotiations with suppliers of brand name drugs, which is
anticipated to result in approximately $60-70 million savings annually. 61
The Federal government’s decision to redesign intergovernmental transfers is
arguably merited. Experts have suggested that the automatic 6% escalator in 2004
Accord has encouraged “inflationary spending” 62. Bodies such as The Health Council
of Canada, an independent national agency created following accord talks in 2003,
have reported that although accord commitments around wait times have been
promising, insufficient progress has been made around pharmaceuticals
management, electronic health records and health innovation. The agency cited
disparate levels of progress across jurisdictions in these areas and suggests that a
lack of concrete targets established during the accord contributed to this inequity. 63
These concerns have also been highlighted by the Senate Social Affairs, Science and
Technology, which tabled its progress report on the 2004 health accord in March
2012.
These issues notwithstanding, the federal
While a change in the status
government’s changes to the Canada
Health Transfer do raise a number of quo is welcomed, the expiry
concerns. For instance, the Office of the of the 2004 Health Accord
Parliamentary Budget Officer (PBO), raises numerous questions
which provides independent financial around the fiscal burden
analysis to Parliament, has voiced
concerns in its annual Fiscal Sustainability
being placed on
Report, stating that "the federal fiscal provinces/territories.
room created by the change in the CHT
escalator has transferred the fiscal
burden to provinces and territories and raised the fiscal gap of the PTLA [provincial,
territorial, local and aboriginal governments].” 64 The COF has also echoed these
fears - projecting that over a ten year span, provinces/territorial governments lose
up to $36 billion in CHT funding due to changes to the annual escalator, which leaves
them in a “less sustainable” fiscal situation. 65
Looking beyond the changes in the annual escalator, there are also tensions
regarding the revamped transfer formula utilized in the new CHT model. The Martin
government’s CHT model was redistributive in nature, considering provinces’
capacity to raise tax revenues as part of their funding formula. In contrast, the
Harper government’s CHT model abandons these equalization-type measures and
adopts a purely per capita based formula (funding based on population numbers).
Unlike the annual escalator which comes into effect in 2017-18, this new non-
equalized formula is phased in 2014-2015. The graph below highlights the
differences in distribution between the Martin government’s CHT and the Harper
government’s CHT in 2014-2015. Under Harper’s CHT, all provinces are expected to
receive $899 per resident. Therefore, British Columbia and Newfoundland and
Labrador (who received a larger share of dollars per capita under the Martin CHT)
are expected to incur the largest loss, losing $56 and $107 per resident respectively.
Whereas wealthy Alberta, which received the lowest per capita transfer under the
Martin CHT, will be the sole gainer under the Harper CHT with an increase of $235
per resident ($954 million in total absolute terms). Not surprisingly, this discrepancy
has drawn the ire of certain provincial governments, who claim that the Harper CHT
14model does not acknowledge the distinct costs and population health needs (e.g.
higher proportion of seniors in provinces such as PEI and British Columbia) 66 unique
to their respective provinces.
Graph 12: Distributional impact of Harper and Martin
governments' CHT formula, 2014-2015
1100
1000
900
$ per capita
800
700
600
500
B.C. Alta. Sask. Man. Ont. Que. N.B. N.S P.E.I. N.L.
Martin CHT Harper CHT
Source: Marchildon and Mou, The Conservative 10-year Canada
Lastly, there is the overarching question around what should be the appropriate role
of the federal government in health care. The Royal College strongly believes that
the federal government has an important role to play. The Harper Government’s
decision to revamp the CHT without conditional funding (which was also a
shortcoming of the 2004 Accord-agreed CHT 67 68) and an overall lack of direction on
fundamental reforms needed in Canada’s health care system are disconcerting.
The Canadian public has also appealed
Changes to the CHT transfers also
for further federal leadership. In a
puts into question the overarching role
survey conducted for Health Canada
of the federal government in health
by the Strategic Counsel, participants
care moving forward. The Royal
believed the federal government could
College believes the federal leadership
play a role in a wide array of areas,
has an important role to play. You
including audits of the provincial
can check out various government
health care systems, acting as a bulk
submissions where the Royal College’s
purchaser of drugs, regulating the
calls for a national human resources
drug market more effectively, and
for health observatory, among other
accelerating the integration of foreign
pan-Canadian initiatives, online at the
trained doctors other health
following URL
professionals. 69 Thus far however, the
(http://www.royalcollege.ca/portal/pa
Federal government has steadfastly
ge/portal/rc/advocacy/submissions.)
resisted such calls, pointing out “it will
play a leadership role in areas where it
has clear jurisdiction”. 70
15Economic environment
Canadian economy: Overview
The Bank of Canada reports that Canada’s economy has benefited from
improvements in global financial markets. There has been an increase in long-term
interest rates in advanced economies and Europe has stabilized following the debt
crisis that occurred a few years ago. The Bank of Canada notes that Canada’s
domestic markets have been relatively stable, with Canadian banks having continued
access to funding markets at attractive rates, and healthy balance sheets. 71
Annual % change
Indicator
2000-2012 2013f 2014f 2015f
Real GDP 2.2 2.0 2.2 2.5
Unemployment rate (%) 7.1 7.1 7.0 6.8
$millions
2000-2012 2011e 2012f 2013f
Federal Budget balance
-4.5 -16 -4.2 4.2
($billions)
Provincial Budget Balances
-1,924 -18,929 -16,000 -
($millions)
Source: Scotiabank Group, Global Forecast Update, 2013
Notwithstanding, the central bank warns
that Canada remains vulnerable to the Although not an immediate
external pressures of the euro crisis and low concern, upsets in the
interest rate environment in major global economy could have
advanced economies. Internally, the serious effects on the
Canadian housing market, namely rising
Canadian economy
prices and high debt, pose a risk to the
stability of the Canadian financial system
moving forward. 72
Health expenditure
Total spending on healthcare in Canada is estimated to be $205.9 billion in 2012,
and is forecasted to reach $211.2 billion in 2013. Canada spent $5,902 per capita in
2012 and is forecasted to spend $5,988 per capita in 2013. 73
Graph 13: Total health expenditure, Canada 1990-2013
250,000.0
Current Constant (1997)
200,000.0
$ Billions
150,000.0
100,000.0
50,000.0
0.0
Source: CIHI, National Health Expenditure Trends, 2013
As a proportion of GDP, total health expenditure in Canada was 11.3% in 2012 and it
is expected to stay consistent at around 11.2% in 2013. 74
16Graph 14: Total health expenditure as a percentage of
Provincial/Territorial Gross Domestic Product, Canada, 2000-
2013
14.0
11.6 11.6 11.4 11.3 11.2
12.0 10.2 10.2 10.4 10.5
Percentage
9.7 10.0 10.2 10.2
10.0 9.2
8.0
6.0
4.0
2.0
0.0
Year
Source: CIHI, National Health Expenditure Trends, 2013
In international comparisons, statistics from 2011 show that Canada’s health
expenditure as a proportion of GDP was above the United Kingdom’s and
Scandinavian countries’ such as Sweden, Norway and Denmark. However, the
divergence is much more significant in the United States, which recorded the highest
ratio to GDP at 17.7%. 75
Graph 15: Total health expenditure as a % of GDP, select countries,
2011
Norway 9.3%
UK 9.4%
Sweden 9.5%
Denmark 10.9%
Canada 11.2%
Germany 11.3%
France 11.6%
Netherland 11.9%
US 17.7%
0.0% 5.0% 10.0% 15.0% 20.0%
Source: CIHI, National Health Expenditure Trends, 2013
Public-Private expenditure
The public-private sector share of total health expenditure has remained stable,
maintaining approximately a ‘70-30’ split proportionately since 1997 76. In 2013, it is
forecasted that the public sector will spend $148.2 billion (70.1%) on health care.
The private sector, which primarily consists of health expenditures by households
and private insurance companies, will account for $63 billion of spending. The
annual growth rates in private sector spending are forecasted to expand at 3.4% and
2.9% in 2012 and 2013 respectively, outpacing growth rates projected in the public
sector. 77
Use of funds
Hospitals remain the largest component of health care spending, forecasted to
amount up to $62.6 billion, 29.6% of total health expenditure in 2013. 78 Drug
expenditures and physician services follow, with the former accounting for 16.3%
17and the latter amounting to 14.8% of healthcare spending. Hospitals and physicians
were primarily funded by the public sector while drugs and other health professionals
received the majority of financing from the private sector. 79
Graph 16: Proportion of total health expenditure,
by sector, 2013*
Note: Numbers have been
rounded to the nearest
percentage.
Source: CIHI, National Health Private Sector ,
Expenditure Trends, 2013 29.90%
Public Sector,
70.10%
Private Sector expenditure, by use of Public Sector expenditure, by use of funds,
funds, 2013 2013
Hospitals Other
Other
institutions Other Health
Health
9% 11% Spending*
Spending*
Public Health 13%
14%
7%
Physicians
Hospitals
1%
Drugs 39%
Other 8%
Other
Professiona
Drugs Professionals
ls (Dental,
35% (Dental,
vision etc.)
vision etc.) Physicians
30%
1%
21% Other
institutions
11%
* spending on capital, public health, administration, research etc. * spending on capital, public health, administration, research etc.
Fee-for service (FFS) payments represent about 75% of total payments to physicians in Canada, but
will it continue to do so in the future? The 2010 National Physician Survey (NPS) suggests otherwise –
while nearly half of all specialists report using FFS exclusively, only a third of specialist physicians aged
under 35 report doing so, and instead prefer a blended method of payment.
What impact will a shift away from FFS and one towards alternative compensation models have on the
overall costs of health care in Canada?
18Provincial Overview
In 2012, provincial and territorial government health expenditures are forecast to
amount to approximately $135 billion. 80 As the table below shows, total health
expenditure per capita varies across the provinces and territories. The territorial
governments reported the largest per capita spending in the country. Newfoundland
and Labrador and Alberta are forecast to spend more per person than any other
province, while Quebec and British Columbia will record the lowest per capita
expenditures at $3,651 and $3,721 respectively. 81
Province Provincial/Territorial Expenditure $ 000,000 $per capita
N.L. $ 2,685.2 $ 5,249.31
P.E.I $ 622.4 $ 4,245.15
N.S. $ 3,914.6 $ 4,124.13
N.B. $ 3,153.2 $ 4,166.81
Que. $ 29,630.4 $ 3,651.24
Ont. $ 50,864.2 $ 3,722.57
Man. $ 5,602.6 $ 4,380.81
Sask. $ 4,986.9 $ 4,565.75
Alta. $ 18,410.4 $ 4,661.84
B.C. $ 17,481.3 $ 3,721.57
Y.T. $ 253.0 $ 6,909.56
N.W.T $ 310.7 $ 7,104.71
Nun. $ 357.0 $ 10,498.86
An Uncertain Future Ahead
In the environs of an growing and aging
population, chronic diseases, wait times, and With federal dollars declared
decline in federal dollars following the expiry of following the end of the 2004
the 2004 Health Accord funding agreement in
Health Accord and
2014, provincial/territorial governments will
face difficulties regarding spending and provinces/territories concerned
questions on how to achieve sustainability of about their fiscal capacity, who
the health care system moving forward. bears the burden of paying for
Projected growth rates of private sector health care?
spending (pg.17) may further expand as a
counter-point to these ongoing public spending pressures.
As technology progresses, more services may shift from expensive hospital settings
– the traditional sphere of Medicare coverage – to homes and communities. “Passive
privatization” in healthcare funding is arguably already taking shape. For instance,
in mental health there has been a shift from treating patients in the hospital (e.g.,
hospital employed psychiatrists) towards treating patients in the community (e.g.
psychologists in private practice). Home care and access to outpatient prescription
drugs are also two examples outside of the hospital setting where Canadians often
assume out of pocket costs. 82
19While the Royal College recognizes that the involvement of the private sector in
health care is a reality in Canada, the Royal College has also long affirmed its
support for Canada’s public health care system and the principles enunciated in the
Canada Health Act. 83 In light of this, the Royal College will closely monitor these
potential trends moving forward.
Passive Privatization is
not only reflected in
increased private
spending (pg.17) but a
number of previously
covered services are also
being delisted from
provincial health
insurance plans such as
select psychological and
optometry services.
20Health System Environment: Access, Quality and
Human Resources for Health
Wait Times
Following the establishment of evidence based benchmarks on certain ‘priority areas’
in December 2005, there have been positive trends in cancer treatments, cardiac
surgery, hip and knee replacement and cataract surgery. National estimates show
that approximately eight out of 10 patients receive priority procedures within an
appropriate time frame. 84 Access to radiation therapy to treat cancer in particular
has been quite encouraging, with 97% of all patients getting treatment within four
weeks. 85 Since 2011 however, CIHI notes that national progress towards
benchmarks has largely stagnated. 86 As the table below outlines, significant
variances continue to exist between the provinces.
Proportion patient’s accessing care within wait time benchmarks, by
Priority area, April to September 2013, by Province
Benchmark B.C. Alta. Sask. Man. Ont. Que. P.E.I N.L. N.S. N.B. CAN
Hip 76% 80% 77% 68% 89% 81% 80% 92% 58% 69% 82%
replacements
≤ 26 weeks
Knee 65% 72% 66% 58% 85% 78% 61% 93% 43% 60% 76%
replacements
≤ 26 weeks
Hip fracture 83% 85% 82% 89% 83% n/a 75% 82% 82% 84% 83%
repair ≤ 48
hours
Cataract 81% 66% 70% 62% 81% 88% 54% 95% 72% 88% 81%
surgery
(high risk) ≤
16 weeks
Radiation 94% 98% 98% 100% 98% 98% 92% 97% 90% 97% 99%
therapy for
cancer ≤ 4
weeks
Minimum 5% growth since 2011 in the % of patients receiving care within
benchmark.
Minimum 5% decline since 2011 in the % of patients receiving care within
benchmark.
Source: CIHI, Wait Times in Canada, 2013
There are certain instances where the divergence between provinces is significant.
Approximately nine in 10 Quebecers who are at high risk receive cataract surgery
within 16 weeks, in contrast to only six in 10 in Manitoba. For knee replacements,
the proportion of citizens receiving surgery within the established benchmarks is
significantly higher in Ontario (85%) than Nova Scotia (43%). In Prince Edward
Island, there has been a disconcerting decline in the province by at least 10% from
2009 to 2011 in the proportion of patients having hip and knee replacements, and
cataract surgeries. 87
21In the 2010 National Physician Survey, physicians
The abovementioned variances
rated access in the priority areas accordingly:
however highlight the fact that not all
Canadians have benefited from • 50 per cent of family physicians (FPs) rate
improvements in wait times. Indeed, access to orthopedic surgeons as fair to
poor,
more work needs to be done,
• 15 per cent of FPs rate access to cardiac
including uptake of reporting care services as fair to poor,
procedures beyond the five priority • 13 per cent of FPs rate access to cancer
areas such as cancer care, diagnostic care as fair to poor and
• 37 per cent of all physician rate access to
imaging 88, gastroenterology, and
advanced diagnostic services (e.g., CTs,
psychiatry. 89 MRIs) as fair to poor.
Source: 2010 National Physician Survey (CFPC,
CMA, Royal College)
Wait Times: The impact of alternate levels of care stays
The Wait Times Alliance (WTA), a coalition of various medical national specialty societies, argues
that alternate levels of care (ALC) stays are a growing detriment to wait times in Canada.
ALC generally refers to patients who continue to occupy an acute care hospital bed after the acute
phase of their inpatient stay is complete. The WTA points ALC patients accounted for 14% of
hospital beds in 2007-2008, which results in long wait times and overcrowding in emergency
departments. An aging population (vulnerable to health concerns such as dementia), combined
with lacking institutional and community support for chronic care patients has exacerbated
concerns.
The report, Time for transformation: Canadians still waiting too long for health care can be accessed
online at the following URL (www.waittimealliance.ca).
Quality of Care: How Canada measures up internationally
The OECD has developed 30 indicators that allow international comparisons on
aspects of quality of care. Canada ranks highly on certain indicators such as keeping
low hospital admissions for asthma and diabetes, influenza vaccinations in seniors 90
and also fares well in screening and survival rates for breast, colorectal and cervical
cancer. 91
Graph 17: Avoidable admissions, Asthma and Diabetes,
select OECD countries
250
217.2 Asthma Diabetes
Hospital discharges per 100,000
201.4
200
150
117
100 81.2
71.8
54.2 60.8
50
13.6 19.6
11.4
0
Canada Germany Italy United Kingdom United States
Source: CIHI, International Comparisons, 2014
22Graph 18: Breast cancer survival rate: Five-year survival
rate, select OECD countries
90.00% 89.30%
percentage
87.70%
88.00%
86.30%
86.00% 85% 84.50%
84.00%
82.00% 80.70%
80.00%
78.00%
76.00%
Canada Germany Sweden United United States OECD
Kingdom average
Source: CIHI, International Comparisons, 2014
In the areas of patient safety and adverse events however, Canada does not fare as
well. Canada reported high rates of obstetric trauma 92 and a number of cases where
unwanted foreign bodies were left in during procedures. 93
Graph 19: Number of cases of foreign body
left during procedure per 100,000, select
OECD Countries
United States
4.1
Canada 8.6
United
Kingdom 5.5
Italy 3.5 France 6.2
Germany 5.5
Source: CIHI, International Comparisons, 2014
Human Resources for Health (HRH)
This section outlines key statistics and information on the physician workforce in
Canada. Focusing primarily on specialist physicians, the section highlights HRH data
about the number of physicians, their age and sex, and Canadian/International
Medical Graduates.
The majority of the physician workforce data included in this scan has been collected
through two major data holders, the Canadian Institute of Health Information (CIHI)
and the Canadian Medical Association (CMA) Masterfile.
23This section also includes new findings from the Royal College’s research on
specialist physician employment challengs.
Physicians in Canada: Heads Counts and Physician to population Ratios
The CMA Masterfile reports that in January 2014, Although commonly
there were 74,788 physicians practicing in
used, there are a
Canada (36,485 specialists and 38,286 family
physicians). 94 These numbers, which reflect number of limitations
headcounts, have increased consistently and associated with head
have in fact outpaced the growth of the Canadian counts and physician-
population in recent years. 95 However, this population ratios. These
growth in numbers has largely compensated for
issues are highlighted on
a number of factors including: the acute
shortages of physicians experienced in the late page 25-26.
1990s and first decade of this century, more
complex patient needs (e.g., aging population, the burden of chronic diseases and
co-morbidities), and changing practice profiles (e.g., increasing demands on
physician’s time for paperwork and administrative duties 96). These and other
influencers on the medical supply underscore the need for further progress in
medical workforce planning.
Graph 20: Number of Family Physicians and Specialists, Canada,
2000-2014
40,000
38,000
36,000
34,000
32,000
Number
30,000
Family Physicians
28,000
26,000
Specialists
24,000
22,000
20,000
2004 2005 2006 2007 2008 2009 2010 2011 2012 2013 2014
Source: CMA Masterfile, January 2014
In specialty medicine, growing numbers have been observed in many disciplines and
across most provinces as well.
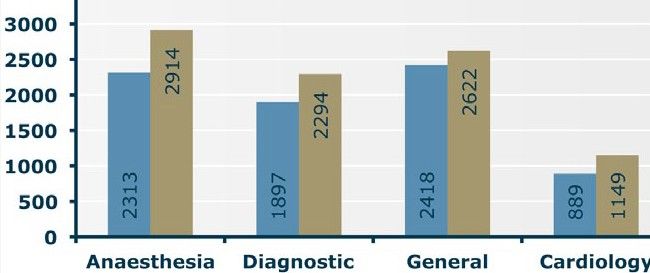
24Graph 21: Number of physicians, select specialties, by year
2002, 2014
4500
2002 2014
4000
4169
3500
3000 3144
2500
2743
2458
2000
2389
1500
1918
1835
1517
1000
1280
2368
1939
2426
2095
3947
1813
1589
1082
1186
1148
922
500
0
Source: CMA Masterfile, January 2014
Graph 22 Number of specialists per 100,000 Population,
by province, 2002, 2012
140
120
123
120
114
100
107
104
102
99
per 100,000
91
80 2002
84
80
60 2012
108
99
95
90
88
40
80
66
64
61
55
30
20
32
23
13
0
9
0
N.L. P.E.I. N.S. N.B. Que. Ont. Man. Sask. Alta. B.C. Y.T. N.W.T. Nun.
Source: CIHI, Supply, Distribution and Migration, 2003, 2013
In 2012, Nova Scotia had the highest proportion of specialist physicians, recording
123 specialists per 100,000. Since 2002, Newfoundland and Labrador reported the
largest gains in the proportion of specialist physicians in a province (progressing
from 66 to 114 specialists per 100,000 in 2012). The Northwest Territories was the
only province or territory to record a drop in numbers over this time period, falling
down from 38 specialists to 23 specialist physicians per 100,000 in 2012.
It is important to point out that there are a number of of limitations associated with
head counts and physician-population ratios when it comes to workforce
planning. Head counts and physician-population ratios assume that all physicians
provide services in equal quantity and which are uniform in nature—well known to be
25inaccurate. The effects of team based models and expanded or complementary
scopes of practice of other health professionals are also not factored in these
statistics. Lastly, and perhaps most importantly, headcounts and physician to
population ratios do not provide any sense of patient “need” for health care.
Recognizing these issues, other methodologies have been devised to offer a more
accurate representation of physician supply. For instance, the full time equivalent
(FTE) methodology developed by CIHI utilizes physician payments as an output
measure to estimate whether a physician is working full time. 97 As the graph below
shows, FTE counts paint a different picture on the number of specialist physicians per
100,000 in the country.
Graph 23: Number of specialist physicians per 100,000
population, by province , by FTE and headcount, 2011-2012,
2012
140 FTE Count (2011-2012) * ** Headcount (2012)
120
100
per 100,000
74
80 68
61
59
58
123
52
120
60
114
48
107
45
104
43
102
99
38
91
84
40
80
20
0
N.L. P.E.I. N.S. N.B. Que. Ont. Man. Sask. Alta. B.C.
* Does not include Anesthesia specialists **Based on Fee-for-Service Billings
Although certain limitations of the FTE methodology are widely recognized, such as
being based on fee-for-service income data, FTE counts arguably better depict
physician human resources than simple headcounts.
Specialist Physicians in Canada: Age
Looking at both ends of the professional lifecycle, 42.3% of specialist physicians
were aged 55 and over while approximately 30.7% were aged 44 and under in
2014. 98
From a discipline specific lens, Pediatric Emergency Medicine, Pediatric Hematology
and Critical Care Medicine counted the highest proportion of physicians aged 44 and
under amongst medical specialties. Given that the disciplines are still relatively
young, this is not altogether surprising. In contrast, Cardiology (pediatric stream)
and Occupational Medicine reported the largest proportion number of senior
physicians, aged 55 and above, 100% and 83% respectively. It is also worth noting
that more than half of the medical workforce in psychiatry, dermatology, and public
health and preventative medicine were equally aged 55 or more.
26Graph 24: Medical Specialists, proportion of physicians aged
44 and under, top ten disciplines, 2014
Pediatric Emergency Medicine 100.0%
Pediatric Hematology 93.3%
Critical Care 87.4%
Adolescent Medicine 80.0%
Neonatal Perinatal Medicine 73.3%
Developmental Paediatrics 71.4%
Neuroradiology 50.0%
Child and Adolescent Psychiatry 48.4%
Nephrology 44.4%
Gastroenterology 43.8%
Source: CMA Masterfile, 0% 20% 40% 60% 80% 100% 120%
January 2014
Proportion aged 44 and under
Graph 25: Medical Specialists, proportion of physicians aged 55
and above, top ten disciplines, 2014
Cardiology (pediatric stream) 100.0%
Occupational Medicine 69.8%
Psychiatry 54.8%
Public Health & Preventative… 53.7%
Dermatology 51.5%
Rheumatology 46.4%
Paediatrics 44.5%
Nuclear Medicine 44.4%
General Internal Medicine 43.5%
Neurology 43.2%
Source: CMA Masterfile, 0% 20% 40% 60% 80% 100% 120%
January 2014
Proportion aged 55 and above
Amongst surgical specialties, Gynecologic Oncology and Colorectal Surgery counted
the highest proportion of surgeons aged under 45 at 100% and 90% respectively.
Whereas Cardiothoracic Surgery and Ophthalmology counted the largest proportion
of surgeons aged 55 and above, at 83.2% and 49.9% respectively.
27Graph 26: Surgical Specialists, proportion of Surgeons aged 44 and under,
By Discipline, 2014
Gynecologic Oncology 100.0%
Colorectal Surgery 90.0%
General Surgical Oncology 78.6%
Maternal Fetal Medicine 75.7%
Gynecologic Reproductive Endocrinology & Infertility 55.6%
Cardiac Surgery 47.5%
Otolaryngology 33.8%
General Surgery 33.3%
Orthopaedic Surgery 33.0%
Neurosurgery 33.0%
Plastic Surgery 30.9%
Urology 30.6%
Obstetrics & Gynecology 30.1%
Thoracic Surgery 26.0%
Paediatric General Surgery 26.0%
Ophthalmology 24.3%
Vascular Surgery 22.7%
Cardiothoracic Surgery 0.0%
Source: CMA Masterfile, January
0% 20% 40% 60% 80% 100% 120%
2014 Proportion aged 44 and under
Graph 27: Surgical Specialists, proportion of Surgeons aged 55 and above, by
Select Discipline, 2014
Cardiothoracic Surgery 83.2%
Ophthalmology 49.9%
Vascular Surgery 45.5%
Urology 43.3%
Plastic Surgery 42.8%
Obstetrics/Gynecology 42.2%
Otolaryngology 41.0%
General Surgery 39.1%
Orthopaedic Surgery 38.8%
Neurosurgery 38.5%
Thoracic Surgery 33.0%
Paediatric General Surgery 32.5%
Cardiac Surgery 9.3%
Maternal Fetal Medicine 2.7%
Gynecologic Reproductive Endocrinology & Infertility 0.0%
Gynecologic Oncology 0.0%
General Surgical Oncology 0.0%
Colorectal Surgery 0.0%
0% 20% 40% 60% 80% 100%
Source: CMA Masterfile, January 2014
Proportion aged 55 and above
28The age gap among specialists is most apparent in laboratory medicine, with nearly
half (49.7%) of all laboratory specialists aged 55 and above and only 21.6% of
physicians under the age of 45.
Graph 28: Laboratory Specialists, proportion of
physicians aged 44 and under, by discipline, 2014
Haematologic
32.9%
Pathology
Medical
32.6%
Microbiology
Anatomical
22.0%
Pathology
Medical
16.1%
Biochemistry
General Pathology 14.0%
Neuropathology 10.0%
0% 10% 20% 30% 40%
Source: CMA
Masterfile, January
2014 Proportion aged 44 and under
Graph 29: Laboratory Specialists. proportion of
physicians aged 55 and above, by discipline, 2014
Medical
65.5%
Biochemistry
General Pathology 58.2%
Neuropathology 53.5%
Haematologic
47.4%
Pathology
Medical
45.6%
Microbiology
Anatomical
47.1%
Pathology
0% 20% 40% 60% 80%
Source: CMA Masterfile,
January 2014 Proportion aged 55 and above
29You can also read