SANS Institute Information Security Reading Room - SANS.org
←
→
Page content transcription
If your browser does not render page correctly, please read the page content below
SANS Institute
Information Security Reading Room

The Afterglow effect and Peer
2 Peer networks
______________________________
Jerome Radcliffe,

Copyright SANS Institute 2020. Author Retains Full Rights.

This paper is from the SANS Institute Reading Room site. Reposting is not permitted without express
written permission.
                      The Afterglow effect and Peer 2 Peer networks


                                                  GIAC (GCIA) Gold Certification


                                          Author: Jerome Radcliffe, jay.radcliffe@gmail.com


                                                    Advisor: Johannes B. Ullrich, Ph.D


                                                           Accepted: April 5, 2010


                                                                     Abstract


                         Key
  fingerprint
  =
  AF19
  FA27
  2F94
  998D
  FDB5
  DE3D
  F8B5
  06E4
  A169
  4E46

                     Peer to Peer networks (P2P) are heavily used for media sharing and distribution of files.

                     Very few studies have looked at the effects and behaviors of these types of networks

                     specifically during the period of time after the P2P connection has been terminated. This

                     study will look specifically at this “Afterglow” period to look at the statistics related to

                     the traffic seen during that period. Additionally qualitative methods will be used to look

                     at this data for anomalies and malicious traffic.

       © 2010 The SANS Institute                          As part of the Information Security Reading Room                 Author retains full rights.
                                                                                                                                2


                     1.1. Introduction


                       The history of peer‐to‐peer (P2P) networking can be traced back to the late


                   1990’s when computer technology had progressed to the point of easy viewing and


                   storage of music and video files. This progression precipitated the desire for users


                   to exchange, distribute and share these files amongst each other. The available


                   technology, at that time, was cumbersome. It required an individual who wished to


                   share or distribute files to set up a server and run a program that was dedicated to


                   hosting those files. Setting up such a server, however, was beyond the skill of the


                   typical computer user. In addition, there were other hurdles that prevented easy


                   access, including setting up user accounts, letting users know where to locate the


                   server, and what files were available to access. This desire for users to share their


                   files in a less cumbersome format eventually prompted the development of software
                          Key
  fingerprint
  =
  AF19
  FA27
  2F94
  998D
  FDB5
  DE3D
  F8B5
  06E4
  A169
  4E46

                     and services that allowed users to access and distribute files amongst themselves,

                     which came to be known as P2P networking (Johnson, McGuire, & Willey, 2008).

                         BitTorrent is a protocol that is used to distribute a file or files between multiple

                     clients (Cohen, 2008). The advantage that it has over traditional server/client

                     methods is the fact that there may be multiple hosts on different networks that can

                     provide the files simultaneously. This allows a host to download the file faster and

                     more efficiently then directly from one server. This efficiency increases with the

                     number of hosts that participate in the torrent. The process for distributing a file or

                     files starts with the creation of a torrent file. This file contains two important

                     things: the location of a “tracker” and information about the makeup of the file or

                     files. The “tracker” is a URL to a server that keeps track of all of the peers that are

                     Jerome Radcliffe;jay.radcliffe@gmail.com
       © 2010 The SANS Institute                          As part of the Information Security Reading Room                 Author retains full rights.
                                                                                                                                  3


                   participating in the torrent. It is important to note that the tracker does not have


                   any pieces of the file that are inside of the torrent, it only keeps track of the


                   participating peers (Cohen, 2008). To keep track of the makeup of the files


                   contained in the torrent, the files are broken up into smaller pieces and an MD5


                   hash is created. The files are broken down into smaller pieces to increase the


                   efficiency of transferring pieces from peer to peer. This allows a peer to grab pieces


                   of the torrent from multiple peers simultaneously while assuring the continuity of


                   the files as a whole.


                       One of the concepts that this study will focus on is “Afterglow”. This is the


                   period of time after the P2P session has terminated but there still may be incoming


                   requests for searches or downloads to what was previously available while the P2P


                   session was still active. These connection attempts are rejected by the system after
                          Key
  fingerprint
  =
  AF19
  FA27
  2F94
  998D
  FDB5
  DE3D
  F8B5
  06E4
  A169
  4E46

                     the termination of the listening P2P program. There are several reasons that these

                     connections are relevant. First, it is a way to evaluate the efficiency of the P2P

                     program and its ability to keep an accurate record of systems that are still

                     participating. Inefficiencies in this methodology of keeping track of participants

                     would greatly increase the time needed to find and acquire participating systems

                     and subsequently acquiring those files. Second, there are some security

                     implications that need to be considered with these afterglow connection attempts.

                     There can be difficulty in separating these connection attempts, which are legitimate

                     and harmless, from traffic that could be malicious. Studying the decay rate of this

                     afterglow period might provide a better idea of which connections are malicious and

                     which are harmless and expected. An additional security consideration is the use of

                     Jerome Radcliffe;jay.radcliffe@gmail.com
       © 2010 The SANS Institute                           As part of the Information Security Reading Room                  Author retains full rights.
                                                                                                                                      4


                   the P2P systems to identify systems that are potential victims for an attacker. An


                   attacker might connect to a P2P system and utilize that information in


                   reconnaissance to identify a system and a method to connect to that system via the


                   port that the P2P program uses. These attacks could start or continue long after the


                   P2P participation is over.


                     1.2. Purpose and Hypotheses


                       The purpose of this study is to measure the “Afterglow” period after a P2P session is


                   terminated. In order to accomplish this goal, a P2P session will be established and the


                   number of incoming connections will be tracked. After a predetermined period of time,


                   the P2P program will be turned off and participation in the P2P will stop. Tracking of


                   inbound connections after the termination of the program will continue for a period of


                   time. As previously noted, this period of time after the P2P session is terminated is called
                          Key
  fingerprint
  =
  AF19
  FA27
  2F94
  998D
  FDB5
  DE3D
  F8B5
  06E4
  A169
  4E46

                     the “Afterglow” period.

                         In order to measure the afterglow period, we need to count the number of connection

                     attempts that are made once the program is turned off. This can be done by monitoring

                     the traffic coming to and from the computer running the P2P software. On the

                     monitoring computer a program called Snort is installed, this program will track the

                     number of connection requests on any network port (Beale, Poor, & Foster, 2004). For

                     each trial, a new set of Snort rules were created specific to the port settings designated in

                     the uTorrent program. There are two types of connections that were tracked, TCP and

                     UDP. All inbound TCP connections to the P2P computer will only have the SYN flag set

                     and be made from the outside to the P2P computer (Stevens, 1994). As UDP is a

                     connectionless protocol, there are no unique flags to key on (Stevens, 1994). A rule is

                     Jerome Radcliffe;jay.radcliffe@gmail.com
       © 2010 The SANS Institute                            As part of the Information Security Reading Room                    Author retains full rights.
                                                                                                                                        5


                   created to look just for UDP packets whose destination is the P2P computer on the port


                     number specified (Beale, Poor, & Foster, 2004).


                         Once collected, the data was broken down into number of connections in a ten minute


                     period. An example: for the time period of 00:00 to 00:10, or the first ten minutes after


                     the connection was terminated, there were XX TCP connection attempts and YY UDP


                   connection attempts. In order to determine what the “Afterglow” looks like, the mean


                   decay time, along with the standard deviation, will be determined. Any connection


                   attempt beyond one and a half standard deviations will be considered atypical. For each


                   trial, the atypical connection attempts will be looked at in detail in order to determine


                   more information about atypical “Afterglow” attempts. Additionally, information about


                   X and Y are of interest.


                       The following are the purpose and goals for these trials:


                         1.Key

                             Tofingerprint
   =
  AF19

                                   determine what            FA27
  2F94

                                                      a normative            998D
  Ffor
                                                                       afterglow       DB5

                                                                                          P2P DE3D
  F8B5

                                                                                                sessions might06E4
  look
                                                                                                                       A169
  4E46

                                                                                                                           like. This

                     could be qualitative in the form of graphical analysis or quantitative in the form of

                     statistics.

                         2. To determine if the normative afterglow is consistent for the two connection types

                     or multiple methods of P2P sessions.

                         3. To determine if there is any consistent pattern to the connection attempts made

                     during the afterglow period that would distinguish them as malicious or suspicious. This

                     would include looking at the country of origin and repetition of connection attempts.

                     Jerome Radcliffe;jay.radcliffe@gmail.com
       © 2010 The SANS Institute                           As part of the Information Security Reading Room                     Author retains full rights.
                                                                                                                                     6


                   2. Design


                       A series of experiments were designed to explore the topic of P2P afterglow. Each


                   trial collected data related to the number of connections in response to an open P2P


                     session. The data collection was broken down into three categories. The first


                     category is the “pre‐session” connections; every test was verified to be zero


                     connections for a minimum of 2 hours before the test. This assures that the


                     connections recorded were unique to the session that was going to be used for the


                     test. The second category is “active session” connections, or connections that


                     occurred while the P2P session was active and the test server was participating in


                     data transfer. The third category is the “post‐session” connections. Post‐session


                     connections are categorized as those that took place after the P2P session was


                     terminated and the test server was not participating in data transfer.
                         Key
  fingerprint
  =
  AF19
  FA27
  2F94
  998D
  FDB5
  DE3D
  F8B5
  06E4
  A169
  4E46


                     2.1. Network

                         One problem with most modern home networks is the monitoring of inbound and

                     outbound traffic is difficult, as most networking equipment segregates the data that is

                     being transmitted to increase efficiency and security. To accomplish this goal, a device

                     called a hub is placed in the network that allows the monitoring of all the traffic flowing

                     to all the computers. A hub is a network device that distributes all the traffic it sees on

                     one port to all other ports on the hub. Diagram 1 depicts the network as it normally

                     works without a hub installed where Diagram 2 depicts the network with the hub

                     Jerome Radcliffe;jay.radcliffe@gmail.com
       © 2010 The SANS Institute                           As part of the Information Security Reading Room                    Author retains full rights.
                                                                                                                                      7


                   installed. As you can see, the installation of a hub will allow for the monitoring of all


                     traffic that flows into and out of the network (Spurgeon, 2000).


                   Diagram 1- Network with no hub


                     2.2. Hardware
                          Key
  fingerprint
  =
  AF19
  FA27
  2F94
  998D
  FDB5
  DE3D
  F8B5
  06E4
  A169
  4E46


                         In addition to the network, other equipment is needed to accomplish the goals of this

                     project. A Dell Inspiron 530 was used in this experiment to do the monitoring. Ubuntu

                     9.0 Server and an additional Network Interface Card (NIC) were both used on this

                     computer. The NIC on the mainboard was set up to talk on the network with SSH

                     installed and enabled, which allows for management remotely in a secure fashion. The

                     additional network card was setup with no IP address information and physically hooked

                     up to the hub installed at the perimeter of the network (as shown in Diagram 2). This

                     configuration will best allow programs to interface with the network traffic the hub

                     allows us to see.

                         Diagram 2 – Network with hub

                     Jerome Radcliffe;jay.radcliffe@gmail.com
       © 2010 The SANS Institute                           As part of the Information Security Reading Room                     Author retains full rights.
8
2.3. Software and Setup
Key
In fingerprint
addition to the =
AF19
FA27
hardware 2F94
998D
and network, FDB5
several DE3D
Fpackages
software 8B5
06E4
areA169
4E46
to
necessary
monitor network flow. First, a client is needed to run the P2P software as a stimulus to
generate the network traffic to and from the computer. The client will be a standard
computer running Windows XP Professional. For the first experiment, uTorrent
(http://www.utorrent.com/) , a free package that allows for communication on BitTorrent
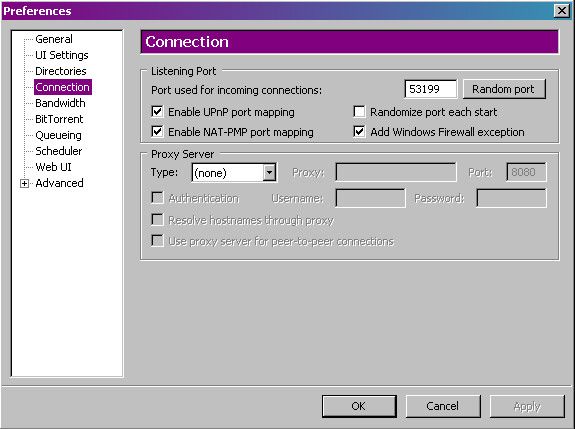
networks, was installed. After the installation of this software is complete, one
adjustment needs to be made to the default installation. Specifically, the network port
number that the BitTorrent software will use for communication needs to be specified.
This adjustment can be made in the uTorrent program by going to the Preferences and
setting the port number to something other than the default. For each trial in this
Jerome Radcliffe;jay.radcliffe@gmail.com
© 2010 The SANS Institute As part of the Information Security Reading Room Author retains full rights.
9
experiment, the port was changed. These actions are to decrease the chance that some
other program or traffic will skew the data collection.
Key
fingerprint
=
AF19
FA27
2F94
998D
FDB5
DE3D
F8B5
06E4
A169
4E46
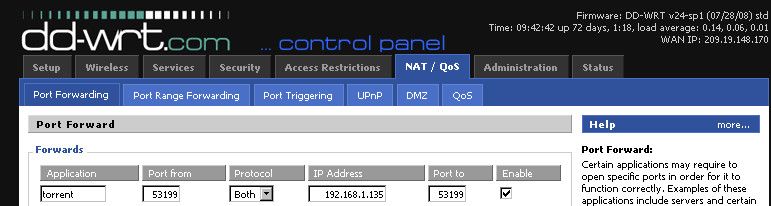
To allow for traffic from the outside to enter the network, port changes were made in
the uTorrent software including adjustments to the perimeter firewall. Before each trial
was performed, the firewall rules were matched up with the adjustments made to the
firewall device. In this case, it was a Linksys WRT54G running OpenWRT
(http://openwrt.org/). These adjustments can be located on the NAT Tab in the setup
configuration.
Jerome Radcliffe;jay.radcliffe@gmail.com
© 2010 The SANS Institute As part of the Information Security Reading Room Author retains full rights.
                                                                                                                                10


                   3. Results


                         The first step in analyzing the data was to determine the basic pattern of


                     connections for each of the four trial types, this included both an analysis of “pre”


                     and “post” sessions connections. The basic description of data for each of the four


                     trials can be seen in Table 1. The decay rate, or the rate at which connection


                     attempts decrease over time, will be the first set of analyses. This will be completed
                         Key
  fingerprint
  =
  AF19
  FA27
  2F94
  998D
  FDB5
  DE3D
  F8B5
  06E4
  A169
  4E46

                     using primarily qualitative analysis, although some quantitative statistics were used.

                     Second, the possibilities of variations between the trials were examined. Finally, we

                     looked at the source of the connections that were determined to be beyond the

                     typical connections responding.

                     Table 1

                                          Trial 1               Trial 2                Trial 3
                                       Pre       Post        Pre       Post         Pre        Post

                     N                 132        170        156        312         336          526
                                     165.22      1.54      311.58       9.99        52.50       15.31
                     Mean (SD)      (143.19)    (3.41)    (165.79)    (17.05)     (828.41)     (60.66)
                     Skew             0.86       3.38       0.31        5.51         3.55       54.92
                     Kurtosis         -0.54      13.72      -0.31       0.28        -5.13      176.60

                     Jerome Radcliffe;jay.radcliffe@gmail.com
       © 2010 The SANS Institute                          As part of the Information Security Reading Room                  Author retains full rights.
                                                                                                                                      11


                       As can be seen in the table, some of the data violated the assumption of a normal


                   distribution, which one would expect of a decay rate as many of the post values


                   should approximate zero. Keeping in mind a skew or kurtosis value of + or – 2 is


                   considered abnormal, you can see the rates for almost every trial are outside the


                   normal range. This makes it difficult to run most typical tests (such as an ANOVA or


                   t‐test) when comparing the data or attempting to describe a measure of central


                   tendency (i.e., mean, medium, mode) (Myers & Well, 1995). Whenever possible,


                   however, parametric statistics were used. In situations where data violated the


                   parametric assumptions of normal distribution, such as highly skewed or kurtotic


                   data, non‐parametric statics were used and the data will also be considered


                   qualitatively, such as through the graphs below. All data will be analyzed using SPSS


                   Version 17 unless otherwise stated.
                          Key
  fingerprint
  =
  AF19
  FA27
  2F94
  998D
  FDB5
  DE3D
  F8B5
  06E4
  A169
  4E46

                     3.1 Decay Rates Analysis

                         The first analysis examined the decay rate, or the rate at which connection

                     attempts decrease over time as measured from the time the P2P session is

                     terminated on the client side. Graph 1 shows the number of attempts made while

                     the connection was on, and Graph 2 displays the connection attempts after the

                     connection was terminated for the third trial, which used BitTorrent.

                     Jerome Radcliffe;jay.radcliffe@gmail.com
       © 2010 The SANS Institute                           As part of the Information Security Reading Room                     Author retains full rights.
                                                                                                                                      12


                           Graph 1 – Connection Attempts With Active Connection, Trial 3, BitTorrent


                          Key
  fingerprint
  =
  AF19
  FA27
  2F94
  998D
  FDB5
  DE3D
  F8B5
  06E4
  A169
  4E46


                     Jerome Radcliffe;jay.radcliffe@gmail.com
       © 2010 The SANS Institute                           As part of the Information Security Reading Room                     Author retains full rights.
                                                                                                                                      13


                   Graph 2 – Connection Attempts With Deactivated Connection, Trial 3, BitTorrent


                          Key
  fingerprint
  =
  AF19
  FA27
  2F94
  998D
  FDB5
  DE3D
  F8B5
  06E4
  A169
  4E46


                         In the first graph, the zero time, or time before connections were established, is

                     shown in addition to the increases and peaks of connections during the “active”

                     phase. In this trial, the average attempts were roughly 2500 connections per 10

                     minute interval. The second graph shows the afterglow time starting from the time

                     that the P2P session is terminated. A dramatic drop in number of connections

                     during the first 5 hours can be seen, followed by a level approaching zero after that.

                     Due to the nature of a decay, the mean and standard deviation are meaningless, as

                     Jerome Radcliffe;jay.radcliffe@gmail.com
       © 2010 The SANS Institute                           As part of the Information Security Reading Room                     Author retains full rights.
                                                                                                                                      14


                   the results violate the laws of a normal distribution (one which approximates a bell


                   curve). Instead, a qualitative analsysis was completed looking at trial variance in


                   order to determine the typical rate of decay, or a time point at which the connection


                   rate should aproximate zero.


                   3.2 Trial Variance Analysis


                        The consistency in the decay rate between trial, or Trial Variance (Myers & Well,


                   1995), was the focus of the second analysis. Ideally, the results of the test would be


                   similar as this would provide a basis for “normal” decay rates using P2P networks.


                   Graph 3 indicates the rate of decline in connection rate for all three trials and


                   provides a visual comparison.


                          Key
  fingerprint
  =
  AF19
  FA27
  2F94
  998D
  FDB5
  DE3D
  F8B5
  06E4
  A169
  4E46


                     Jerome Radcliffe;jay.radcliffe@gmail.com
       © 2010 The SANS Institute                           As part of the Information Security Reading Room                     Author retains full rights.
                                                                                                                                      15


                            Graph 3: Three BitTorrent Tests, Afterglow period


                          Key
  fingerprint
  =
  AF19
  FA27
  2F94
  998D
  FDB5
  DE3D
  F8B5
  06E4
  A169
  4E46


                     The above graph shows a significant drop‐off in the first two hours for all three

                     trials. There are a small amount of connection attempts for the following fourteen

                     hours.

                     Using this visual we set the cut off rate at approximately two hours.

                     Jerome Radcliffe;jay.radcliffe@gmail.com
       © 2010 The SANS Institute                           As part of the Information Security Reading Room                     Author retains full rights.
16
3.3 Analysis of postdisconnection sources
Finally, the IP address of each of the incoming connections made after the
determined period, in this case, the two hour mark, is of interest. This data, while
not directly related to the afterglow statistics, might be useful in determining a
pattern in the connections that are trying to be established after the P2P session is
terminated.
The top ten countries with post‐connection attempts are shown, by trial, in Tables
3.1 – 3.3.
Table 3.1 (BT1) Table 3.2 (BT2) Table 3.3 (BT3)
USA 26.77% USA 29.73% USA 20.36%
Brazil 24.80% China 7.68% Brazil 6.41%
Poland 7.87% France 4.87% Russia 5.81%
Thailand 7.87% Great Britain 4.55% Canada 5.23%
Russia 7.48% Netherlands 4.29% China 4.47%
Key
fingerprint
=
AF19
FA27
2F94
998D
FDB5
DE3D
F8B5
06E4
A169
4E46
Austria 5.91% Russia 3.84% United Kingdom 4.19%
Ukraine 5.91% Canada 3.75% Spain 3.76%
Germany 5.51% Sweden 3.66% Japan 3.56%
Taiwan 1.97% Poland 3.26% Taiwan 3.15%
Qatar 1.18% Japan 2.46% France 2.70%
After looking at the afterglow data, there were a couple trends that warranted
further investigation. In the second BitTorrent test, there were consistent bumps at
specific intervals in the post connection period. (See Graph 4)
Jerome Radcliffe;jay.radcliffe@gmail.com
© 2010 The SANS Institute As part of the Information Security Reading Room Author retains full rights.
                                                                                                                                      17


                   Graph 4 – BitTorrent test #2 – Afterglow


                          Key
  fingerprint
  =
  AF19
  FA27
  2F94
  998D
  FDB5
  DE3D
  F8B5
  06E4
  A169
  4E46


                     These data spikes are spaced at two hour intervals and are TCP SYN connections.

                     The log files show these spikes are coming from the same group of clients making

                     six connection attempts each. There were no commonalities in the group of

                     repeating clients (different countries, different ISPs, etc). This could be a specific

                     version or client program that has a unique retry mechanism or it could be a factor

                     that has not been considered yet. This pattern was also unique to this specific test,

                     and did not appear in either of the other two BitTorrent tests.

                     Jerome Radcliffe;jay.radcliffe@gmail.com
       © 2010 The SANS Institute                           As part of the Information Security Reading Room                     Author retains full rights.
                                                                                                                                    18


                   4. Discussion


                       This study found that the decay rates in BitTorrent P2P sessions are generally


                   quite consistent with regards to the overall pattern of connection attempts. When


                   looking at the afterglow periods of all three tests, there is a quick drop in connection


                   attempts, followed by a trickle of connection attempts over the course of fourteen


                   hours.


                   The post‐connection source information can be used to identify a trend indicating


                   who is trying to connect to a terminated P2P client. By looking for repetitive IP


                   addresses, IP address ranges, or Whois data based on the IP addresses, a pattern


                   might begin to emerge. In the future, this information could help distinguish


                   suspicious connections from harmless connections and could provide useful tools


                     for determining     “atypical”
                          Key
  fingerprint
           orFA27

                                                 =
  AF19
   “dangerous”   connection
                                                                   2F94
  998D
            attempts.
                                                                                   FDB5
  DE3D
  F8B5
  06E4
  A169
  4E46


                     4.1 Limitations of the study

                         There were some limitations to this study. First, there are many types of P2P

                     clients that could be used in the BitTorrent protocol, and these might interact

                     differently when compared with the one used in this study. Other client programs

                     might interact differently with other peers – impacting the data. Second, this study

                     only used a consistent file type in the P2P search, Fedora 9 Installation DVD.

                     Different files types might be more “risky” and produce a different result. For

                     example, files that are in violation of copyright could invoke more afterglow activity.

                     Third, the number of test runs and only looking at the 14 hours after the P2P session

                     was terminated could be seen as a limitation. More tests might provide a better

                     Jerome Radcliffe;jay.radcliffe@gmail.com
       © 2010 The SANS Institute                           As part of the Information Security Reading Room                   Author retains full rights.
                                                                                                                                     19


                   total picture of what the afterglow looks like. Additionally, assessing more than the


                   first 14 hours after the connection was terminated might also provide a clearer


                   picture of what absolute zero looks like. Finally, one inconsistency in the data is that


                   the third BitTorrent protocol was run on a different network. In between the


                   second and third trial the test network changed from Comcast to a small local ISP


                   named WestTel. The WestTel network connection had higher bandwidth which


                   might have accounted for the higher number of connections in the third trial.


                   Although the number of connections in the third trial was higher, the rate of decay


                   in the afterglow was consistent with the other two trials.


                   4.2 Future considerations


                       The current study was a good place to start in terms of looking at decay rate
                         Key
  fingerprint
  =
  AF19
  FA27
  2F94
  998D
  FDB5
  DE3D
  F8B5
  06E4
  A169
  4E46

                     analysis. There are, however, several prospective directions that could expand on

                     this line of research. One future direction might look at the protocol and program

                     associated with the P2P clients to see if there are inefficiencies in the way it keeps

                     track of active or participating clients. The statistical information could also lead to

                     more adaptive intrusion detection strategies which would use these types of

                     statistics to flag connections that are outside the bounds of normal traffic rather

                     than traffic that is expected.

                          A second area of possible future research would further expand on the anomaly

                     seen in the second test case where there were multiple repeat clients attempting

                     connections at consistent time intervals. Research could be done to identify further

                     details on these clients to determine a commonality between them.

                     Jerome Radcliffe;jay.radcliffe@gmail.com
       © 2010 The SANS Institute                           As part of the Information Security Reading Room                   Author retains full rights.
                                                                                                                                      20


                       Another direction would be to do further analysis on the connection attempts


                   being made in the afterglow period to try and identify additional markers that


                   would distinguish them as being suspicious. This could be parts of the TCP/UDP


                   packet structure and content.


                       Overall there is room to grow in the area of P2P connection research. This


                   limited study only looked at a small area of P2P interactions. There are an ever‐


                   growing number of BitTorrent clients and all of them handle the protocol


                   differently. These differences could greatly impact every area of P2P


                   communications, all of which are areas that could be grounds for research. Further


                   research of how P2P clients interact could provide additional ways to increase


                   efficiency and provide enhanced security.


                          Key
  fingerprint
  =
  AF19
  FA27
  2F94
  998D
  FDB5
  DE3D
  F8B5
  06E4
  A169
  4E46

                     5. References

                     Beale, J., Poor, M., & Foster, J. (2004). Snort 2.1 Intrusion Detection, Second Edition.
                     Syngress.

                     Cohen, B. (2008). The BitTorrent Protocol Specification. Retrieved 2010 26‐Feburary
                     from http://www.bittorrent.org/beps/bep_0003.html

                     Johnson, E., McGuire, D., & Willey, N. (2008). The Evolution of the Peer‐to‐Peer File
                     Sharing Industry and the Security Risks for Users. 41st Hawaii International
                     conference on System Sciences, (p. 1).

                     Myers, J., & Well, A. (1995). Research Design and Statistical Analysis. Routledge.

                     Spurgeon, C. (2000). Ethernet: The Definitive Guide . Sebastopol, CT: O'Reilly &
                     Associates.
                     Stevens, W. R. (1994). TCP/IP Illustrated, Volume 1: The Protocols. Addison‐Wesley
                     Professional.

                     Jerome Radcliffe;jay.radcliffe@gmail.com
       © 2010 The SANS Institute                           As part of the Information Security Reading Room                     Author retains full rights.
Last Updated: September 22nd, 2020

                    Upcoming SANS Training
                    Click here to view a list of all SANS Courses

SANS October Singapore 2020                                   Singapore, SG         Oct 12, 2020 - Oct 24, 2020   Live Event

SANS Community CTF                                            ,                     Oct 15, 2020 - Oct 16, 2020   Self Paced

SANS SEC504 Rennes 2020 (In French)                           Rennes, FR            Oct 19, 2020 - Oct 24, 2020   Live Event

SANS SEC560 Lille 2020 (In French)                            Lille, FR             Oct 26, 2020 - Oct 31, 2020   Live Event

SANS Tel Aviv November 2020                                   Tel Aviv, IL          Nov 01, 2020 - Nov 06, 2020   Live Event

SANS Sydney 2020                                              Sydney, AU            Nov 02, 2020 - Nov 14, 2020   Live Event

SANS Secure Thailand                                          Bangkok, TH           Nov 09, 2020 - Nov 14, 2020   Live Event

APAC ICS Summit & Training 2020                               Singapore, SG         Nov 13, 2020 - Nov 21, 2020   Live Event

SANS FOR508 Rome 2020 (in Italian)                            Rome, IT              Nov 16, 2020 - Nov 21, 2020   Live Event

SANS Community CTF                                            ,                     Nov 19, 2020 - Nov 20, 2020   Self Paced

SANS Local: Oslo November 2020                                Oslo, NO              Nov 23, 2020 - Nov 28, 2020   Live Event

SANS Wellington 2020                                          Wellington, NZ        Nov 30, 2020 - Dec 12, 2020   Live Event

SANS OnDemand                                                 OnlineUS                       Anytime              Self Paced

SANS SelfStudy                                                Books & MP3s OnlyUS            Anytime              Self Paced
You can also read