SARS-COV-2 TEST POSITIVITY RATE IN RENO, NEVADA: ASSOCIATION WITH PM2.5 DURING THE 2020 WILDFIRE SMOKE EVENTS IN THE WESTERN UNITED STATES - NATURE
←
→
Page content transcription
If your browser does not render page correctly, please read the page content below
Journal of Exposure Science & Environmental Epidemiology                                                                                           www.nature.com/jes

ARTICLE                 OPEN

SARS-CoV-2 test positivity rate in Reno, Nevada: association
with PM2.5 during the 2020 wildfire smoke events in the
western United States
               ✉
Daniel Kiser1,4 , Gai Elhanan1,4, William J. Metcalf1, Brendan Schnieder2 and Joseph J. Grzymski1,3

© The Author(s) 2021

    BACKGROUND: Air pollution has been linked to increased susceptibility to SARS-CoV-2. Thus, it has been suggested that wildfire
    smoke events may exacerbate the COVID-19 pandemic.
    OBJECTIVES: Our goal was to examine whether wildfire smoke from the 2020 wildfires in the western United States was associated
    with an increased rate of SARS-CoV-2 infections in Reno, Nevada.
    METHODS: We conducted a time-series analysis using generalized additive models to examine the relationship between the SARS-
    CoV-2 test positivity rate at a large regional hospital in Reno and ambient PM2.5 from 15 May to 20 Oct 2020.
    RESULTS: We found that a 10 µg/m3 increase in the 7-day average PM2.5 concentration was associated with a 6.3% relative increase
    in the SARS-CoV-2 test positivity rate, with a 95% confidence interval (CI) of 2.5 to 10.3%. This corresponded to an estimated 17.7%
    (CI: 14.4–20.1%) increase in the number of cases during the time period most affected by wildfire smoke, from 16 Aug to 10 Oct.
    SIGNIFICANCE: Wildfire smoke may have greatly increased the number of COVID-19 cases in Reno. Thus, our results substantiate the
    role of air pollution in exacerbating the pandemic and can help guide the development of public preparedness policies in areas
    affected by wildfire smoke, as wildfires are likely to coincide with the COVID-19 pandemic in 2021.
    Journal of Exposure Science & Environmental Epidemiology; https://doi.org/10.1038/s41370-021-00366-w

INTRODUCTION                                                                             County, in Northern Nevada (NV), was heavily exposed to smoke
During the second half of the summer of 2020, two crises                                 from the 2020 wildfires, while simultaneously experiencing
converged on residents of the western United States: the second                          increasing numbers of COVID-19 cases. See Table S1 for a list of
wave of the COVID-19 pandemic and widespread wildfires. As a                              major wildfires that affected air quality in Washoe County during
result of the wildfires, many residents had prolonged exposure to                         our study period, and see Fig. 1A for a corresponding map. The
smoke containing elevated levels of particulate matter 2.5 µm in                         county has a population of 480,000, with at least 75% of residents
diameter or smaller (PM2.5). It has been suggested that even a                           living in the Reno-Sparks metropolitan area (Reno). Reno’s location
moderate magnitude wildfire smoke event may increase the                                  in an intermountain valley restricts the dispersion of pollutants
impact (incidence or mortality) of COVID-19 by ~10% (ref. [1]), but                      (ref. [16]), possibly increasing the magnitude of exposure. The
this has not yet been adequately verified.                                                largest healthcare system in Washoe County is Renown Health
   Air pollution is detrimental to health in general and to                              (Renown), whose laboratory-confirmed about 25% of the county’s
respiratory health in particular (ref. [2, 3]). While air pollution is                   COVID-19 cases.
composed of various gases and particles of different sizes, PM2.5                           Our objective was to determine whether wildfire PM2.5 is
is likely the chief mediator of its ill effects (ref. [4, 5]). PM2.5                     associated with an increased rate of SARS-CoV-2 infections. Thus,
increases susceptibility to respiratory viruses via modified immune                       we examined the association between positive COVID-19 cases at
responses, including systemic and airway inflammation (ref. [6, 7]).                      Renown and ambient concentrations of PM2.5 in Reno, NV during
Moreover, it has been shown that small particulates can enhance                          a time period that included a severe, prolonged smoke event
the spread and survival of bacterial, fungal, and viral bioaerosols                      caused by the 2020 wildfires.
(ref. [8, 9]), including bioaerosols containing SARS-CoV-2 (ref. [10]).
An association between particulate matter (PM) and daily
mortality from SARS-CoV-1 was reported in 2005 (ref. [11]). Copat                        METHODS
et al. provide a systematic review of the role of air pollution and its                  Data
effect on the spread and lethality of COVID-19 (ref. [12]).                              Preliminary PM2.5 concentrations were obtained via the Environmental
   PM2.5 specifically from wildfires has been shown to be                                  Protection Agency’s (EPA’s) internet database (www.epa.gov/airdata) from
detrimental to respiratory health as well (ref. [13–15]). Washoe                         four air quality monitors located in Reno and Sparks (see Fig. 1B for exact

1
 Center for Genomic Medicine, Desert Research Institute, Reno, NV, USA. 2Washoe County Health District Air Quality Management Division, Reno, NV, USA. 3Renown Health, Reno,
NV, USA. 4These authors contributed equally: Daniel Kiser, Gai Elhanan. ✉email: daniel.kiser@dri.edu

Received: 5 January 2021 Revised: 28 June 2021 Accepted: 29 June 2021
D. Kiser et al.
2
A 0 100 200km
B 0 5 10km
Sparks
Reno
Reno
acres burned
10k
100k
San Francisco air quality monitor
1m KRNO weather station
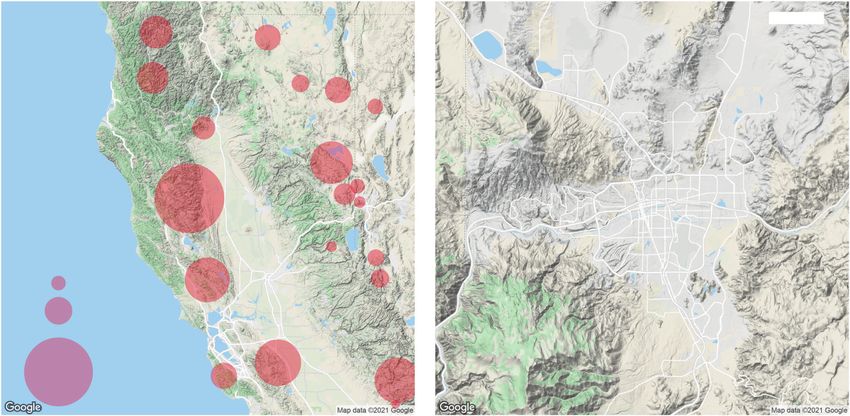
Fig. 1 Maps of wildfire and air quality monitor locations. A Map of major wildfires occurring in the region during our study period, 15 May
to 20 Oct 2020, that likely impacted air quality in Reno, Nevada. The size of the points indicates the number of acres burned in each
1234567890();,:
wildfire. Additional information on wildfire names, locations, start and end dates, and size measured in acres can be found in Table S1.
B Map of air quality monitors in Reno. The location of the KRNO weather station is also shown. API calls for Google Maps provided in
refs. [38, 39].
locations). These federal equivalent method (FEM) PM2.5 monitors were Modeling
hourly Beta Attenuation Monitors (Met One BAM 1020s) with a very sharp We used a generalized additive model from the Negative Binomial
cut cyclone (VSCC). To estimate the daily exposure of the population to distribution, rather than from the Poisson distribution, to account for any
PM2.5, we used a weighted average of the daily concentrations reported over-dispersion present in the counts of positive COVID-19 cases. Our base
by each monitor, with the weights proportional to the count of Renown model specification was:
patients living within five kilometers of each monitor. If measurements of
logðYi Þ ¼ β0 þ β1 tempi þ β2 Yi1 þ δDOWi þ sðtimei Þ þ logðtotali Þ þ ϵi
PM2.5 were missing at a particular monitor, we used a weighted average of
the remaining monitors. PM2.5 concentrations were missing for all
where Yi is the count of positive COVID-19 cases on the day i, tempi are the
monitors on 29 Sep 2020 due to a change in AirNow’s file transfer
7-day average of mean temperature, Yi–1 is the count of positive cases on
protocol (FTP) address that occurred that afternoon, causing data not to be
the previous day, DOWi is an indicator for the day of the week, s(timei) is a
reported. We obtained the missing values directly from the Washoe County
cubic regression spline of time (measured in the number of days since the
air quality management division. Six negative values for PM2.5 concentra-
start of the study period), and totali is the total number of tests administered.
tion were replaced with a value of zero before obtaining the weighted
β and δ indicate coefficients to be estimated, with δ indicating the
average.
coefficient specific to a particular day of the week. ∈i is the random error. In
Temperature and humidity data were obtained from the KRNO weather
this paper, we define the 7-day average for day i as the mean of the variable
station (via mesowest.utah.edu), which is located near the Reno airport
value on days i through i–6. Similarly, we define the 3-day average for day i
(Fig. 1B), and records data every five minutes. These values were averaged
as the mean of the variable value on days i through i–2.
by date in order to obtain daily means. However, some 5 minute
Because we used the total number of tests administered as an offset, we
measurements were missing. These missing values were ignored unless
essentially modeled the positivity rate, rather than counts of positive cases.
they represented more than 25% of the values for a given day. This
The positivity rate has the advantage of being less dependent on the
occurred on only 1 day, 9 Aug 2020. For this day, mean temperature and
number of SARS-CoV-2 NAA tests administered than the number of
mean humidity was estimated as the average of the daily means from the
positive cases, though it is not completely independent, as changes in the
day prior and the day after.
number of tests administered may result in changes in the population
SARS-CoV-2 nucleic acid amplification (NAA) test results and patient
being tested.
demographic data were obtained from Renown. During the study period,
We adjusted for the temperature to account for any seasonal changes in
no significant shortages of SARS-CoV-2 tests were observed and testing
the SARS-CoV-2 infection rate. The 7-day average of mean temperature
indications followed published CDC and Washoe County Health District
was used instead of the daily mean temperature to account for a probable
clinical guidelines. For our analysis, we included all available types of SARS-
delay between changes in temperature and changes in the infection rate.
CoV-2 NAA tests except one. We excluded this test because it was used
The smooth of time was necessary to control for confounding factors
only briefly during our study period, it was administered in very large
that contribute to changes in the positivity rate, but for which no
numbers during that brief period, it had a very low positivity rate, and it
reasonable data source exists. These confounding factors include the
was rarely utilized during the period most heavily affected by wildfire
prevalence of the virus in the community at any given time, changes in
smoke (16 Aug to 10 Oct 2020). For calculating the daily count of positive
human behavior, and changes in which patients are being tested. While
SARS-CoV-2 NAA test results, we included only a patient’s initial positive
some information exists on pertinent events that may affect human
test. For calculating the daily total of tests administered, we included the
behavior (such as the Phase 2 reopening of Nevada or the start of school,
first positive test for patients who tested positive and only one negative
indicated in Fig. 2), it is uncertain how to specifically model these events.
test per patient per day of patients who never tested positive from the
Using a smooth function of time as a predictor allowed us to model the
start of the pandemic (2 Mar 2020) to the end of our available data (21
general course of the pandemic, while still examining whether PM2.5
Oct 2020).
explained particular features of the data.
We selected 15 May 2020 as the beginning of our study period, as that
The autoregressive term Yi–1 was added as a predictor because
appears to be when the number of tests administered stabilized, and our
autocorrelation function (ACF) and partial autocorrelation function (PACF)
study period ended on 20 Oct 2020.
Journal of Exposure Science & Environmental EpidemiologyD. Kiser et al.
3
Fig. 2 SARS-CoV-2 tests, PM2.5, and temperature over time. Top panel: SARS-CoV-2 test positivity rate from 15 May 2020 to 20 Oct
2020. Expected positivity rates were estimated by the model which included the 7-day average of daily mean PM2.5 as a predictor. The black
line indicates the 7-day moving average of the positivity rate (each day averaged with the 3 days prior and the 3 days following). The blue line
indicates the expected positivity rate if the concentration of 7-day average PM2.5 during the period 16 Aug 2020 to 10 Oct 2020 had remained
at the average level of the same period in 2019 (4.5 µg/m3). The red-shaded region indicates the expected positivity rate based on the actual
PM2.5, which is indicated by the red line. For this figure, weekday effects were removed from the model estimates for clarity. Middle panel:
Daily number of patients with SARS-CoV-2 NAA tests at Renown is indicated by the thin line, while the 7-day average is indicated by the bold
line. Bottom panel: daily mean temperature (°C) is indicated by the thin line, while the 7-day average is indicated by the bold line.
plots revealed significant autocorrelation at lag 1 of the residuals. This was 2020. This model was chosen because the lags were selected a priori and it
confirmed by the Durbin–Watson test (p = 6.3e−14). After adding this was more parsimonious than the distributed lag models. Below is a
term, the ACF plot, PACF plot, and Durbin–Watson test (p = 0.78) indicated description of how we estimated excess cases and found a confidence
that the autocorrelation had been removed. interval for that estimate.
However, we noticed that when PM2.5 terms were added to the model, For our model, the fitted value for a day i is:
we tended to see negative autocorrelation in the residuals at various lags. ^ þβ^ tempi þ β
^ Yi1 þ δDOW
^ ^ PM2:5i
We concluded that the smooth of time was somewhat overfitting. The zi ¼ β 0 1 2 i þ^
sðtimei Þ þ β3
software we used automatically determines the degrees of freedom for the
smooth term based on restricted maximum likelihood, with an upper limit where zi is the fitted value on the link scale for day i, PM2.5i is the 7-day
selected by the user. The default maximum value for degrees of freedom is average of PM2.5, and the other variables are defined the same as they
nine. When we lowered this value to four, the negative autocorrelation were previously. Each zi is necessarily a normally distributed variable, given
disappeared. Thus, we used four as the degrees of freedom for the smooth that the model diagnostics indicate normally distributed residuals (Fig. S1).
of time. We assumed that if there had not been a wildfire smoke event from 16
We initially investigated the relationship between the positivity rate and Aug to 10 Oct 2020, the 7-day average of PM2.5 would have remained at
PM2.5 using lags 0, 7, and 14 of both daily mean PM2.5 and the 7-day the average level of the same period in 2019, when no major wildfire
average of daily mean PM2.5. To further refine our understanding of the smoke events occurred. We generated fitted values for each day from 16
chronological relationship between PM2.5 and positive SARS-CoV-2 tests, Aug to 10 Oct 2020, based on the altered data. We then calculated excess
we subsequently tested the association of the remaining lags of daily cases as follows:
mean PM2.5 between 0 and 14, as well as lags 0, 3, 6, 9, and 12 of the 3-day X
n
averages of daily mean PM2.5. W¼ Yi ðexpðzi Þ ´ totali Þ
We then used the method described by Schwartz to fit distributed lag i¼1
models (DLMs), which constrain the lag effects to follow a polynomial
where W is the expected number of excess cases for the entire time
function (ref. [17]). We concluded based on the single-day and three-day
period, and Yi is the actual number of cases on day i. Day 1 is the first
average models that the lag effects were likely to follow a quadratic or
day of the time period of interest (in our case, 16 Aug 2020) and day n
cubic function. Modifying the number of lags included in the DLM can
is the last day (10 Oct 2020). zi was exponentiated and multiplied by
have a sizable influence on the estimates for each lag, and it is not
the offset (totali) in order to transform it to the same scale as the
necessarily clear how many lags should be included. Based on the results
response (Yi).
of previous models, we assumed that a reasonable quadratic or cubic
Because of the exponentiation of zi, finding the variance (and hence a
function for the lags would include (1) significant positive associations at
confidence interval) for W is not straightforward. We thus adopted a
some lags, (2) no large negative associations at large lags, and (3) a near-
resampling approach that uses the distribution of the individual zi:
zero effect at the largest lag.
1. For each day i, we selected a random value from the distribution of
Calculating excess cases zi, assuming normality and using the standard errors for each zi
We used the model which included the 7-day average of PM2.5 as a reported by the software. PWe denote this value
as zi .
predictor to estimate how many fewer COVID-19 cases were likely to have 2. We then calculated: W ¼ ni¼1 Yi exp zi ´ totali , where W* is a
occurred if there had been no wildfire smoke between 16 Aug and 10 Oct new estimate of excess cases.
Journal of Exposure Science & Environmental EpidemiologyD. Kiser et al.
4
Steps 1 and 2 were repeated 10,000 times, and the 2.5th and 97.5th day PM2.5, as well as lags 0 and 3 of 3-day average PM2.5 (Fig. 3).
percentiles of the empirical distribution of the W*’s were assigned as the
Additional negative associations were found for lag 13 of the
lower and upper confidence interval limits of W.
single-day PM2.5 and for lag 12 of the 3-day average PM2.5.
Based on the results of the single-day and the 3-day average
Additional methods models, we determined that intermediate-length lags had the
To test the robustness of our results, we made several modifications to the largest association with the positivity rate. Using the criteria
base model and evaluated their separate effects on the results. We (1) described previously, we selected lags 0–8 for the quadratic DLM
increased the maximum degrees of freedom for the smooth of time from
four degrees of freedom to nine degrees of freedom, (2) added the 7-day and lags 0–12 for the cubic DLM. These models indicated that lags
average of relative humidity as a predictor, and (3) replaced the 7-day 2–6 have a significant positive association with the positivity rate,
average of temperature with a 3-day average of temperature. with a 10 µg/m3 increase in PM2.5 being associated with an ~1%
We used R version 3.6.0 and the R packages mgcv 1.8–28 (ref. [18]) and relative increase in the positivity rate on any given lag (Fig. 4).
mgcv.helper 0.1.8 (ref. [19]) for all of our statistical modeling. ggmap 3.0.0 Based on the model using 7-day average PM2.5 as a predictor,
was used to generate maps (ref. [20]). Work on this study was Institutional exposure to wildfire PM2.5 accounted for an additional 178 (CI:
Review Board exempt by the University of Nevada, Reno Institutional
Review Board (#1106618-25) as part of a larger body of work “Interoper-
ability, operational efficiency and quality of care improvements through
health data analysis.” The funders had no role in study design, data
analysis, decision to publish, or preparation of the manuscript. Table 1. Demographics of the patient population tested for SARS-
CoV-2 at renown from 15 May to 20 Oct 2020.
Patients tested Percent
RESULTS Positive
a b
During the study period (159 days), 35,955 individuals were tested Total Negative Positive
at Renown for SARS-CoV-2, of which 2881 (8.0%) tested positive Patients, 35955 (100) 33074 (100) 2881 (100) 8.0%
(Table 1). 72% of patients were 30 years of age or older, but the N (%)
rate of patients testing positive was highest among patients aged Male 15798 (44) 14432 (44) 1366 (47) 8.6%
18–29, with a positivity rate of 11.3%. The number of NAA tests gender,
administered at Renown increased steadily during our study N (%)
period, from an average of 130 patients tested per day in the
Agec, 45.4 (23.0) 45.6 (23.2) 42.3 (20.4) NA
second half of May to 404 patients tested per day in the first half mean (SD)
of October (Fig. 2).
Air quality was affected by wildfire smoke for 59 days during our Agec category, N (%)
study period, with 50 of those days occurring between 16 Aug andD. Kiser et al.
5
Fig. 4 The relative percent change in the SARS-CoV-2 positivity rate associated with an increase of 10 μg/m3 in daily mean PM2.5 at each
lag, where separate lag effects are considered within the same model and the effects are constrained to follow a quadratic function over
lags 0–8 (left panel) and a cubic function over lags 0–12 (right panel). Error bars indicate 95% confidence intervals, which were not
corrected for multiple testing.
149–98) positive COVID-19 cases at Renown alone between 16 virus. Elevated concentrations of ambient nitrogen dioxide
Aug and 10 Oct 2020, or an increase of 17.7% (CI: 14.4–20.1%). (NO2) and PM2.5 result in over-expression of the ACE2 receptor
Fig. 2 compares the expected positivity rate in the presence and in respiratory epithelial cells, possibly increasing the pathogeni-
absence of wildfire smoke during that time period. city of the virus (ref. [32]). It is unclear whether this mechanism
The results of the models in our main analysis are shown in requires long- or short-term exposure to air pollution, or
tabular form in Table S2, while the results of the models in our whether in vivo effects might differ from in vitro effects (ref.
sensitivity analyses are shown in Tables S3–S5, for comparison. A [33]). However, in vitro studies suggest that relatively short
comparison of excess cases estimated in each analysis can be exposure to PM2.5 may induce cellular changes and inflamma-
viewed in Table S6. None of the results of the sensitivity analyses tion (ref. [33, 34]).
meaningfully differed from the results of the main analysis. Our data did not support a same-day association between the
SARS-CoV-2 test positivity rate and PM2.5, and further investiga-
tion revealed that the positivity rate was most strongly associated
DISCUSSION with PM2.5 concentrations two to 6 days prior. Thus, our results
We found a large increase in the SARS-CoV-2 test positivity rate at are consistent with a relatively short-term, cumulative effect of
Renown during periods of elevated PM2.5 from wildfires. These wildfire PM2.5 exposure on the incidence of COVID-19, possibly
results, although based on observational data with their inherent mediated by cellular changes and increased infectivity due to PM
limitations, lend credence to earlier predictions that wildfire particles acting as vectors of spread. Other non-biological factors
smoke would exacerbate the COVID-19 pandemic (ref. [1, 21]). Our may also play a role: use of air quality monitoring applications is
findings also bolster arguments that PM2.5 from other sources, pervasive and encourages people to stay indoors during bad air
such as vehicle traffic or industry, increases susceptibility to SARS- events, which could enhance the spread of SARS-CoV-2 in indoor
CoV-2. An association of elevated levels of air pollution with public places like restaurants and schools. Conversely, they could
increased infectivity and severity of COVID-19 cases was found in also limit the spread of SARS-CoV-2 if public places are mandated
populated areas in Italy (ref. [22, 23]), the United States (ref. to be closed and people are forced to take shelter from the smoke
[24, 25]), England (ref. [26]), China (ref. [27]), and other nations (ref. in their own homes. Thus, it is possible that the influence of
[23, 28]), but not in Spain (ref. [23, 29]). wildfire smoke on the spread of SARS-CoV-2 depends strongly on
A previous study by Meo et al. examining the relationship human behavior and public policy decisions, like the decision to
between PM2.5 and daily new COVID-19 cases in San Francisco, resume in-person classes. The Washoe County School District
California during the 2020 wildfires found an association of similar implemented a hybrid system of in-person and virtual classes for
direction and magnitude as some of the effects observed in our middle schoolers and high schoolers (students aged 11–18 years),
study—a 5.1% increase in daily cases per 10 µg/m3 increase in where students attended in-person classes every other day, while
PM2.5 (ref. [30]). Another study by Leifer et al. observed increased elementary schoolers (students aged 5–11 years) continued
numbers of COVID-19 cases following wildfire smoke events in attending in-person classes every day. However, it is not likely
Orange County, California (ref. [31]). However, our study sig- that the reopening of school is an important confounder in our
nificantly improved on these studies by controlling for additional study since the increases in the positivity rate attributed to PM2.5
covariates: the general prevalence of the virus, which increased were temporary surges, rather than a sustained increase as might
over time (not included in Meo et al.); and temperature and the be expected when students and teachers are perpetually in
number of tests administered (not included in Meo et al. or Leifer contact.
et al.). Thus, we believe that our study greatly strengthens the Although this study only evaluated positivity rates, it is
evidence that wildfire smoke can enhance the spread of SARS- reasonable to assume that the excess cases due to wildfire
CoV-2. PM2.5 resulted in excess mortality. Wildfire smoke has previously
In addition to the mechanisms mentioned previously, where been associated with increased all-cause mortality (ref. [35, 36]),
PM2.5 enhances the pathogenicity of viruses by modifying and an association between this season’s smoke episode and
immune responses and facilitating the transport of the virus into mortality was observed in Washington state (ref. [37]). However, it
the lungs, a third possible mechanism specific to SARS-CoV-2 is beyond the scope of this study to evaluate the number of
may involve the ACE2 receptor, the molecular target for the COVID-19 deaths attributable to PM2.5.
Journal of Exposure Science & Environmental EpidemiologyD. Kiser et al.
6
This study also limited itself to examining exposure to PM2.5, inflammation, and chemokine expression. Toxicol Sci. 2003;72:339–46. https://
even though wildfire smoke consists of many other potentially doi.org/10.1093/toxsci/kfg032.
harmful compounds, such as coarse PM, carbon monoxide, volatile 7. Mehmood K, Saifullah, Iqbal M, Abrar MM. Can exposure to PM2.5 particles
organic compounds, ozone, and nitrogen oxides. It is possible that increase the incidence of coronavirus disease 2019 (COVID-19). Sci Total Environ.
2020;741:140441 https://doi.org/10.1016/j.scitotenv.2020.140441.
some of the associations we observed between PM2.5 and the
8. Cao C, Jiang W, Wang B, Fang J, Lang J, Tian G, et al. Inhalable microorganisms in
SARS-CoV-2 test positivity rate could be attributed to these other Beijing’s PM2. 5 and PM10 pollutants during a severe smog event. Environ Sci
compounds. Although such confounding would be largely Technol. 2014;48:1499–507. https://doi.org/10.1021/es4048472.
irrelevant from a public policy standpoint, it may have implica- 9. Smets W, Moretti S, Denys S, Lebeer S. Airborne bacteria in the atmosphere:
tions for understanding the mechanism behind the increased rate presence, purpose, and potential. Atmos Environ. 2016;139:214–21.
of infections. 10. Setti L, Passarini F, De Gennaro G, Barbieri P, Perrone MG, Borelli M, et al. SARS-Cov-
In addition, our study has important limitations with regard to 2RNA found on particulate matter of Bergamo in Northern Italy: first evidence.
our ability to quantify exposure to PM2.5. While four air quality Environ Res. 2020;188:109754 https://doi.org/10.1016/j.envres.2020.109754.
monitors are quite sufficient for estimating outdoor air quality, we 11. Kan HD, Chen BH, Fu CW, Yu SZ, Mu LN. Relationship between ambient air
pollution and daily mortality of SARS in Beijing. Biomed Environ Sci. 2005;18:1–4.
were unable to account for variations in individual exposure that
PMID: 15861770
may be due to occupation, recreation, or income. Thus, using our 12. Copat C, Cristaldi A, Fiore M, Grasso A, Zuccarello P, Signorelli SS, et al. The role of
method of estimating exposure could result in different estimates air pollution (PM and NO2) in COVID-19 spread and lethality: a systematic review.
of the effect between our study population and other populations Environ Res. 2020;191:110129 https://doi.org/10.1016/j.envres.2020.110129.
who have different occupations, recreational habits, or social 13. Balmes JR. Where there’s wildfire, there’s smoke. N Engl J Med. 2018;378:881–3.
statuses. https://doi.org/10.1056/NEJMp1716846.
Reno likely presents a better opportunity to study the 14. Kiser D, Metcalf WJ, Elhanan G, Schnieder B, Schlauch K, Joros A, et al. Particulate
association of wildfire smoke with COVID-19 incidence than some matter and emergency visits for asthma: a time-series study of their association in
of the localities that were directly threatened by wildfires, since the presence and absence of wildfire smoke in Reno, Nevada, 2013-8. Environ
Health 2020;19:92 https://doi.org/10.1186/s12940-020-00646-2. Published 2020
Reno was not subject to evacuations that would have prevented
Aug 27
exposure to smoke. Reno was also exposed to higher concentra- 15. Reisen F, Duran SM, Flannigan M, Elliott CT. Wildfire smoke and public health risk.
tions of PM2.5 for longer periods of time than other nearby Int J Wildland Fire. 2015;24:1029–44.
metropolitan areas. According to the EPA, Reno experienced 16. Chen L, Omaye ST. Air pollution and health effects in northern Nevada. Rev
43 days of elevated PM2.5 (above 12 µg/m3) since 1 Aug 2020, Environ Health. 2001;16:133–49. https://doi.org/10.1515/reveh.2001.16.2.133.
while the San Francisco Bay Area in California experienced only 17. Schwartz J. The distributed lag between air pollution and daily deaths. Epide-
26 days of elevated PM2.5. miology. 2000;11:320–6. https://doi.org/10.1097/00001648-200005000-00016.
Current recommendations from the centers for disease control 18. Wood S. Generalized additive models: an introduction with R. 2nd ed. Boca
and prevention (CDC) with regards to wildfire smoke during the Raton: Chapman & Hall/CRC; 2017.
19. Clifford S. mgcv.helper: Helper Functions for mgcv. R package version 0.1.8; 2019.
pandemic recognize the possibility that wildfire smoke may
20. Kahle D. and Wickham H. ggmap: spatial visualization with ggplot2. The R
exacerbate the risk of SARS-CoV-2 infection. However, the EPA Journal, 5, 144–61. http://journal.r-project.org/archive/2013-1/kahle-wickham.pdf.
does not currently provide specific recommendations for wildfire 21. Santana F. N., Fischer S. L., Jaeger M. O., Gabrielle W. P. Responding to simulta-
smoke protection during the pandemic. Overall, the recommen- neous crises: communications and social norms of mask behavior during wildfires
dations are to stay inside, use air cleaners, and wear N95 (or P100) and COVID-19. Environ Res Lett, 2020. https://doi.org/10.1088/1748-9326/abba55.
respirators. Some of these recommendations may not be helpful 22. Conticini E, Frediani B, Caro D. Can atmospheric pollution be considered a co-
during a pandemic that requires social distancing and limits the factor in extremely high level of SARS-CoV-2 lethality in Northern Italy? Environ
availability of personal protective equipment (ref. [21]). Pollut. 2020;261:114465 https://doi.org/10.1016/j.envpol.2020.114465.
Even with the possibility of COVID-19 vaccines becoming widely 23. Pansini R., Fornacca D. Higher virulence of COVID-19 in the air-polluted regions of
eight severely affected countries. medRxiv, 2020.04.30.20086496; https://doi.org/
available during the first half of 2021, this year’s wildfire season
10.1101/2020.04.30.20086496.
may co-occur with an ongoing pandemic. Thus, our findings 24. Liang D., Shi L., Zhao J., Liu P., Sarnat J. A., Gao S., et al. Urban air pollution may
should help shape regional policies that seek to manage the enhance COVID-19 case-fatality and mortality rates in the United States. Inno-
combined threats of wildfires and the pandemic. These policies vation. 2020;100047. https://doi.org/10.1016/j.xinn.2020.100047.
might include lowering the recommended healthy limit for PM2.5 25. Wu X, Nethery RC, Sabath MB, Braun D, Dominici F. Air pollution and COVID-19
in cities with a high prevalence of SARS-CoV-2, establishing “clean mortality in the United States: Strengths and limitations of an ecological
air” shelters that maintain social distancing, and allocating regression analysis. Sci Adv. 2020;6:eabd4049 https://doi.org/10.1126/sciadv.
sufficient quantities of appropriate respirators to areas at high abd4049.
risk for wildfires. 26. Travaglio M, Yu Y, Popovic R, Selley L, Leal NS, Martins LM. Links between air
pollution and COVID-19 in England. Environ Pollut. 2020;268:115859 https://doi.
org/10.1016/j.envpol.2020.115859.
REFERENCES 27. Li H, Xu XL, Dai DW, Huang ZY, Ma Z, Guan YJ. Air pollution and temperature are
1. Henderson SB. The COVID-19 pandemic and wildfire smoke: potentially con- associated with increased COVID-19 incidence: a time series study. Int J Infect Dis.
comitant disasters. Am J Public Health. 2020;110:1140–2. https://doi.org/10.2105/ 2020;97:278–82. https://doi.org/10.1016/j.ijid.2020.05.076.
AJPH.2020.305744. 28. Bhaskar A., Chandra J., Braun D., Cellini J., Dominici F. Air pollution, SARS-CoV-2
2. Di Q, Wang Yan, Zanobetti A, Wang Yun, Koutrakis P, Choirat C, et al. Air pollution transmission, and COVID-19 outcomes: a state-of-the-science review of a rapidly
and mortality in the Medicare population. N Engl J Med. 2017;376:2513–22. evolving research area. medRxiv. 2020.08.16.20175901; https://doi.org/10.1101/
https://doi.org/10.1056/NEJMoa1702747. 2020.08.16.20175901.
3. Krewski D. Evaluating the effects of ambient air pollution on life expectancy. N 29. Briz-Redón Á, Belenguer-Sapiña C, Serrano-Aroca Á. Changes in air pollution
Engl J Med. 2009;360:413–5. https://doi.org/10.1056/NEJMe0809178. during COVID-19 lockdown in Spain: a multi-city study. J Environ Sci.
4. Cipolla M, Sorgenti M, Gentile C, Bishara MM. Air pollution and lung diseases. In: 2021;101:16–26. https://doi.org/10.1016/j.jes.2020.07.029.
Gaddi A, Capello F, editors. Clinical handbook of air pollution-related diseases. 30. Meo SA, Abukhalaf AA, Alomar AA, Alessa OM. Wildfire and COVID-19 pandemic:
Cham: Springer; 2018:327–39. https://doi.org/10.1007/978-3-319-62731-1_18. effect of environmental pollution PM-2.5 and carbon monoxide on the dynamics
5. Zhang Y, Ding Z, Xiang Q, Wang W, Huang L, Mao F. Short-term effects of of daily cases and deaths due to SARS-COV-2 infection in San-Francisco USA. Eur
ambient PM1 and PM2.5 air pollution on hospital admission for respiratory dis- Rev Med Pharm Sci. 2020;24:10286–92. https://doi.org/10.26355/
eases: case-crossover evidence from Shenzhen, China. Int J Hyg Environ Health. eurrev_202010_23253.
2020;224:113418 https://doi.org/10.1016/j.ijheh.2019.11.001. 31. Leifer I, Kleinman MT, Blake D, Tratt D, Marston C. Wildfire smoke exposure:
6. Lambert AL, Mangum JB, DeLorme MP, Everitt JI. Ultrafine carbon black particles Covid19 comorbidity? J Respiration. 2021;1:74–79. https://doi.org/10.3390/
enhance respiratory syncytial virus-induced airway reactivity, pulmonary jor1010007.
Journal of Exposure Science & Environmental EpidemiologyD. Kiser et al.
7
32. Paital B., Agrawal P. K. Air pollution by NO2 and PM2.5 explains COVID-19 FUNDING
infection severity by overexpression of angiotensin-converting enzyme 2 Funding for this study came from Renown Health and from the Nevada Governor’s
in respiratory cells: a review (published online ahead of print, 2020 Office of Economic Development Coronavirus Relief Fund.
Sep 18). Environ Chem Lett. 2020;1–18. https://doi.org/10.1007/s10311-020-
01091-w.
33. Woodby B., Arnold M. M., Valacchi G. SARS-CoV-2 infection, COVID-19 patho- CONFLICT OF INTEREST
genesis, and exposure to air pollution: What is the connection? Ann N Y Acad Sci. The authors declare no competing interests.
2020. https://doi.org/10.1111/nyas.14512.
34. Niu BY, Li WK, Li JS, Hong QH, Khodahemmati S, Gao JF, et al. Effects of DNA
damage and oxidative stress in human bronchial epithelial cells exposed to
ADDITIONAL INFORMATION
PM2.5 from Beijing, China, in winter. Int J Environ Res Public Health. 2020;17:4874
https://doi.org/10.3390/ijerph17134874. Published 2020 Jul 6 Supplementary information The online version contains supplementary material
35. Liu JC, Pereira G, Uhl SA, Bravo MA, Bell ML. A systematic review of the physical available at https://doi.org/10.1038/s41370-021-00366-w.
health impacts from non-occupational exposure to wildfire smoke. Environ Res.
2015;136:120–32. Correspondence and requests for materials should be addressed to D.K.
36. Reid CE, Brauer M, Johnston FH, Jerrett M, Balmes JR, Elliott CT. Critical review of
health impacts of wildfire smoke exposure. Environ Health Perspect. Reprints and permission information is available at http://www.nature.com/
2016;124:1334–43. reprints
37. Liu Y, Austin E, Xiang J, Gould T, Larson T, Seto E. Health impact assessment
of PM2.5 attributable mortality from the September 2020 Washington State Publisher’s note Springer Nature remains neutral with regard to jurisdictional claims
Wildfire Smoke Episode. medRxiv. 2020. https://doi.org/10.1101/ in published maps and institutional affiliations.
2020.09.19.20197921.
38. Google Maps. Reno, Nevada. Map. Google, April 2021, https://maps.googleapis.
com/maps/api/staticmap?center=reno,%20nevada&zoom=11&size=646x
640&scale=2&maptype=terrain&style=feature:administrative%7Celement:labels
%7Cvisibility:off&style=feature:road%7Celement:labels.icon%7Cvisibility: Open Access This article is licensed under a Creative Commons
off&style=feature:poi%7Cvisibility:oof&key=xxx. Accessed 5 Apr 2021. Attribution 4.0 International License, which permits use, sharing,
39. Google Maps. Longitude-122.5 and Latitude 39.5. Map. Google, April 2021, adaptation, distribution and reproduction in any medium or format, as long as you give
https://maps.googleapis.com/maps/api/staticmap?center=39.5,-122.5&zoom= appropriate credit to the original author(s) and the source, provide a link to the Creative
7&size=640x640&scale=2&maptype=terrain&style=feature:administrative% Commons license, and indicate if changes were made. The images or other third party
7Celement:labels%7Cvisibility:off&style=feature:road%7Celement:labels.icon% material in this article are included in the article’s Creative Commons license, unless
7Cvisibility:off&style=feature:poi%7Cvisibility:off&key=xxx. Accessed 5 Apr 2021. indicated otherwise in a credit line to the material. If material is not included in the
article’s Creative Commons license and your intended use is not permitted by statutory
regulation or exceeds the permitted use, you will need to obtain permission directly
from the copyright holder. To view a copy of this license, visit http://creativecommons.
org/licenses/by/4.0/.
ACKNOWLEDGEMENTS
The authors would like to thank Renown Health for supporting the Center for
Genomic Medicine at the Desert Research Institute. © The Author(s) 2021
Journal of Exposure Science & Environmental EpidemiologyYou can also read