Schrodinger's Market, Cognitive Dissonance, and Hyperinflation
←
→
Page content transcription
If your browser does not render page correctly, please read the page content below
January 22, 2021

Schrodinger’s Market, Cognitive Dissonance, and
Hyperinflation
“There's no use trying," Alice said; "One can't believe impossible things." "I daresay you haven't had
much practice," said the Queen. "When I was younger, I always did it for half an hour a day. Why,
sometimes I've believed as many as six impossible things before breakfast.”
– Alice's Adventures in Wonderland, Lewis Carroll

________________________________________________________________________________________________________
                                             _____________

Introduction

The word palindrome, which comes from the Greek words "palin," meaning "again or back" and
"dromos," meaning "running," is a fancy way to talk about a series of letters or numbers that read the
same backward as forward. A palindrome can be a single word (i.e. “Anna” or “kayak”) or it can be
multiple words (i.e. “No lemon, no melon” or “Was it a cat I saw?”). It can also be a series of numbers.

On Wednesday, the United States welcomed a new administration to the White House. Thankfully, by
all accounts, the transition of power was peaceful and without incident. Wednesday also kicked off 10
consecutive days, from 1/20/21 to 1/29/21, where dates (at least those in the DD/MM/YY format) are
mirrored. According to the Farmers' Almanac, this is the first palindrome-number Inauguration Day in
United States history, with the next one occurring exactly 1,000 years from Wednesday.

Like palindromes, when charting a course in the unpredictable world of investing, it is just as
important to look backwards as it is to look forwards. History tends to be a fairly reliable guide with
clues about how markets and investors react in various environments – including when asset prices lift
off like a SpaceX rocket ship or Elon Musk’s net worth.

This week, we are presenting an article from guest author and bon ami of Evergreen Vincent Deluard,
who has frequently been featured in these pages. Mr. Deluard looks at a series of historical inflection
points, dissecting how past “everything rallies” have panned out. Similar to Evergreen’s view, Vincent
is a believer in a pending “re-opening economic boom” and allows for the possibility of one last bout of
manic euphoria. However, as we’ve also written, he lays out the risk of fantastical fanatical option
trading that’s currently enthralling markets, which is a classic sign of wild speculation that occurs
near market peaks.

While 2020 is a year that most of us will be happy to forget, it turned out to be a terrific year for
stocks. The first month of 2021 has offered more of the same, as the hopes of new stimulus,
coronavirus vaccines, and strong earnings have propelled markets forward. The question for investors
becomes, how far can markets climb? And will 2021 ultimately be the inverse of 2020 – good for the
economy, but bad for corners of the market with particularly frothy valuations?

1                                                                                                1/22/21
January 22, 2021
Schrodinger’s Market, Cognitive Dissonance, and Hyperinflation by Vincent
Deluard
Lewis Carrol’s tale summarizes the intuition behind the paradox of quantum superposition: in
Schrödinger’s famous thought experiment, a cat can be both alive and dead at the same time.
Schrödinger’s twisted logic was surely required to make sense of a week during which a mob stormed
the U.S. capitol and stock prices broke multiple records.
The first part of this report will go over several examples of the cognitive dissonance of markets in
2021: the “work from home” index is rallying along with “re-opening” stocks in the cruise line, hotel
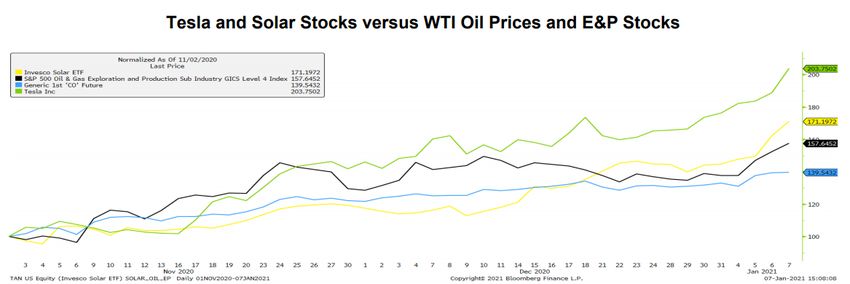
and restaurant sectors. Tesla and solar stocks are soaring on hopes of the end of the hydrocarbon age,
while exploration and production stocks are surging, and oil prices rose above their pre-pandemic
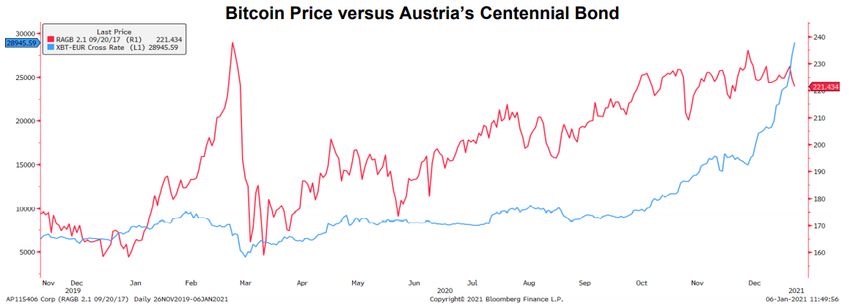
levels. Bitcoin broke $20,000, $25,000, $30,000, $40,000 but Austria’s centennial bond yields less
than 0.5%.
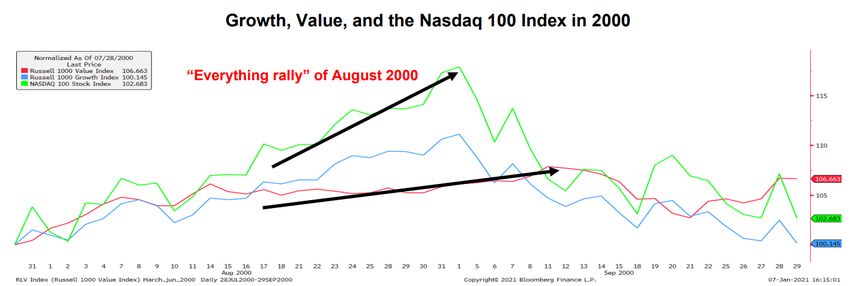
The second part will argue that such confusion is not unusual at secular inflection points. The old
themes are still carried by their accumulated momentum at the same time as new trends appear,
which can lead to explosive “everything rallies”. For example, both oil prices (the theme of the 2000s)
and large tech stocks (the theme of the 2010s) rallied furiously in 2007 and 2008, until their prices
diverged in the post-GFC environment. Similarly, breadth thrusts, which usually signal the beginning
of new bull markets, can be observed at market tops, when all assets rally in a last manic euphoria.
In these instances, relative strength charts can help investors separate the signal from the noise. On a
relative basis, new trends have already emerged: small caps are breaking out against large caps,
value is beating growth, and international markets are finally outpacing overpriced U.S. stocks,
suggesting the next five years should resemble the 2002-2007 period.
I will conclude with a disturbing thought: the “everything rally” of 2020-2021 may be the first sign of
hyperinflation. Tin foil hat-wearing gold bugs and crypto-enthusiasts are usually the ones who bring
up Venezuela and Weimar Republic comparisons, but prudent investors should consider every
scenario, even the crazy ones, in 2021.
Cognitive Dissonance in the Everything Rally
After almost a year of working in sweatpants and doing soul-crushing zoom “school” for my 5-year old,
I will allow myself to start this report with a rabbi joke.
Two neighbors fighting over a financial dispute consult the local rabbi. The first litigant
exposes its case, to which the rabbi responds, “You are right”.
The second litigant states his cases, to which the rabbi also responds, “you are also right”.
2 1/22/21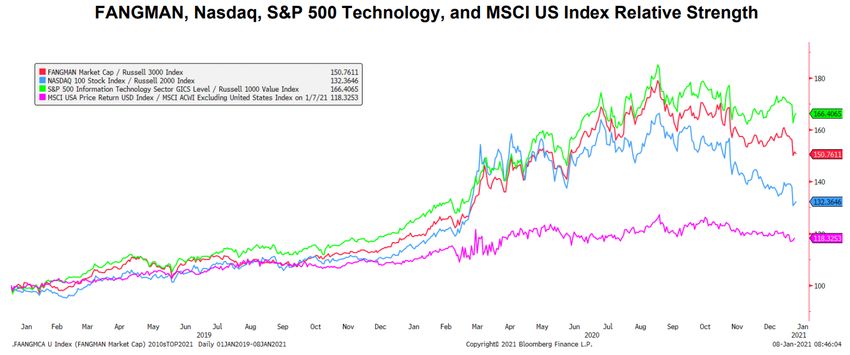
January 22, 2021

     Confused, the rabbi’s attendant asks, “but rabbi, they cannot both be right at the same
     time!”

     To which the rabbi answers, “you are right, too!”

The stock market is like the rabbi in the story, blessing logically incompatible narratives. On the one
hand, the “reflation / return to normal / value rotation” advocates (which include me) argue that the
vaccine is a game changer which will shift consumption from digital goods to the real economy, from
growth to value, and from U.S. to international markets.

On the other hand, techno-enthusiasts believe that the Covid pandemic simply accelerated the
digitalization of everything. The big trends of 2020, such as working, eating, consuming, and
entertaining the family at home, are here to stay.

As a result, Solactive’s Remote Work Index has performed just as spectacularly as hotels, restaurants,
and cruise lines since the vaccine was announced in November 2020.

                       “Work-from-Home” Index versus Reopening Sectors

This cognitive dissonance has spread to the energy sector. The vaccine news and OPEC cuts have sent
oil prices above their pre-pandemic levels in the 50s, the S&P 500 exploration and production index
has rallied by 56% since November 1, but Tesla and solar stocks rallied even more, seemingly
announcing the end of the hydrocarbon age.

3                                                                                                1/22/21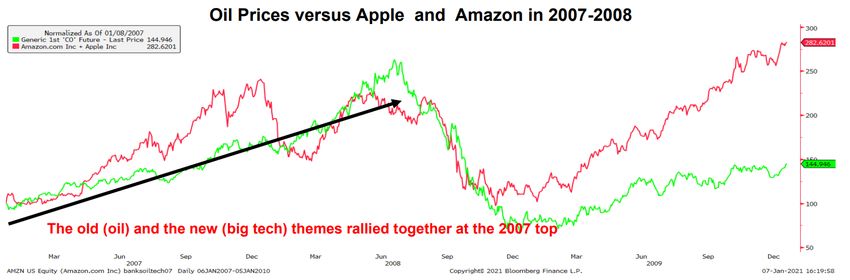
January 22, 2021

More broadly-speaking, the rally of bitcoin to $20,000, $25,000, $30,000, $40,000 (!!!) seems hard to
reconcile with the fact that Danes can take on a 20-year mortgage at exactly 0.0% or that Austria’s
centennial bond yields less than 50 basis points, as its price rallied by more than 50% since the March
low. In this case, the contradiction is more subjective: unproductive scarce assets, such as gold and
bitcoin, generally benefit from financial repression. But at the same time, bitcoin also represents an
insurance against financial collapse and the debasement of fiat currencies. Either the investors who
lend to Danish homeowners and the Austrian government at a yield of 0 are lunatics, or bitcoin
investors are. My uniformed guess is that they are both crazy, but at least I can imagine a (low-
probability) future in which cryptocurrencies are widely used, but there is no universe in which zero-
percent mortgages will make money for investors.

The craziest example of this great cognitive dissonance may be the fact that the S&P 500 index rose
by almost 3% in a week which saw a new record for Covid deaths in the U.S. and rioters storm the
U.S. Congress. This absurd outcome was the logical conclusion of a very unusual market rally, during
which stocks and volatility have often risen together. For example, the S&P 500 index broke 21 new

4                                                                                              1/22/21
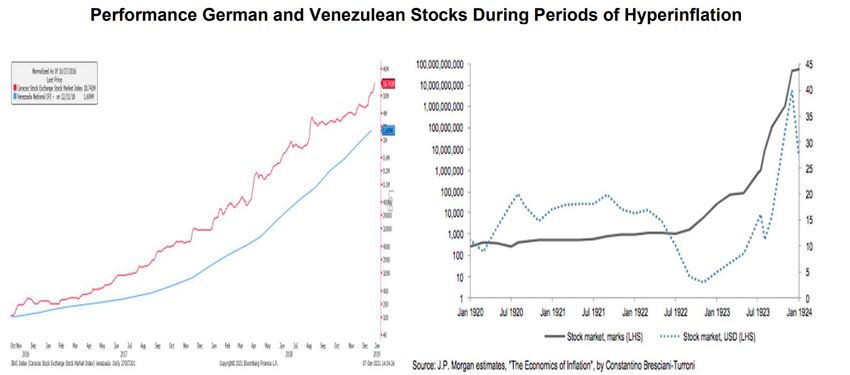
January 22, 2021

all-time highs since August 18 but the Vix index has never broken below 20.

Blomberg reporter Sarah Ponczek, who just invited me on her excellent “What Goes Up” podcast,
pointed out more than 29 million call options traded (the fourth most in history, with all three prior
records taking place in 2020) during the U.S. capitol riots. This option frenzy does not extend to
“bearish” puts: total call options volume on U.S. exchange has been twice greater than put volume
since mid-November (chart below, second clip).

The call options trading frenzy has led to extraordinarily high levels of implied volatility for deep out-
of-the-money options. The CBOE skew closed at 147 on Wednesday, almost matching its all-time high
of 159.

The Sign of a Secular Transition?
Such extreme market confusion may be the sign of a secular transition. Sailors often experience this
confusion as currents shift in unpredictable ways when the tide is about to turn. Similarly, markets
are most confusing at major market tops: the “old” themes are still supported by their slowing
momentum, while the new themes are barely emerging.

5                                                                                                  1/22/21
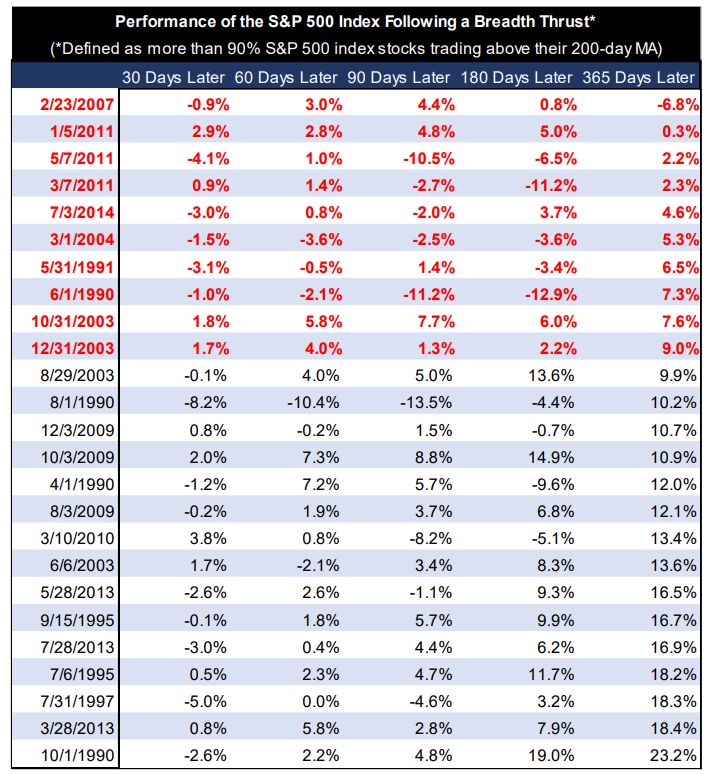
January 22, 2021

For example, the Nasdaq index made a cycle peak in March 2000, but growth and tech stocks
outperformed value stocks during the August rally, leading the S&P 500 index to a second top on
September 1, 2000.

Similarly, 2008 could have been summarized as a tug-of-war between the outgoing theme of “the
commodity supercycle”, with Brent oil prices peaking at $146 in July, and the rise of the themes of the
next decade (smartphones and e-commerce). The two trends only started to diverge in early 2009,
when the dust from the great financial crisis settled.

These “everything rallies” often cause confusion for usually-reliable breadth indicators. For example,
it has been 45 days since more than 90% of S&P 500 stocks have traded above their 200-day moving
average. The power and length of this breadth thrust is truly remarkable: the only precedent was the
rally of late 2003 and early 2004, which was indeed a great time to buy stocks.

However, breadth thrusts can also happen at major market tops, when all stocks rise in a last
euphoricmania. As shown in the table below, breadth thrust signals were also generated at major
market tops, such as February 2007, May 2011, and June 1990.

6                                                                                               1/22/21
January 22, 2021

Looking at relative strength charts helps mute the noise created by “everything rallies” and identify
the emergence of new trends. As shown in the chart below, the FANGMAN stocks (Facebook, Apple,
Netflix, Google, Microsoft, Amazon, and Nvidia) look downright awful on a relative basis.

Similarly, all the other big trends of the 2010s (Nasdaq versus small caps, technology versus value,
and the U.S. versus international markets) peaked on September 1st and relative declines have
accelerated in the past two months.

7                                                                                               1/22/21
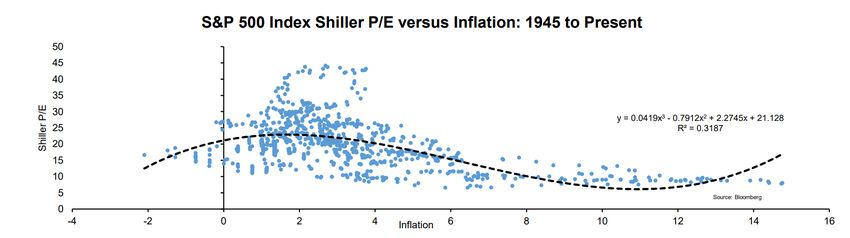
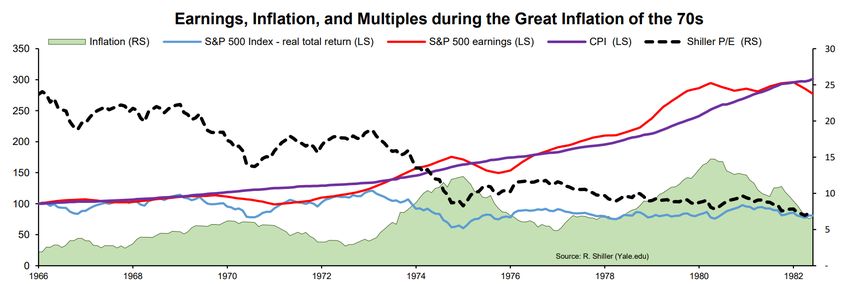
January 22, 2021

The “H-Word”
As I have explained in “How the Perpetual Motion Stock Market Will Break”, the rise of secular
inflation should eventually lead to much lower equities’ valuations. The relation between stocks’
multiples and inflation follows the bell curve in the chart below: historically, multiples have been low
during deflation, high during low-to-moderate inflation, and low in periods of high inflation. A
polynomial regression shows that inflation has explained about a third of the variation in the S&P 500
index’ cyclically-adjusted P/E since 1945.

The negative relation between inflation and stocks’ valuations was summarized by Peter Lynch’s “rule
of 20” - the P/E ratio of the market should be 20 minus the inflation rate, which would translate to a
40% decline in prices, assuming inflation does not pick up from its current level of 1.2%. That relation
was established after the great inflation of the 70s decimated the “nifty fifty” bubble of the 60s.
However, it is important to remember that the Fed Funds rate kept pace with inflation during the 70s
and that real rates tended to be positive – something that is unlikely to happen in the next five years.

8                                                                                                1/22/21
January 22, 2021

Could the “everything rally” of 2020-2021 mean that extraordinarily loose fiscal and monetary
policies, along with a generational political crisis, will unleash hyperinflation? In this case, the 70s
would not be a relevant analog: investors should look at other precedents, such as the hyperbolic rise
of German stocks in the 1920s or that of the Caracas Stock Exchange Market Index in the 2010s. In
both cases, frenetic stock market rallies marked the start of a period of hyperinflation and stock
market gains outpaced currency depreciation in the first two years of hyper-inflation.

These depressing charts lead me to two conclusions. First, stocks may be a decent hedge in the first
years of hyperinflation (they are certainly a better choice than bonds or cash) but hyperinflation is so
destructive that it eventually reduces the value of almost every business. Scarce real assets, such as
gold and commodities (and maybe bitcoin) are the best hedge against hyperinflation.

Second, I never imagined that I would feature charts of the Caracas Stock Exchange Market Index in
an institutional research note: this stuff usually belongs to the comment section of ZeroHedge articles
about bitcoin. But then again, I would have never imagined that a horned, shirtless man would lead a
mob to storm the Capitol building on the day that the S&P 500 index would break a new all-time high.
Happy crazy 2021, everyone!

9                                                                                                1/22/21
January 22, 2021

DISCLOSURE: This material has been prepared or is distributed solely for informational purposes only
and is not a solicitation or an offer to buy any security or instrument or to participate in any trading
strategy. Any opinions, recommendations, and assumptions included in this presentation are based
upon current market conditions, reflect our judgment as of the date of this presentation, and are
subject to change. Past performance is no guarantee of future results. All investments involve risk
including the loss of principal. All material presented is compiled from sources believed to be reliable,
but accuracy cannot be guaranteed and Evergreen makes no representation as to its accuracy or
completeness. Securities highlighted or discussed in this communication are mentioned for illustrative
purposes only and are not a recommendation for these securities. Evergreen actively manages client
portfolios and securities discussed in this communication may or may not be held in such portfolios at
any given time.

10                                                                                               1/22/21
You can also read