Second Quarter 2021 Earnings Presentation - August 3, 2021 Stephen Chazen - Chairman, President & CEO Christopher Stavros - Executive Vice ...

Page created by Donald Patterson
 
CONTINUE READING
Second Quarter 2021 Earnings Presentation - August 3, 2021 Stephen Chazen - Chairman, President & CEO Christopher Stavros - Executive Vice ...
Second Quarter 2021
Earnings Presentation

August 3, 2021

Stephen Chazen – Chairman, President & CEO
Christopher Stavros – Executive Vice President & CFO
Brian Corales – Vice President, Investor Relations
Second Quarter 2021 Earnings Presentation - August 3, 2021 Stephen Chazen - Chairman, President & CEO Christopher Stavros - Executive Vice ...
Disclaimer
FORWARD LOOKING STATEMENTS
The information in this presentation and the oral statements made in connection therewith include “forward-looking statements” within the meaning of Section 27A of the Securities Act of 1933, as
amended (the “Securities Act”), and Section 21E of the Securities Exchange Act of 1934, as amended. All statements, other than statements of present or historical fact included in this presentation,
regarding Magnolia Oil & Gas Corporation’s (“Magnolia,” “we,” “us,” “our” or the “Company”) financial and production guidance, strategy, future operations, financial position, estimated revenues, and
losses, projected costs, prospects, plans and objectives of management are forward-looking statements. When used in this presentation, including any oral statements made in connection therewith, the
words “could,” “should,” “will,” “may,” “believe,” “anticipate,” “intend,” “estimate,” “expect,” “project,” the negative of such terms and other similar expressions are intended to identify forward-looking
statements, although not all forward-looking statements contain such identifying words. These forward-looking statements are based on management’s current expectations and assumptions about future
events. Except as otherwise required by applicable law, Magnolia disclaims any duty to update any forward-looking statements, all of which are expressly qualified by the statements in this section, to
reflect events or circumstances after the date of this presentation. Magnolia cautions you that these forward-looking statements are subject to all of the risks and uncertainties, most of which are difficult
to predict and many of which are beyond the control of Magnolia, incident to the development, production, gathering and sale of oil, natural gas and natural gas liquids. In addition, Magnolia cautions you
that the forward looking statements contained in this press release are subject to the following factors: (i) the length, scope and severity of the ongoing coronavirus disease 2019 (“COVID-19”) pandemic,
including the effects of related public health concerns and the impact of continued actions taken by governmental authorities and other third parties in response to the pandemic and its impact on
commodity prices, supply and demand considerations, and storage capacity; (ii) the outcome of any legal proceedings that may be instituted against Magnolia; (iii) Magnolia’s ability to realize the
anticipated benefits of its acquisitions, which may be affected by, among other things, competition and the ability of Magnolia to grow and manage growth profitably; (iv) changes in applicable laws or
regulations; and (v) the possibility that Magnolia may be adversely affected by other economic, business, and/or competitive factors. Should one or more of the risks or uncertainties described in this press
release occur, or should underlying assumptions prove incorrect, actual results and plans could differ materially from those expressed in any forward-looking statements. Additional information concerning
these and other factors that may impact Magnolia's operations and projections can be found in its filings with the Securities and Exchange Commission (the "SEC"), its Annual Report on Form 10-K for the
fiscal year ended December 31, 2020, filed with the SEC on February 23, 2021. Magnolia’s SEC filings are available publicly on the SEC’s website at www.sec.gov.
NON-GAAP FINANCIAL MEASURES
This presentation includes non-GAAP financial measures, including free cash flow, EBITDAX, adjusted EBITDAX, adjusted net income, adjusted earnings, adjusted cash operating costs and adjusted cash
operating margin. Magnolia believes these metrics are useful because they allow Magnolia to more effectively evaluate its operating performance and compare the results of its operations from period to
period and against its peers without regard to accounting methods or capital structure. Magnolia does not consider these non-GAAP measures in isolation or as an alternative to similar financial measures
determined in accordance with GAAP. The computations of these non-GAAP measures may not be comparable to other similarly titled measures of other companies.
Magnolia excludes certain items from net income in arriving at adjusted net income and adjusted earnings because these amounts can vary substantially from company to company within its industry
depending upon accounting methods, book values of assets and the method by which the assets were acquired. Adjusted EBITDAX, adjusted net income, and adjusted earnings should not be considered as
alternatives to, or more meaningful than, net income as determined in accordance with GAAP. Certain items excluded from free cash flow, adjusted EBITDAX, adjusted net income, adjusted earnings,
adjusted cash operating costs and adjusted cash operating margin are significant components in understanding and assessing a company’s financial performance, and should not be construed as an
inference that its results will be unaffected by unusual or non-recurring terms.
As performance measures, adjusted EBITDAX, adjusted net income, adjusted earnings, adjusted cash operating costs and adjusted cash operating margin may be useful to investors in facilitating
comparisons to others in the Company’s industry because certain items can vary substantially in the oil and gas industry from company to company depending upon accounting methods, book value of
assets, and capital structure, among other factors. Management believes excluding these items facilitates investors and analysts in evaluating and comparing the underlying operating and financial
performance of our business from period to period by eliminating differences caused by the existence and timing of certain expense and income items that would not otherwise be apparent on a GAAP
basis. As a liquidity measure, management believes free cash flow is useful for investors and widely accepted by those following the oil and gas industry as financial indicators of a company’s ability to
generate cash to internally fund drilling and completion activities, fund acquisitions, and service debt. Our presentation of adjusted EBITDAX, adjusted net income, free cash flow, adjusted earnings,
adjusted cash operating costs and adjusted cash operating margin may not be comparable to similar measures of other companies in our industry. A free cash flow reconciliation is shown on page 14,
adjusted EBITDAX reconciliation is shown on page 15 of the presentation, adjusted net income reconciliation is shown on page 16, adjusted earnings reconciliation is shown on page 17 and adjusted cash
operating costs and adjusted cash operating margin reconciliations are shown on page 9.
INDUSTRY AND MARKET DATA
This presentation has been prepared by Magnolia and includes market data and other statistical information from sources believed by Magnolia to be reliable, including independent industry publications,
governmental publications or other published independent sources. Some data is also based on the good faith estimates of Magnolia, which are derived from its review of internal sources as well as the
independent sources described above. Although Magnolia believes these sources are reliable, it has not independently verified the information and cannot guarantee its accuracy and completeness.

                                                                                                                                                                                                              2
Second Quarter 2021 Earnings Presentation - August 3, 2021 Stephen Chazen - Chairman, President & CEO Christopher Stavros - Executive Vice ...
Magnolia Oil & Gas – 2Q 2021 Highlights
• Total production in the second quarter 2021 increased 4% sequentially to 64.9 Mboe/d. Oil production increased 11%
  sequentially.

• Production at Giddings was 36.2 Mboe/d increasing 55% from prior year levels. Giddings oil production of 12.6 Mbbl/d
  increased 97% over the same period last year.

• Generated adjusted EBITDAX of $195 million versus our D&C Capital of $54 million, or just 28% of adjusted EBITDAX,
  during the second quarter.

• Generated free cash flow of $134 million during the second quarter.

• Second quarter 2021 operating income margin was 52%.

• Cash G&A expense for the second half of the year is expected to be reduced greater than 20% to $2.00/boe from
  $2.60/boe(1) in 2020.

• Decreased long-term D&C spending to within 55% of EBITDAX, down from 60%, to generate moderate production
  growth.

• Magnolia spent $121 million reducing its diluted share count during the second quarter. As a result, the fully diluted
  share count is expected to decline by approximately 7% to 237 million diluted shares in the third quarter of 2021 from
  255 million shares in the fourth quarter of 2020.

   ‒ Magnolia ended the second quarter with 10.5 million Class A Common shares remaining under the current share
     repurchase authorization.

• Magnolia announced its inaugural semi-annual cash dividend of $0.08 per share to be paid in the third quarter.

• Third Quarter production is expected to average 67 Mboe/d, a 3 percent sequential increase.
   (1) Full year 2020 cash G&A costs of $2.60 per boe are derived from general and administrative expenses of $3.05 per boe less non-cash stock based compensation of
       $0.45 per boe.
                                                                                                                                                                        3
Magnolia Oil & Gas – 2Q 2021 Key Metrics

     Adj. Net Income (1) & Adj. EPS (1)                                                Total Production                                                   Giddings Production

             $135.0 million                                                          64.9 Mboe/d                                                              36.2 Mboe/d
               $0.56/share                                               (4% sequential growth)                                                       (55% YOY growth)

              Adjusted EBITDAX (1)                                                         D&C Capex                                                          Free Cash Flow (1)

             $195.1 Million                                                          $53.8 Million                                                        $134.0 million
                                                                            28% of Adj. EBITDAX

(1) Adjusted EPS, Adjusted Net Income, Free Cash Flow and Adjusted EBITDAX are non-GAAP measures. For a reconciliation to the most directly comparable GAAP
    measure see pages 17, 16, 14 and 15.
                                                                                                                                                                                   4
2Q 2021 Cash Flow Summary
          ($In Millions)
         400
                                                                                                                                    9
                                                                                                  21
         350
                                                                                                                                                                   54

         300

                                                                 175
         250                                                                                                                                                                                      121

         200

         150

         100                                                                                                                                                                                                  190
                                 178

            50

              0
                               Cash                        Cash Flow                   Changes in                         Acquisitions                    D&C and               Share                         Cash
                              3/31/21                        from                     Working Capital                                                  Facilities Capital (3) Repurchase (4)                 6/30/21
                                                           Operations (1)               and Other (2)

(1)   Cash flow from operations before changes in working capital.
(2)   Includes $13 million increase in working capital and $14 million increase in capital accruals which are included in the investing activities of cash flows offset by $6 million in other activities.
(3)
(4)
      D&C Capital of $54 million includes $14 million of capital activities that have been accrued but not yet paid
      Comprised of $72 million Class B Common Stock repurchases outside of share repurchase program and approximately $24 million of Class A Common Stock repurchases as part of the share
                                                                                                                                                                                                                       5
      repurchase program, and a $25 million cash settlement for the non-compete agreement in lieu of Class A Common Stock Issuance.
Share Repurchase Summary Through 2Q 2021
•    Magnolia received initial authorization to repurchase up to 10 million shares of Class A common stock in Q3 2019. The Board of
     Directors increased the share repurchase authorization by an additional 10 million shares in February 2021.

•    Through Q2 2021, Magnolia has reduced its dilutive share count by 13.1 million shares of Class A common stock as well as 16 million
     shares of Class B common stock, for a total reduction of 29.1 million shares, or approximately ~11% of the diluted shares outstanding as
     of the authorization date.

     ‒     Q3 2021 diluted share count is expected to be approximately 237 million shares.

•    Going forward, Magnolia plans to repurchase 1% of the total shares outstanding each quarter.

•    There are 10.5 million shares remaining under the current share repurchase authorization.

                                                               Quarterly Share Reduction Summary (Million Shares)

(1) Class A share reduction includes 3.6 million non-compete shares that were paid in cash in lieu of stock.

                                                                                                                                            6
Magnolia Oil & Gas – Summary Balance Sheet

   (in thousands)

                                        June 30, 2021   December 31, 2020

   Cash                                   $190,282           $192,561

   Current assets                          122,579             88,965

   Property, plant and equipment, net     1,171,633         1,149,527

   Other assets                              13,851            22,367

    Total assets                         $1,498,345        $1,453,420

   Current liabilities                    $167,949           $128,949

   Long-term debt, net                     386,996            391,115

   Other long-term liabilities             100,744             93,934

   Total stockholders' equity              842,656            839,422

    Total liabilities and equity         $1,498,345        $1,453,420

                                                                            7
2Q 2021 Capital Structure and Liquidity Overview

                                                Capital Structure Overview                                               Capitalization & Liquidity ($MM)

•     Maintaining low financial leverage profile                                                                Capitalization Summary                 As of 6/30/2021

      ‒ Net Debt / Total Book Capitalization of 17%
                                                                                                                Cash and Cash Equivalents                        $190

      ‒ Net Debt / Q2 Annualized adjusted EBITDAX of 0.3x
                                                                                                                Revolving Credit Facility                          $0
•     Current Liquidity of $640 million, including fully undrawn credit facility                   (1)

                                                                                                                6.00% Senior Notes Due 2026                      $400
•     No debt maturities until senior unsecured notes mature in 2026
                                                                                                                Total Principal Debt Outstanding                 $400
                                            Debt Maturity Schedule ($MM)
                                                                                                                Total Equity (2)                                 $843

                                                                Borrowing                        6.00% Senior   Net Debt / Q2 Annualized Adjusted
                                                                                                                                                                  0.3x
                                                                   Base                           Unsecured     EBITDAX
                                                                  $450                              Notes

                                                                                                    $400        Net Debt / Total Book Capitalization             17%

                                                                                                                Liquidity Summary                      As of 6/30/2021

                                   Credit Facility                                                              Cash and Cash Equivalents                        $190
                                    Borrowings
                                  (as of 6/30/21)
                                                                                                                Credit Facility Availability                     $450
                                                                   $0

        2020               2021               2022                2023             2024   2025      2026        Liquidity (1)                                    $640

(1) Liquidity defined as cash plus availability under revolving credit facility.
(2) Total Equity includes noncontrolling interest.
                                                                                                                                                                 8
Magnolia Oil & Gas – Margin and Cost Structure

                                                                                                           For the Quarter Ended                         For the Quarter Ended
               $ / boe, unless otherwise noted
                                                                                                                June 30, 2021                               March 31, 2021
               Revenue                                                                                                $42.42                                        $37.06
               Total Cash Operating Costs:
                 Lease Operating Expenses (1)                                                                          (3.70)                                        (3.44)
                 Gathering, Transportation & Processing                                                                (1.52)                                        (1.57)
                 Taxes Other Than Income                                                                               (2.34)                                        (1.92)
                 Exploration Expense                                                                                   (0.01)                                        (0.37)
                 General & Administrative Expenses (2)                                                                 (3.61)                                        (3.17)
               Total Adjusted Cash Operating Costs                                                                    (11.18)                                       (10.47)
               Adjusted Cash Operating Margin                                                                         $31.24                                        $26.59
                 Margin %                                                                                               74%                                           72%

               Non-Cash Costs:
                 Depreciation, Depletion, and Amortization                                                             (7.33)                                        (7.66)
                 Asset Retirement Obligations Accretion                                                                (0.24)                                        (0.24)
                 Amortization on Intangible Assets                                                                     (1.22)                                        (0.38)
                 Non-cash stock based compensation                                                                     (0.60)                                        (0.48)
               Total non-cash expenses                                                                                 (9.39)                                        (8.76)
               Operating Income Margin                                                                                $21.85                                        $17.83
                 Margin %                                                                                               52%                                           48%

(1) Lease operating expenses excludes non-cash stock based compensation of $0.1 million, or $0.02 per boe, for each of the quarters ended 6/30/2021 and 3/31/2021.
(2) General & administrative expenses excludes non-cash stock based compensation of $3.4 million, or $0.58 per boe, and $2.6 million, or $0.46 per boe, for the quarters
    ended 6/30/2021 and 3/31/2021, respectively.                                                                                                                                 9
2021 Consensus Estimates(1) vs 2019 Actuals

                        Total Net Production (Mboe/d)                                                                        D&C Capex / Adjusted EBITDAX ($MM)

                      66.8                                          66.7                                                                                              $728
                                                                                                                                $696

                                                                     44%                                                        $280
                      67%                                                                                                                                             $440

                                                                     56%                                                        $416
                      33%                                                                                                                                             $288
                                                                                                                                (60%)                                 (40%)

                 2019 Actual                                  2021E Consensus                                                2019 Actual                     2021E Consensus

                                      Giddings       Karnes                                                                             D&C Capex   EBITDAX - Capex

                             Pre-Tax Net Income ($MM)                                                                                  Diluted Share Count (MM)
                                                                    $489
                                                                                                                                263
                                                                                                                                                                            (2)
                                                                                                                                                                      235

                     $100

               Realized Oil Price:                            Realized Oil Price:
                     $60.00                                         $59.80

                 Actual 2019                                  2021E Consensus                                                 4Q 2019                        YE 2021 Estimate

(1) Based on FactSet Estimates as of 7/27/2021.
(2) Assumes MGY’s 237 million diluted share guidance for 3Q21 and a 1% reduction of the share count in 4Q21, respectively.
                                                                                                                                                                                  10
Commitment to Sustainability

     ENVIRONMENTAL                                       SOCIAL                                GOVERNANCE
Flaring                                    Workforce Health & Safety                   Board Independence
Flare less than 1% of our total net        Both employee total recordable              71% of board members are
production                                 incident rate and fatality rate were zero   independent
                                           in 2020
Fugitive Emissions                                                                     Board Diversity
Operate vent and flare systems to          Diversity                                   29% of board members are women
minimize fugitive emissions from           24% of employee population are
storage tanks                              women (38% in our Houston corporate         Executive Compensation
                                           office) and 32% identify as Asian, Black    Ratio of 2020 Chief Executive Officer’s
Water Resources                            or African American, Hispanic or Latino,    compensation to median employee’s
Operations do not produce large            or two or more races                        compensation was 1.48 to 1
volumes of water after initial
production                                 Community Support                           Say-on-Pay
                                           Gave more than $105,000 to local            More than 99% of stockholders
Groundwater                                communities, supporting more than           approved say-on-pay at 2021 Annual
Design wells to minimize the possibility   100 organizations                           Meeting of Stockholders
of well failure and ensure groundwater
is protected

Magnolia 2021 Sustainability Report is Available on Our Website Under the Sustainability Tab

                                                                                                                                 11
Appendix
Magnolia Oil & Gas – Overview

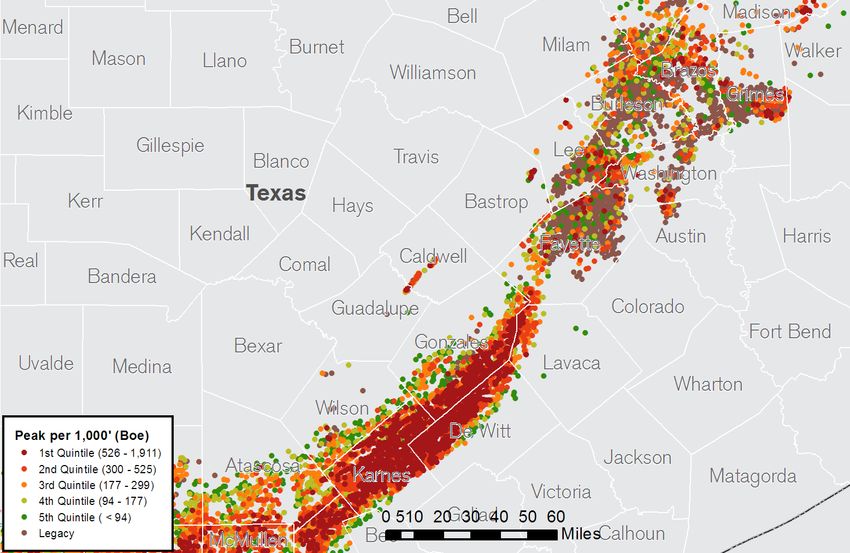
•    High-quality, low-risk pure-play South Texas operator with a core                                       ~476,000 Net Acre Position Targeting Two of the Top
     Eagle Ford and Austin Chalk position acquired at an attractive entry                                                   Oil Plays in the U.S.
     multiple
•    Significant scale and PDP base generates material free cash flow,                                               Giddings Field
     reduces development risk, and increases optionality
•    Asset Overview:
     – ~23,500 net acres in a well-delineated, low-risk position in the
         core of Karnes County, representing some of the most prolific
         acreage in the United States with industry leading break-evens
     – ~450,000 net acres in the Giddings area, a re-emerging oil play
         with significant upside and what we believe to be substantial
         inventory                                                                                                                                                        Karnes County
     – Both assets expected to remain self funding and within cash flow                                                                                                                      Gonzales

                                                                                                                                                                       Wilson

Market Statistics
                                                                                                                                                                                                        Dewitt

Trading Symbol (NYSE)                                                                     MGY
Share Price as of 7/30/2021                                                             $14.00
Common Shares Outstanding (1)                                                       236 million
Market Capitalization                                                               $3.3 billion                                                                                Source: IHS Performance Evaluator.

Long-term Debt – Principal                                                         $400 million                         Industry Leading Breakevens ($/Bbl WTI)
Cash as of 6/30/2021                                                               $190 million
                                                                                                                                                                                                         $45
                                                                                                                                                                    $39               $39
Total Enterprise Value                                                              $3.5 billion                       $32         $34        $35       $38
                                                                                                       $28
Operating Statistics                                 Karnes           Giddings        Total
Net Acreage                                          23,513            452,496       476,009
                                                                                                   Karnes Austin   Karnes Lower   Midland   Delaware   DJ Basin   Eagle Ford         STACK              Bakken
2Q21 Net Production (Mboe/d) (2)                      28.7                  36.2       64.9            Chalk        Eagle Ford
                                                                                                                                                                                              Source: RSEG.

(1) Common Stock outstanding includes Class A and Class B Stock.
(2) Giddings Includes other production not located in the Giddings Field.
                                                                                                                                                                                                            13
Free Cash Flow Reconciliation

              (in thousands)

                                                                                                           For the Quarter Ended                         For the Quarter Ended
                                                                                                                June 30, 2021                               March 31, 2021

              Net cash provided by operating activities                                                             $187,879                                   $118,153

              Add back: Changes in operating assets and liabilities                                                  (13,263)                                   23,740

              Cash flows from operations before changes in operating
                                                                                                                    $174,616                                   $141,893
              assets and liabilities

              Additions to oil and natural gas properties                                                            (54,190)                                  (40,166)

              Changes in working capital associated with additions
                                                                                                                      13,558                                    (1,744)
              to oil & gas properties

              Free cash flow (1)                                                                                    $133,984                                   $99,983

(1) Free cash flow is a non-GAAP measure. For reasons management believes this is useful to investors, refer to slide 2 “Non-GAAP Financial Measures.”

                                                                                                                                                                                 14
Reconciliation of Net Income (Loss) to Adjusted EBITDAX

                (in thousands)

                                                                                                          For the Quarter Ended                        For the Quarter Ended
                                                                                                               June 30, 2021                                June 30, 2020

                Net income (loss)                                                                                   $116,172                                       ($29,391)

                Exploration expense                                                                                      62                                         6,462

                Asset retirement obligation accretion                                                                  1,405                                        1,464

                Depreciation, depletion and amortization                                                              43,332                                        50,870

                Amortization of intangible assets                                                                      7,233                                        3,626

                Interest expense, net                                                                                  8,752                                        7,256

                Income tax expense (benefit)                                                                           2,398                                        (3,176)

                EBITDAX (1)                                                                                         $179,354                                       $37,111

                Service agreement transition costs (2)                                                               $10,345                                           -

                Non-cash stock based compensation expense                                                             $3,528                                        $3,065

                Unrealized loss on derivatives, net                                                                   $1,838                                           -

                Adjusted EBITDAX (1)                                                                                $195,065                                       $40,176

(1) EBITDAX and Adjusted EBITDAX are non-GAAP measures. For reasons management believes these are useful to Investors, refer to slide 2 “Non-GAAP Financial
    Measures.”
(2) Costs incurred during the transition period related to the termination of the Services Agreement with EnerVest Operating L.L.C. included within “General and               15
    administrative expenses” on the Company's consolidated statements of operations.
Adjusted Net Income (Loss) Reconciliation
                         (in thousands)
                                                                                                                      For the Quarter Ended                For the Quarter Ended
                                                                                                                           June 30, 2021                        June 30, 2020
                         Net income                                                                                             $116,172                             ($29,391)

                         Income tax expense (benefit)                                                                             $2,398                             ($3,176)

                         Income Before Income Taxes                                                                              118,570                             (32,567)

                         Adjustments:

                           Impairment of unproved properties (1)                                                                      -                                6,440

                           Service agreement transition costs (2)                                                                 10,345                                   -

                           Accelerated amortization of intangible                                                                 5,877                                    -

                           Unrealized loss on derivatives, net                                                                    1,838                                    -

                           Interest expense costs related to debt modification                                                    1,147                                    -

                         Adjusted Income (Loss) before income taxes                                                              137,777                             (26,127)

                         Adjusted income tax expense (benefit)                                                                    2,755                               (5,629)

                         Adjusted Net Income (Loss) (3)                                                                         $135,022                             ($20,498)

                         (in thousands)
                                                                                                                      For the Quarter Ended                For the Quarter Ended
                         Total Share Count
                                                                                                                           June 30, 2021                        June 30, 2020
                         Diluted weighted average of Class A Common Stock outstanding
                                                                                                                                 176,129                              166,572
                         during the period
                         Weighted average shares of Class B Common Stock outstanding
                                                                                                                                  66,088                               85,790
                         during the period (4)
                         Total weighted average shares of Class A and B Common Stock,
                                                                                                                                 242,217                              252,362
                         including dilutive impact of other securities (4)
(1) Impairment of unproved properties is included within Exploration expense on the consolidated statements of operations.
(2) Costs incurred during the transition period related to the termination of the Services Agreement with EnerVest Operating L.L.C. included within “General and administrative
    expenses” on the Company's consolidated statements of operations.
(3) Adjusted Net Income is a non-GAAP measure. For reasons management believes this is useful to investors, refer to slide 2 “Non-GAAP Financial Measure.”                         16
(4) Shares of Class B Common Stock, and corresponding Magnolia LLC Units, are anti-dilutive in the calculation of weighted average number of common shares outstanding.
Adjusted Earnings Reconciliation

(in thousands)
                                                                                                  For the Quarter Ended Per Share                           For the Quarter Ended Per Share
                                                                                                       June 30, 2021    Diluted EPS                              June 30, 2020    Diluted EPS
Net income (loss) attributable to Class A Common Stock                                                      $84,445                      $0.48                      ($18,272)       ($0.11)

Adjustments:

 Impairment of unproved properties (1)                                                                            -                          -                       6,440           0.04

 Service agreement transition costs (2)                                                                      10,345                       0.06                          -              -

 Accelerated amortization of intangible                                                                       5,877                       0.03                          -              -

 Unrealized loss on derivatives, net                                                                          1,838                       0.01                          -              -

 Interest expense related to debt modification                                                                1,147                       0.01                          -              -

 Noncontrolling interest impact of adjustments                                                               (5,140)                     (0.03)                      (2,183)        (0.01)

 Change in estimated income tax                                                                               (281)                          -                          -              -

Adjusted net income (loss) attributable to Class A Common Stock (3)                                         $98,231                      $0.56                      ($14,015)       ($0.08)

 (1) Impairment of unproved properties is included within Exploration expense on the consolidated statements of operations.
 (2) Costs incurred during the transition period related to the termination of the Services Agreement with EnerVest Operating L.L.C. included within “General and
     administrative expenses” on the Company's consolidated statements of operations.                                                                                                        17
 (3) Adjusted earnings is a non-GAAP measure. For reasons management believes this is useful to investors, refer to slide 2 “Non-GAAP Financial Measures.”
Magnolia Oil & Gas – Operating Highlights
                                                                                          For the Quarter Ended   For the Quarter Ended
                                                                                               June 30, 2021           June 30, 2020
                          Production:
                          Oil (MBbls)                                                                  2,903             3,089
                          Natural gas (MMcf)                                                           9,947             9,763
                          Natural gas liquids (MBbls)                                                  1,349             1,122
                           Total (Mboe)                                                                5,910             5,838

                          Average daily production:
                          Oil (Bbls/d)                                                             31,897               33,940
                          Natural gas (Mcf/d)                                                     109,313              107,289
                          Natural gas liquids (Bbls/d)                                             14,830               12,324
                           Total (Mboe)                                                            64,946               64,146

                          Revenues (in thousands):
                          Oil revenues                                                          $188,096               $60,790
                          Natural gas revenues                                                    32,595                13,168
                          Natural gas liquids revenues                                            30,035                 8,881
                           Total Revenues                                                       $250,726               $82,839

                          Average Sales Price:
                          Oil (per Bbl)                                                               $64.80            $19.68
                          Natural gas (per Mcf)                                                         3.28              1.35
                          Natural gas liquids (per Bbl)                                                22.26              7.92
                           Total (per boe)                                                            $42.42            $14.19

                          NYMEX WTI (per Bbl)                                                         $66.06            $27.85
                          NYMEX Henry Hub (per Mcf)                                                    $2.83             $1.71

                          Realization to benchmark: (1)
                          Oil (% of WTI)                                                                98%                71%
                          Natural gas (% of Henry Hub)                                                 116%                79%

(1) Benchmarks are the NYMEX WTI and NYMEX HH average prices for oil and natural gas, respectively.

                                                                                                                                          18
Magnolia Oil & Gas – Production Results

                                                                Giddings &                               Giddings &
                                    Combined       Karnes                    Combined       Karnes
                                                                  Other                                    Other
                                       Three Months Ended June 30, 2021         Three Months Ended June 30, 2020
 Production:
 Oil (MBbls)                         2,903         1,755           1,148      3,089         2,503            586
 Natural gas (MMcf)                  9,947         2,752           7,195      9,763         3,781           5,982
 Natural gas liquids (MBbls)         1,349          404             945       1,122          586             536
  Total (Mboe)                       5,910         2,618           3,292      5,838         3,719           2,119

 Average Daily Production Volume:
 Oil (MBbls/d)                        31.9          19.3           12.6        33.9          27.5            6.4
 Natural gas (MMcf/d)                109.3          30.2           79.1       107.3          41.5           65.8
 Natural gas liquids (MBbls/d)        14.8           4.4           10.4        12.3           6.4            5.9
  Total (Mboe/d)                      64.9          28.7           36.2        64.1          40.8           23.3

                                                                                                                      19
You can also read