ShinyJackpot: Visualizing lottery gambling in a large Canadian city
←
→
Page content transcription
If your browser does not render page correctly, please read the page content below
shinyJackpot: Visualizing lottery gambling in a
              large Canadian city

                                       Andrew Li1,2
               1
                Department of Psychology, University of British Columbia
    2
        Djavad Mowafaghian Centre for Brain Health, University of British Columbia
                                 andrewc.li@ubc.ca

         Abstract. Lottery gambling is widely enjoyed by Canadians and is the
         most popular form of legal gambling. As such, discovering and analyz-
         ing patterns in lottery gambling data is an important but nontrivial
         task. In this work, we describe the theory and development of this shiny
         web application. Three methods were presented to process and visualize
         it to the end user to allow for faster pattern discovery. Firstly, a bub-
         ble plot was utilized for the comparative analysis of lottery sales per
         each neighbourhood of the city of Toronto, Canada. Secondly, a scat-
         ter plot was used to explore the relationship between different neigh-
         bourhoods, lottery game product, year, lottery ticket sales, and demo-
         graphic information. Lastly, a line graph was deployed to compare the
         jackpot size and ticket sales over time. shinyJackpot is deployed at https:
         //andrewcli.shinyapps.io/shinyJackpot/ for online use.

         Keywords: Gambling · Lottery · R Shiny · ggplot2 · Visualization.

1       Introduction
Gambling is a widespread leisure activity that causes significant harm and cost.
For some individuals, it has a direct financial impact that affects family members
and friends. Lottery gambling has become so popular and enticing because of its
low cost and potential prize reward [2]. However, lower income individuals spend
a greater proportion of their income on lottery gambling than those with higher
income [3, 7, 15, 16]. Furthermore, ticket sales not only correlated with levels of
income, but also with lower socioeconomic status (SES) [10, 13]. As such, it is
important to visualize and explore this data for analysis by experts or regular
users who wish to discover trends [6]. Graphics enable the finding of patterns
and relationships to reveal insights into dense and complex data [4].
    Creating web applications is not trivial as it requires proficiency in several
programming languages. However, the introduction of the R package Shiny [5]
offers new possibilities for web applications because it only requires familiarity
with the R programming language to create an interactive web app. Furthermore,
the transition from static to dynamic graphics is relatively straightforward for
those who have knowledge of R [22]. The use of Shiny has seen a large growth (see
Fig. 1). For example, Indiana State [8], Rice [12], and Berkeley [19] University has
2 A. Li
a wide collection of apps to augment traditional statistic courses. As well, Shiny
apps are well used in the field of bioinformatics for dynamic data visualization.
Some examples include shinyCircos to visualize genomic data with circos plots
[23] and shinyChromosome to produce non-circular whole genome diagrams [24].
However, the use of Shiny apps in psychology have been limited [1, 9, 18]. To the
best of our knowledge, only one visualization exists for lottery data. Local Lotto
is offered by the Civic Data Design Lab at MIT [14]. The tool provides geographic
distribution of percentage of income spend on lottery tickets. However, it is
limited to Brooklyn, New York and is unavailable at this time. As such we
propose a new tool, shinyJackpot, a shiny app that provides lottery gambling
data at the city level and provides interactive data visualization tools that allows
users to explore trends in the cost attributable to lottery gambling in Toronto,
Canada.
We hope that this tool would be of interest to data analysts exploring re-
lated questions, policy makers interested in past trends or the general public
who wonder about the lottery gambling rate in their neighbourhood and how it
compares to other parts of the city.
Fig. 1. The cumulative number of Shiny package downloads from 2012-10-01 to 2022-
03-17. Data was generated by RStudio as they publish the download logs from their
CRAN package mirror daily at http://cran-logs.rstudio.com/.
2 Implementation
shinyJackpot was built almost entirely with the R programming language [20]
and is extended using HTML and CSS. shinyJackpot was primarily intended
to be used on its shiny server via its URL as users only need to need to have
a web browser installed. However, it can be hosted on and launched locally onshinyJackpot: Visualizing lottery gambling in a large Canadian city 3
any system with R installed provided the prerequisite packages are installed. the
latest version can be cloned or forked via the GitHub page. The latest version
can be launched as follows:
shiny::runGitHub(repo = "andr3wli/shinyapps",
subdir = "shinyJackpot")
3 Features
3.1 Intro
The Intro tab provides insights and motivations as to why we created this shiny
app. Furthermore, it includes the contact information of the author and main-
tainer as well as acknowledgements.
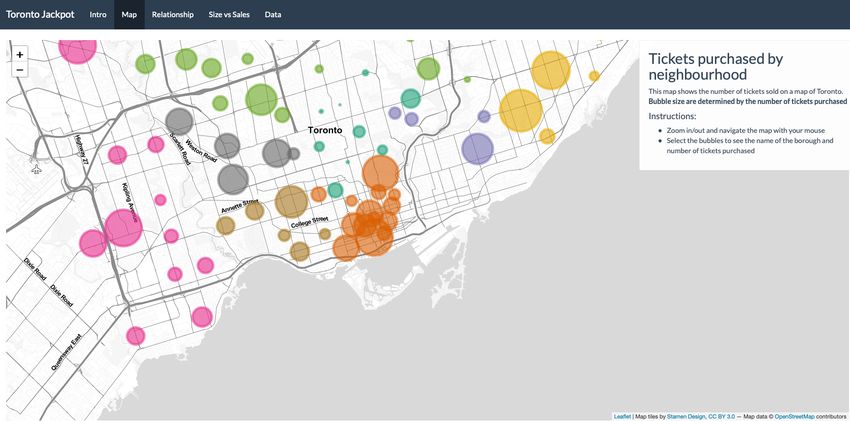
3.2 Map
As shown in Fig. 2, the Map tab visualizes the number of tickets purchased
by neighbourhood. It uses a bubble plot over a map of Toronto with the size
of the bubble indicating the numbers of ticket purchased. The different colors
represent different boroughs roughly corresponding to: Central Toronto, Down-
town Toronto, East York, Etobicoke, North York, Scarborough, West Toronto,
and York. The map was generated via the leaflet package [11]. The radii of the
circle represent the number of tickets sold in the neighbourhood - larger circles
represents more tickets sold. Users can navigate the map with their mouse and
interact with the bubbles to see the exact number of tickets purchased for a
specific neighbourhood.
The use of the bubble plot over the map allowed for rapid and easy in-
terpretation of the geographic areas with the greatest number of lottery ticket
purchases.
3.3 Relationship
As seen in Fig. 3, the Relationship tab allows users to visualize and explore the
relationships between the different variables. Using a side bar panel, users can
select the specific lottery game(s), year(s), and borough(s) to visualize. Next,
users select either ticket sales or net sales for the outcome variable. Then, users
can select income, education, socioeconomic status, population, or MBSA as the
demographic variable. Lastly, users can choose to add a best fit line of the city,
multiple lines for the boroughs, or both. A plot and the correlation is reported
from the selected variables. The plot is produced via the ggplot2 package [21]
and is made interactive via the ggiraph package.4 A. Li Fig. 2. User interface of the Map tab. The bubbles are interactive and allow users to gain more information when they hover over a specific bubble. Fig. 3. The Relationship tab allows users to explore the relationship between different demographic variables and ticket sales or net sales. This example has income on the x-axis and ticket sales on the y-axis. Furthermore, users can select no line (A), a single best fit line (B), or multiple best fit lines (C). 3.4 Size vs. Sales The Size vs. Sales (Fig. 4) tab visualizes the relationship between the jackpot size and the ticket sales. Users can select the specific year and the specific lottery game to explore. As well, users can track this relationship yearly, monthly, or weekly. A plot of the jackpot size and the ticket sales are presented, and users can clearly and easily see the change in ticket sales and jackpot size. Again, these plots are generated with the ggplot2 package [21].
shinyJackpot: Visualizing lottery gambling in a large Canadian city       5

Fig. 4. The Size vs Sales tab allows users to explore and visualize the relationship
between jackpot size and jackpot sales. This example shows the monthly size and sales
from Lotto 649 in 2012.

3.5    Data

The data tab offers users the opportunity to explore the data set interactively
via the side panel. Here, users can filter through the year, lottery game, and
borough(s). The filtered data set will be made available to explore on the app
or for download for further analysis.

4     Evaluation

shinyJackpot is still under active development, as such, the evaluation of its
capabilities is still in the early stages. However, the goals and the target users of
shinyJackpot is well-defined: to enable researchers to explore related questions
related to gambling and to enable users to explore lottery gambling rate in
Toronto. To this end, we can evaluate the usability of this web application. Our
approach to usability included multiple rounds of testing to improve weaknesses
and to find potential bugs [17]. Qualitative data was collected over multiple
months with four psychology researchers. This was invaluable as the testing
revealed several errors and contributed to the current look and functionality of
the app. The feedback provided by testers greatly improved the use and overall
quality of shinyJackpot.

5     Licensing and Availability

shinyJackpot is licenced under the GNU General Public Licence (v3.0). All its
source code was made publicly available in its GitHub repository (https://github.
com/andr3wli/shinyapps). Furthermore, there is a corresponding issue tracker
for bug reporting and feature enhancements. Requests for fixes, feature updates,
general questions and concerns can be made by filling an issue (https://github.
com/andr3wli/shinyapps/issues). Lastly, users are encouraged to contribute to
the development of shinyJackpot.
6       A. Li

6    Acknowledgement.
Geocoding data used in the Map tab was made available by https://geocoder.ca.

References
 1. Andrews, S., Ellis, D.A., Shaw, H., Piwek, L.: Beyond self-report: Tools to compare
    estimated and real-world smartphone use. PloS one 10(10), e0139004 (2015)
 2. Ariyabuddhiphongs, V.: Lottery gambling: A review. Journal of Gambling Studies
    27(1), 15–33 (2011)
 3. Beckert, J., Lutter, M.: The inequality of fair play: lottery gambling and social
    stratification in germany. European sociological review 25(4), 475–488 (2009)
 4. Chambers, J.M., Cleveland, W.S., Kleiner, B., Tukey, P.A.: Graphical methods for
    data analysis. Chapman and Hall/CRC (2018)
 5. Chang, W., Cheng, J., Allaire, J., Sievert, C., Schloerke, B., Xie, Y., Allen, J.,
    McPherson, J., Dipert, A., Borges, B.: shiny: Web Application Framework for R
    (2021), https://CRAN.R-project.org/package=shiny, r package version 1.6.0
 6. Chen, C.h., Härdle, W.K., Unwin, A.: Handbook of data visualization. Springer
    Science & Business Media (2007)
 7. Clotfelter, C.T., Cook, P.J.: Implicit taxation in lottery finance. National Tax
    Journal 40(4), 533–546 (1987)
 8. DePaolo, C.A.: The stat-attic website: Links to statistics applets for introductory
    courses. Journal of Statistics Education 18(3) (2010)
 9. Ellis, D.A., Renouf, K.J.: Predicting fear of crime: Personality outperforms prior
    victimisation. The Journal of Forensic Psychiatry & Psychology 29(3), 403–418
    (2018)
10. Fu, H.N., Monson, E., Otto, A.R.: Relationships between socio-economic status
    and lottery gambling across lottery types: neighborhood-level evidence from a large
    city. Addiction 116(5), 1256–1261 (2021)
11. Graul, C.: leafletR: Interactive Web-Maps Based on the Leaflet JavaScript Library
    (2016), http://cran.r-project.org/package=leafletR, r package version 0.4-0
12. Lane, D.M.: The rice virtual lab in statistics. Behavior Research Methods, Instru-
    ments, & Computers 31(1), 24–33 (1999)
13. Lang, K.B., Omori, M.: Can demographic variables predict lottery and pari-mutuel
    losses? an empirical investigation. Journal of Gambling Studies 25(2), 171–183
    (2009)
14. Lim, V., Deahl, E., Rubel, L., Williams, S.: Local lotto (2015)
15. Livernois, J.R.: The redistributive effects of lotteries: Evidence from canada. Public
    Finance Quarterly 15(3), 339–351 (1987)
16. Miyazaki, A.D., Hansen, A., Sprott, D.E.: A longitudinal analysis of income-based
    tax regressivity of state-sponsored lotteries. Journal of Public Policy & Marketing
    17(2), 161–172 (1998)
17. Rubin, J., Dana, J.S.D.C.C.: Chisnell: Handbook of usability testing (2008)
18. Shaw, H., Ellis, D.A., Kendrick, L.R., Ziegler, F., Wiseman, R.: Predicting smart-
    phone operating system from personality and individual differences. Cyberpsychol-
    ogy, Behavior, and Social Networking 19(12), 727–732 (2016)
19. Stark, P.B.: Sticigui: statistics tools for internet and classroom instruction with
    a graphic user interface. Available at Web site: http://stat-www. berkeley.
    edu/users/stark/SticiGui/index. htm (8 August 2004) (2004)
shinyJackpot: Visualizing lottery gambling in a large Canadian city 7
20. Team, R.C., et al.: R: A language and environment for statistical computing (2013)
21. Wickham, H.: ggplot2: Elegant Graphics for Data Analysis. Springer-Verlag New
York (2016), https://ggplot2.tidyverse.org
22. Xie, Y.: animation: An r package for creating animations and demonstrating sta-
tistical methods. Journal of Statistical Software 53, 1–27 (2013)
23. Yu, Y., Ouyang, Y., Yao, W.: shinycircos: an r/shiny application for interactive
creation of circos plot. Bioinformatics 34(7), 1229–1231 (2018)
24. Yu, Y., Yao, W., Wang, Y., Huang, F.: shinychromosome: an r/shiny application for
interactive creation of non-circular plots of whole genomes. Genomics, Proteomics
& Bioinformatics 17(5), 535–539 (2019)You can also read