"Should we call it middle class?" Economic and political stakes of the middle income group expansion in Vietnam
←
→
Page content transcription
If your browser does not render page correctly, please read the page content below
#2019-94

         “Should we call it middle class?”
    Economic and political stakes of the middle
       income group expansion in Vietnam

                                Jean-Philippe BERROU*
                                   Matthieu CLÉMENT †
                               François COMBARNOUS ‡
                                 Dominique DARBON§
                                         Kim SA LE**
                                      Éric ROUGIER††

                                         January 2018

Please cite this paper as:   BERROU, J.-P., M. CLEMENT, F. COMBARNOUS, D. DARBON, K. SA LE et
                             E. ROUGIER (2019), ““Should we call it middle class?” Economic and
                             political stakes of the middle income group expansion in Vietnam”, AFD
                             Research Papers Series, No. 2019-94, January.

Contact at l’AFD :           Anda David (davida@afd.fr)

*  LAM CNRS, Sciences Po Bordeaux
†  GREThA (CNRS), Université de Bordeaux
‡  GREThA (CNRS), Université de Bordeaux
§  Ibid.
** Center for Analysis and Forecasting & Vietnamese Academy for Social Sciences
   GREThA (CNRS), Université de Bordeaux
††
Agence Française de Développement / French Development Agency
Papiers de Recherche de l’AFD
Les Papiers de Recherche de l’AFD ont pour but de diffuser rapidement les résultats de travaux en
cours. Ils s’adressent principalement aux chercheurs, aux étudiants et au monde académique. Ils
couvrent l’ensemble des sujets de travail de l’AFD : analyse économique, théorie économique, analyse
des politiques publiques, sciences de l’ingénieur, sociologie, géographie et anthropologie. Une
publication dans les Papiers de Recherche de l’AFD n’en exclut aucune autre.
L’Agence Française de Développement (AFD), institution financière publique qui met en œuvre la
politique définie par le gouvernement français, agit pour combattre la pauvreté et favoriser le
développement durable. Présente sur quatre continents à travers un réseau de 72 bureaux, l’AFD
finance et accompagne des projets qui améliorent les conditions de vie des populations, soutiennent la
croissance économique et protègent la planète. En 2014, l’AFD a consacré 8,1 milliards d’euros au
financement de projets dans les pays en développement et en faveur des Outre-mer.
Les opinions exprimées dans ce papier sont celles de son (ses) auteur(s) et ne reflètent pas
nécessairement celles de l’AFD. Ce document est publié sous l’entière responsabilité de son (ses)
auteur(s).
Les Papiers de Recherche sont téléchargeables sur : https://www.afd.fr/fr/ressources
AFD Research Papers
AFD Research Papers are intended to rapidly disseminate findings of ongoing work and mainly target
researchers, students and the wider academic community. They cover the full range of AFD work,
including: economic analysis, economic theory, policy analysis, engineering sciences, sociology,
geography and anthropology. AFD Research Papers and other publications are not mutually exclusive.
Agence Française de Développement (AFD), a public financial institution that implements the policy
defined by the French Government, works to combat poverty and promote sustainable development.
AFD operates on four continents via a network of 72 offices and finances and supports projects that
improve living conditions for populations, boost economic growth and protect the planet. In 2014, AFD
earmarked EUR 8.1bn to finance projects in developing countries and for overseas France.
The opinions expressed in this paper are those of the author(s) and do not necessarily reflect the
position of AFD. It is therefore published under the sole responsibility of its author(s).
AFD Research Papers can be downloaded from: https://www.afd.fr/en/ressources
AFD, 5 rue Roland Barthes
75598 Paris Cedex 12, France
ResearchPapers@afd.fr
ISSN 2492 - 2846“Should we call it middle class?”
Economic and political stakes of the middle income group expansion in Vietnam
Jean-Philippe Berrou, LAM CNRS, Sciences Po Bordeaux
Matthieu Clément, GREThA CNRS, Université de Bordeaux
François Combarnous, GREThA CNRS, Université de Bordeaux
Dominique Darbon, LAM CNRS, Sciences Po Bordeaux
Kim Sa Le, Center for Analysis and Forecasting & Vietnamese Academy for Social Sciences
Éric Rougier, GREThA CNRS, Université de Bordeaux
Abstract
Middle class expansion in formerly poor countries has become the focus point of business
groups, development banks and national governments over the latter decade. By naturalizing an
income group into a social class with political agency, they misapprehend what exactly are these
“people in the middle” and what exactly are their margins of influence on the economy and
public policies. By combining microeconomic data on economic and social characteristics of
middle income earners taken from the national representative living conditions survey and
primary data on subjective perceptions of a representative sample of middle class household
heads, we find that the Vietnamese middle-income earners (1) now represent a significant share
of the population, (2) are strongly heterogeneous in terms of income, occupation and status,
(3) comprises a large share of highly vulnerable households facing high individual risks uncovered
by social protection, (4) is not a significant source of political change.
Keywords: Middle class, Vietnam, living conditions survey, qualitative survey, subjective
perceptions, aspirations, economic policy
JEL Codes: O53, P36, I31
Original version: English
Accepted: January 2019
3Introduction
Viet Nam has recently reached the middle income range of the World Bank classification. Over the past
two decades, the country achieved sustained growth accompanied by impressive progress in poverty
reduction. These achievements are largely attributed to the Doi Moi economic reform process, initiated
in 1986, which launched a series of structural transformations that encouraged private sector
development and foreign investment, moving towards a decentralized and market-oriented economy
integrated to world trade. Sustained economic growth improved the overall living standards of the
majority of the population in terms of income and health status, with many Vietnamese entering the
middle class. The middle range of the Vietnamese income distribution comprises an ever increasing
number of heterogeneous rural and urban households having more or less durably escaped poverty or
struggling to secure the socioeconomic status transmitted by their parents who held positions in the
plethoric Vietnamese administration in the 1970s or 1980s. As everywhere in emerging Asia,
socioeconomic change has been rapid in Vietnam, middle class households finding it increasingly easy
and appealing to adopt western-style consumption habits and individualistic preferences. As everywhere,
too, renewed social practices of the Vietnamese middle class prove that new habits and preferences have
been shaped by the national cultural context and sociopolitical history, so that they have not imposed a
brutal break away from the norms inherited from previous generations (Ram, 2004, Vann, 2012; Hansen
et al., 2016). In urban centers, norms of consumption, housing, moving and occupying leisure time are
changing rapidly, especially amongst the youngest generations, with important consequences in terms of
spatial organization, labor market dynamics and change of the structure of demand. These consequences
need to be addressed by public policies if these behavioral and aspirational changes are to be managed to
the benefit of all other groups in the country and if the regime wants to keep its grip on social and
political change trends involved by rapid economic transformation.
The social and economic challenges raised by the emerging Vietnamese middle class are multi-faceted, as
we will show later in this monography. However, one of the most interesting aspects of the rise of a
‘middle class’ in Vietnam, to start with, is certainly the political and ideological one. After decades of
official recognition of the structuration of Vietnamese society into different well-identified classes under
French colonial rule, the communist ideology brought about by the decolonization wars abolished class-
distinction by collectivizing all forms of private wealth and ownership in the mid-1950s, in the northern
part, and after 1975 in the rest of the country. After socialist policies had triggered a large-scale and
forced downward social mobility for the historical urban middle and upper classes who rapidly came to
be considered as the enemies of the Vietnamese communist society. Three decades after the ‘renovation’
reforms of the Doi Moi, introduced in the late 1980s, marked the gradual shift of the centrally
administrated socialist economy to a mixed economy, the middle-income strata of owners, entrepreneurs
and independent workers is no more an enemy of class in Vietnam.
Still, the term “middle class”’ is largely avoided in the country. The official discourse prefers using the
terms “middle level” or “middle income earners” in order to sidestep the political charge that is
associated to the “middle class”. The terms “middle level” or “middle-income earners”, referring to an
4average household income, are neither precise in terms of income and assets, nor adequate in conveying
the sense of educational attainment and occupational status which is traditionally associated with the
socio- economic changes observed in Vietnam. Although the middle-income group is in a phase of rapid
expansion, it is far from being sufficiently homogenous to feature a shared socio-cultural identity, akin to
a middle class identity. While rapid economic development has resulted in sharp poverty reduction,
socio- economic disparities among the middle-income strata have become increasingly visible in
everyday life. In a country where social cohesion is a shared value, rising inequality has contributed to
render the concept of class in general, and of middle class in particular, politically and socially
problematic and unspoken of. In a nutshell, not only does the socialist rejection of a class-based society
blurs the definition of the “middle class” in Vietnam, but, the strong heterogeneity of this income group
in terms of socioeconomic status and characteristics also holds back people’s identification to it.
The fallow reality of middle classes in Vietnam should not be interpreted from the single ideological or
sociological point of views. Indeed, despite the rapid increase of its size, the political impact of the
middle income group (hereafter MIG) on public policies remains limited. either does the middle-income
strata of the population participate to the definition of socio-economic policies, nor is it distinctively
targeted by sectoral public action. Our survey analyses show that policies are not targeted on this
segment of the income distribution, whose welfare improvement is mainly channeled by increased
market access. In addition, the political influence of the MIG is further undermined by the fact that its
economic support is still thin, making it utterly vulnerable. Although the emergence of an affluent
society is obvious in Vietnam, as far as global figures are considered, the consideration of quantitative
and qualitative microeconomic data shows that the Vietnamese MIG remains vulnerable and find it
uneasy to project itself in the future, notably through the channel of political influence.
Government’s failure to address the silent aspirations of this increasingly large but also deeply
heterogeneous group may end up hurting Vietnamese values promoting social justice, collective identity
and reliance. The outstanding poverty reduction and the resulting emergence of the Vietnamese middle
class must both be assessed in relation to the trend of growing social inequality experienced by the
country since two decades (Taylor, 2004). As in many emerging countries in Asia, although sustained
economic growth has improved economic conditions for all the population, growth dividends tend to be
increasingly spatially and socially polarized. This trend might end up challenge political institutions if
public policies remain uniquely inspired by the egalitarian objective of social inclusion and finally miss
the middle class aspirations of socioeconomic security, notably through the provision of higher quality
public services and social protection.
5Box 1. Vietnam in a few words
Viet Nam is located in Southeast Asia with a total land area of 329,314 square kilometers and a
coastline of approximately 3,200 kilometers. The population numbers 90 million and is
composed of 54 officially recognized ethnic groups, of whom the Kinh form the majority. With
the exception of the Hoa (Chinese), ethnic minority groups live mostly in the highlands
(Northern Mountains and Central Highlands) away from the coastal areas and major cities. Viet
Nam has 64 cities and provinces. The provinces are regrouped into non-administrative regions:
Northwest and Northeast (also called Midlands and Northern Mountains); Red River Delta;
North Central Coast and South Central Coast (also called Northern and Coastal Central Region);
Central Highlands; Southeast and Mekong River Delta.
Throughout its history, Vietnam experienced foreign domination. Despite thousand years of
Chinese rule, Vietnam emerged with many of its cultural and historical traditions intact. From
1862 until 1893, the French established control over the entire Indochina region, including
Vietnam, Laos, and Cambodia until World War II. In 1945, the French allowed the formation of
the Democratic Republic of Vietnam. Vietnam was divided at the seventeenth parallel into two
nations at the Geneva Conference (1954), the Democratic Republic of Vietnam, headed by the
communists and the southern Republic of Vietnam, led by the anticommunist forces. Thereafter,
it remained a politically divided and conflict-ridden country until 1975. After the French
withdrew from Vietnam, the United States became steadily involved in propping up the southern
regime. Two years after the United States withdrew its troops, the South Vietnamese government
surrendered in April 1975 and the reunification of the country gave birth to the Socialist Republic
of Vietnam, with its capital at Hanoi.
The National Assembly soon approved a new Constitution which declared the state to be a
"proletarian dictatorship" and proclaimed the Communist Party as the "only force leading the
state and society." Later constitutional revisions introduced major political and economic
reforms. Although the present Constitution designates the 450-member National Assembly as
the supreme organ of the state1, power remains in the hands of the Vietnamese Communist
Party (VCP) elites who hold important administrative positions in government and continue to
control a large share of the economy. Successive reforms have progressively established a mixed
market economy Chinese-style recording outstanding economic and social outcomes.
6I. Middle class in Viet Nam: Context, identification and characteristics
1.1. Vietnam’s economic development and development strategy: 30 years of gradual
economic reforms
Within a quarter of a century, the country transformed from one of the poorest in the world to a (lower)
middle income country, with per capita income increasing from US $100 in 1990 to US$2,100 in 2015
(World Bank, 2016). With a GDP per capita average growth rate of 6.0% over the period, Vietnam’s
fares as one of the fastest growing economies of the world. According to GSO figures, Vietnam’s
economy annual growth rates accelerated over the last decade 2006-2016, with GDP growth rates
ranging from 6.18% to 8.48%. Because GDP growth has been remarkably stable and rapid, social
outcomes have improved dramatically during the period. Using the US$1.90 2011 PPP line, the fraction
of people living in extreme poverty dropped from more than 50 percent in the early 1990s to 3 percent
today. Absolute poverty would have been eradicated in wealthier and urban areas of southern Vietnam.
Remaining concerns about poverty are essentially focused on the 15 percent of the population who are
members of ethnic minority groups but account for more than half the poor (Socialist Republic of
Vietnam, 2015).
Box 2. Reforms, “Chinese-style”
Much akin to China, the economic trajectory of Vietnam has been marked by the succession of
collectivization and liberalization reforms. In 1954, after declaring independence from the French,
North Vietnam adopted a fully centralized Soviet-style system, before the communist regime took
control over the entire country, after the war ended in 1975. Vietnam’s economic policy was
essentially geared toward “collectivization,” which included the total ownership of land and capital
by the State, and a close control over the economic activities and political rights of Vietnamese
through laws or “guiding principles” set forth by the Communist party. As a result of these policies,
the Vietnamese economy became increasingly dysfunctional, with investment slowing down and
both agricultural and industrial productions collapsing (Odell and Castillo, 2008). In the first part of
the 1980s, the country had to face simultaneously the lingering crisis of its main economic partner,
the Soviet Union, and a trade embargo by the West, pushing the government to engage deep reforms
in order to improve the economic situation as well as to save the political regime (Dang Phong,
2002). In 1986, the Sixth Communist Party Congress decided that Vietnam would virtually abandon
the centralized economy to adopt a “market economy with socialist orientation” through a series of
gradual reforms, known as “Doi Moi” (or “renovation”). These reforms consisted in sustaining
economic growth through the promotion of export and the attraction of FDI, the opening of the
previously state-owned sectors and industries to private firms, including foreign ones, and the de-
collectivization of agriculture. While persistent regulation and favoritism toward the State sector
undermined the impact of Doi Moi on productive investment and economic growth in a first years, a
constitutional reform was promulgated in 1992 stating that economic policies should “promote a multi-
component commodity economy functioning in accordance with market mechanisms under the management of the State
and following a socialist orientation.” (Odell and Castillo, 2008 : 84).
7This constitutional change enabled pro-market reforms aiming at encouraging the development of all
sectors of Vietnam in an economy open to foreign trade and investment, allowing for private
property, private enterprise and the protection of foreign investors’ legal ownership of their assets
(Odell and Castillo, 2008).
A number of factors which cut across the liberalization process explain the outstanding level and
stability of Vietnam’s economic growth. Institutional reforms implemented at critical times, coupled
with increased agricultural productivity, rising investment in manufacturing sector and consistent
improvements in hard and soft infrastructure, helped overcome the major growth bottlenecks faced
by the economy.
Behind Vietnam’s inclusive and socially transformative growth stand thirty years of major policy
and institutional reforms that have alleviated the main constraints and bottlenecks faced by the
formerly planned economy and shifted the economy towards market mechanisms (Box 2). These
reforms have consisted in various processes of internal and external economic liberalization (VASS-
UNDP, 2016). First, the liberalization of prices and internal trade began tackling supply shortages in
most goods and services as early as the mid-1980s. Then, further sectoral liberalization reforms
succeeded in stimulating agricultural production and spur economic growth. Next, the liberalization
of the non-agricultural sector accelerated in the 1990s with the consequence that the private sector
was boosted, before the external liberalization worked as a crucial driver of assembly FDI
localization, allowing Vietnam to be more fully integrated the Asian value chains 7. In the past years,
Vietnam Government has also paid considerable attention to the business environment notably by
passing the new Enterprise Law and Investment Law reforming administrative processes in
taxation, customs, license emission or investment procedures 8, as well as by investing and
promoting investment in information technologies and infrastructures. Lastly, the combined impact
of the universalization of primary and secondary education and of a series of improvements in
social services and social protection helped enhance people’s capabilities to seize economic
opportunities opened up by the reforms.
Overall, liberalization has brought about positive impacts on Viet Nam’s economic development,
including a surge in the amount of trade (both import and export) and inflows of FDI. Trade and
economic integration has provided a momentum for economic development, while, in the same
time, it drove an overhaul and restructuring of the economy, as well as of governance, to cope with
the potential challenges of economic integration into regional value chains and global markets.
Reforms had both positive and negative impact since they brought rapid economic growth, by
7 Since 1995 when it entered the ASEAN and officially normalized its relationship with the United States,
Viet Nam has constantly made efforts to foster its bilateral and multilateral relationships with other
countries.
8 For example, the recent launching of National business registration system (NBRS) computerizing all the
business registration procedures has helped to reduce the business registration time and to ensure the
enforcement of state governance through the creation of conditions for the community to access updated
economic information.
8modifying substantially consumption and production models inherited from the former communist
period (Beresford, 2008; Vann, 2012), while also spurring social and spatial inequalities in a country
with a strong preference for fairness (Taylor, 2004; OECD, 2014). In addition, all these reforms have
not impeded the recent growth to slow-down after macroeconomic instability raised in the late
2000s. Foreign debt sharply increased after 2005, before slightly decreasing after 2012. With an
actual level of 45.2% of GDP in early 2016, and two thirds of the public debt held in foreign
currency, Vietnamese foreign debt remains high and vulnerable to a strong depreciation of the
Dong (IMF 2016). After public spending increased, from an average of 27 percent of GDP in 2001-
2006 to 29 percent of GDP in 2007-2010, public debt including public and publicly-guaranteed debt
almost doubled since 2000 peaking at around 58 % of the GDP in 2015 9. Moreover, public
investment was growingly inefficient since spread over an excessive number of projects and not
backed by regional and urban planning, resulting in time lags and cost increases and local corruption
(VEPR, 2015). Despite its successes, the Vietnamese economy shows weaknesses, notably in terms
of governance and policy response to internal shocks which has tended to be too passive and
frequently inadequate over recent years, according to VASS-UNDP (2016), pointing to the short-
term responses to repeated economy-wide shocks in the late 2000s that distracted attention away
from the internal reforms necessary to sustain rapid and inclusive growth in a volatile environment.
1.2. Social stratification, poverty and inequality
1.2.1. Sharp poverty reduction
In a country where social inclusion is the main objective of economic policy, rapid economic growth and
structural change have increased household consumption and sharply reduced poverty, while, in the
same times, increasing inequality of income and of economic opportunities across social groups and
regions (OECD, 2014). In parallel with the policies aimed at promoting economic growth, the
Vietnamese governement undertook major reforms in the social sectors such as education, training,
public health and health care, labor and employment and social security policies. Vietnam was one of the
first developing countries that had Socio-Economic Development Strategies (SEDS) and Socio-
Economic Development Plans (SEDP) in which the economic, social and environmental pillars were all
included and given due consideration, with the overall goal of taking the country out of low income
status. The SEDS was implemented as Five-Year and Annual SEDPs and sectoral development plans at
national and local level. While the SEDP for 2001-2005 set out objectives of hunger eradication and
poverty reduction through several major approaches, including infrastructure development for the poor
and remote population, the SEDP for 2006-2010 more strongly addressed poverty reduction by
promoting agricultural progress, improving the provision of basic social services such as education,
healthcare to regions with especially difficult conditions, and by promoting the participation in hunger
eradication and poverty reduction programs. Owing to unprecedented growth rates and broad-based
investment efforts by the state, Vietnam was officially listed as a lower MIC country in 2010.
9 Although pointing risks in terms of debt sustainability, public debt is stabilized at a safe level as external
concessional loans remain a large share of Vietnam’s debt portfolio.
9The current SEDS (2011-2020) insists more on the linkages and trade-offs between rapid economic
development and sustainable development. It reaffirms the need for maintaining a rapid growth rate and
reducing development gaps with other countries, while also insisting the quality of growth. The SEDP
2011- 2015 was prepared with three distinct pillars covering economic development, social development
and environmental protection. As a consequence, the country’s views on national development evolved
substantially to include intrinsic sustainability objectives and further emphasized the importance of social
development in parallel with economic development. Notably, by mid-2012, the Party’s Central
Committee issued a resolution on social policies, entitled “Resolution No. 15-NQ-TW on major issues
relating social policies for the 2012-2020 period”, giving to social policies a particularly important role as
one of the driving forces of sustainable development in the future.
Table 1. Poverty rate using international standard (%)
1993 1998 2002 2004 2006 2008 2010 2012
National average 58.1 37.4 28.9 19.5 16.0 14.5 20.7 17.2
By area
Urban 25.1 9.2 6.6 3.6 3.9 3.3 6.0 5.4
Rural 66.4 45.5 35.6 25.0 20.4 18.7 26.9 22.1
By ethnicity
Kinh 53.9 31.1 23.1 13.5 10.3 9.0 12.9 9.9
Non-Kinh 86.4 75.2 69.3 60.7 52.3 50.3 66.3 59.2
By region
Red River Delta - - 21.5 11.8 8.9 8.0 11.9 7.5
Northern Midland and - - 47.9 38.3 32.3 31.6 44.9 41.9
mountainous areas
North Central and Central - - 35.7 25.9 22.3 18.4 23.7 18.2
coastal areas
Central Highlands - - 51.8 33.1 28.6 24.1 32.7 29.7
South East - - 8.2 3.6 3.8 2.3 7.0 5.0
Mekong River Delta - - 23.4 15.9 10.3 12.3 18.7 16.2
Notes: The General Poverty Rate is the poverty rate calculated using average expenditure/person/month
and GSO and WB rate with average expenditure/person/month by year as follows: 2002 (160,000 VND),
2004 (173,000 VND), 2006 (213,000 VND), 2008 (280,000 VND), 2010 (653,000 VND), 2012
(871,000 VND). Indicators of the year2010 onwards applied new poverty line.
Source: GSO, 1993-2013
Owing to strong economic growth, phased and managed trade liberalization as well as poverty
reduction policies targeted directly towards the most disadvantaged groups, Vietnam has achieved
impressive records in eradicating extreme poverty and poverty during the last two decades. Table 1
illustrates that the incidence of poverty has consistently reduced between 1993 and 2008, with
expenditure-based poverty falling from 58.1 percent to 14.5 percent. By using national poverty line
2011-2015, it is estimated that the poverty rate continued declining in the next period from
1014.2 percent in 2010 to 8.4 percent in 2014 (Socialist Republic of Vietnam, 2015). The depth of
poverty has also improved throughout the nation, suggesting that sufficient improvements were
made in the living standards of the very poor.
Other aspects of living conditions in terms of access to basic living facilities and ownership of
assets also improved substantially, as documented by Table 2. A uniformly upward trend in access
to all basic social services, including education and health, as well as to permanent housing, access
to electricity, water and sanitation signifies a multi-dimensional improvement in all dimensions of
quality of life during 2002-2014. To mention few examples, the percentage of households having
permanent housing increased by almost 3 times, complemented by annual increases in living space
per person, during the period. In 2012, the electricity grid had been extended to almost every
commune of the country, and was accessed by 97.6 percent of the total population. Water and
sanitation conditions were also extensively upgraded during the 2002-2012 period, with a
13 percentage points increase in access to hygienic water and 22.3 percentage point increase in
access to a sanitary toilet. In terms of asset ownership, motorbikes, telephones and color TVs have
become commonly owned by almost every family by 2012, and other durable goods like
refrigerator, air conditioner, water heater or personal computer show rapid increases over the
period.
Table 2. Access to basic living conditions
2002 2004 2006 2008 2010 2012 2014
Permanent housing (%) 17.2 20.8 23.7 27.8 49.2 49.6 46.6*
Living area per capita (m2) - 13.5 14.7 16.3 17.9 19.4 20.6
Access to electricity grid (%) 86.5 93.4 96.0 97.6 97.2 97.6 98.6
Access to sanitary toilet (%) 55.1 61.0 59.1 65.0 75.7 77.4 71.4*
Garbage collected by cart/truck 19.4 24.4 29.0 32.7 39.2 43.3 -
(%)
Access to hygienic water (%) 78.0 80.38 89.1 92.1 90.5 91.0 89.9*
Durable goods
(per 100 households)
Car - 0.1 0.2 0.4 1.3 1.8 -
Motorcycle - 55.3 68.6 89.4 96.1 115.3 -
Telephone - 28.5 51.4 107.2 128.4 154.4 -
Refrigator - 16.6 23.0 32.1 39.7 49.7 -
Color TV 69.8 82.0 92.1 85.9 97.3
Computer - 5.1 7.7 1135 17.0 18.8 -
Air conditioner - 2.2 3.7 5.5 9.4 11.6 -
Washing, drying machines - 6.2 9.3 13.3 17.6 22.7 -
Water heater - 5.4 7.6 10.1 13.3 18.5 -
Note: (*) apply new criteria for calculation.
Source: GSO, VHLSS 2002-2012, Population and Housing Mid-term Survey 2014
11Despite huge achievements in income and asset poverty reduction, the country still faces multiple
challenges. It is true that comprehensive national policies promoting rural development under the
umbrella of national targeted programs and donor-support schemes such as NTP on “New
Countryside Development” have contributed to rising living standards of rural households.
Likewise, poverty disparities between rural and urban areas have narrowed over time, with urban
areas having enjoyed rapid income growth and substantial improvement in living standards, while
rural areas also benefited (though less so) from stronger agricultural production, improved
infrastructure and greater access to basic social services. Still, while the South East has shown the
most impressive pace of poverty reduction, Northern midland and mountainous areas, inhabited
by ethnic minorities who face limited access to land, water, agricultural support services and off-
farm jobs, have remained the poorest region in the country throughout decades. Variations in
poverty reduction rates have widened between the majoritarian Kinh group and the non-Kinh
minorities. Clearly, most Kinh people have achieved the strongest socio-economic transformation,
with less than 10 percent of Kinh group suffering from poverty by 2012 against more than half of
it in 1993. Figures are less positive for the non-Kinh groups. Although a series of poverty
reduction and socio- economic support programs targeted toward the poor proved effective to a
certain extent, they failed to have a far-reaching impact on the lives of the ethnic minorities. Large
proportions of ethnic minority and rural residents in remote areas still experience high poverty
rates and continue to benefit less from the national economic development process. Without new
efforts, broad-based poverty reduction is likely unattainable, and this group needs to be the central
focus of the Government and society in national poverty reduction strategies in the upcoming
period (World Bank, 2012).
1.2.2. Rising inequality and limited social mobility
Structural transformation in Viet Nam has been accompanied by little change in overall income
and consumption inequality. Table 3 shows the Gini index values (by expenditure) measure of
income inequality and reflection of income distribution at national level. While the level of overall
inequality was the lowest in the immediate aftermath of reforms, when a large proportion of the
population still lived in poverty, it peaked in 2010, before re-diminishing close to its 2008 value.
Expenditure inequality is stronger in urban areas and amongst the Kinh group, which is more urban
than the non-Kinh. High growth rates and strong economic performance between 2002 and 2008
resulted in gains that were increasingly concentrated among the richest and the middle-income
households, especially in urban areas. Between 2008 and 2012, growth was neither pro-poor nor
pro-rich, but benefited most the middle-income group. This phenomenon might largely be
attributed to the economic slowdown starting from 2008, leading to a number of households’
falling deeper into poverty. While a small group have benefited from economic growth and rising
living standards, the larger population has fallen still further behind, aggravating the inequality
situation in the region. The recent slowing down of poverty reduction that is apparent in Table 1
therefore resulted primarily from growing inequality of living standards.
12Table 3. The Gini Index by expenditure (%)
1993 1998 2002 2004 2006 2008 2010 2012
National average 0.329 0.35 0.37 0.37 0.358 0.356 0.393 0.356
By area
Urban 0.337 0.343 0.360 0.354 0.342 0.340 0.372 0.334
Rural 0.278 0.131 0.281 0.295 0.302 0.305 0.332 0.317
By ethnicity
Kinh 0.324 0.343 0.36 0.354 0.342 0.340 0.372 0.334
Non-Kinh 0.252 0.24 0.279 0.31 0.301 0.307 0.328 0.33
Source: GSO
In addition, the last decade has witnessed large, shifting disparities in income and asset distribution
across regions. Income inequality in 2010 is noticeably high in poor areas, such as the Central
Highlands and the Northern Mountainous regions, but significantly low in the richer Southeastern
Area and Northern and Coastal Central regions. In dynamic terms, the Red River Delta and
Central Highlands regions witnessed the sharpest income improvements, with a population decline
in the bottom national income quintiles and an increase in the higher quintiles. The relatively
wealthy Southeastern Area experienced a sharp decline in the population located in the top
national quintile. In the poor Midlands and Northern Mountainous areas, the income gap
increased further, as shown by the increase in population located in the bottom national income
quintile.
Spatial inequality of assets and opportunities is also large, as illustrated by Table 4. Access to
formal employment, education and training and health facilities is much lower in rural areas. The
share of youth not in education, employment or training (NEET) ranged from 0.65% in the
North West region to 10.06% in the Mekong River Delta. Youth being NEET was much higher
in urban areas (8.2%), compared to rural areas (4.3%), where young people are more easily
engaged in agricultural activities. Access to basic infrastructure services and housing conditions
also varies substantially across regions and tends to be worse in rural areas. The percentage of
households with access to improved drinking water and improved sanitation was much lower in
rural areas and the North West region. There is less variation in electricity distribution, with lower
access in the North West but little difference between rural and urban areas.
13Table 4. Selected socio-economic indicators by rural-urban, in percentage, 2012
National Urban Rural
average
Education
Primary attainment rate 25.05 19.72 27.46
Primary enrolment rate, net 92.14 91.24 92.5
Lower secondary attainment rate 26.49 22.23 28.42
Lower secondary attainment rate, net 80.61 83.06 79.74
Higher secondary attainment rate 15.78 24.01 12.05
Higher secondary attainment rate, net 59.27 67.42 56.39
Tertiary attainment rate 1.52 2.56 1.04
Tertiary attainment rate, net 26.98 38.69 22.61
Employment
Median hourly earnings, in ‘000VND 16.09 20.05 14.29
NEET (15-24) 5.37 8.22 4.33
Type of unemployment: inactive 23.36 30.76 20.18
Type of unemployment: self- 46.25 28.52 53.88
employed
Type of unemployment: wage- 30.39 40.72 25.95
employed
Health
Cannot afford health treatment (any type of 3.26 2.48 3.61
treatment)
No health insurance 35.64 32.49 36.96
Housing
Access to improved drinking water 86.76 95.53 83.00
Access to improved sanitation 73.5 93.03 65.13
Access to national electricity 97.55 99.70 96.63
Overcrowding (benefits. Nearly 20% of employed youngsters were in low-paid work compared to 12% on
average in the country. A high percentage of people among the elderly (34%) are in work,
reflecting the insufficiencies of the pension system in Viet Nam where many people of pension
age are barely able to meet their needs unless they continue to work.
Past growth performance in Vietnam has been associated with high absolute income mobility
producing both winners and losers. While a majority of households experienced upward income
mobility, downward absolute income mobility affected nearly one out of five households. Aside
from absolute income changes, relative income mobility was particularly high. Between 2004 and
2008, only 20% of Vietnamese households remained in the same income decile, while 40% of
households experienced upward/downward relative income mobility (Table 5). A large share of
the poor was able to move up the income ladder, contributing to the rise of the relative size of the
middle-income group from 57.1% of Vietnamese households in 2004 to 60.3% in 2008. Although
the existing middle-income group remained stable, since 73% of those who were middle class in
2004 remained in this group in 2008, it also attracted a significant portion of the poor (58.5% of
the poor in 2004 became middle income group in 2008).
Table 5. Transition matrix 2004/2008
Poor Middle Rich
income
Poor 39.5 58.5 2.1
Middle income 10.4 73.0 16.6
Rich 2.0 36.6 61.4
Note: Poor, middle class and rich are defined as households with equivalized income below 50% of the
median, between 50% and 150% of the median and above 150% of the median, respectively.
Source: OECD (2014).
Paradoxically, the structural transformation in Vietnam has been associated with fairly low
mobility in terms of employment status, with a large share of the employed remaining in self-
employment. Employment mobility statistics compiled by OECD (2014) indicate that nearly two-
thirds of individuals employed in 2004 and 2008 remained in self-employment during this period.
Moreover, movements from wage to self-employment were as low as movements from self-
employment to wage employment (7% against 8%). Unskilled workers have limited opportunities
to upgrade in jobs requiring higher levels of skills, while downward skill mobility affects a non-
negligible share of skilled workers. In 2004, 73% of the employed working age population held a
position as unskilled laborers, 16% worked as skilled manual laborers and 11% worked as skilled
non-manual laborers. Employment mobility between sectors was also moderate, with the most
significant movements occurring from industry and services to agriculture (OECD, 2014). In 2004,
more than half of the working age population was employed in agriculture or the mining sector.
As for inter-sectoral employment mobility, about 85% of workers in agriculture or the mining
15sector remained in the same sector for the period 2004-08, compared to 77% for the service
sector and 50% for industry. Mobility from the industry or service sector to agriculture was also
moderate (33% and 15%, respectively), but noticeably higher than mobility from agriculture to the
service sector or industry (8% and 7%, respectively). During the 2008-09 crisis, many workers
returned to the agriculture sector, a common trend in times of crisis or loss of jobs.
Lastly, it should be noticed that the household registration system known as Ho Khau (Hộ khẩu)
has been another policy tool used to govern the formation Vietnamese large cities in the country,
over the last decades. Although the registration system seems to have less force than it used to, it
remains a source of inequality of opportunity, increasing the cost of migration to major cities. The
restrictive Ho Khau system was initially introduced as an instrument of public security, economic
planning and control of migration, with the primary motivation to reduce migration to urban cities
and the burden that new migrants would place on local public services and fiscal resources. The
system’s ties to rationed public services and employment made it an effective check on
unsanctioned migration 10. In major urban centers, the Vietnamese without permanent registration
still today face difficulties accessing public sector employment, private sector decent contracts and
wages, bank loans, business licenses, as well as services for health, utilities, schooling and social
protection 11. Concerns therefore persist that Ho Khau limits the rights and access to public
services of those who lack permanent registration in their place of residence, thereby reducing
equality of opportunity and slowing structural transformation (World Bank & VASS, 2016).
The negative effects of inequality on social cohesion are becoming more apparent since a decade.
These adverse effects notably operate through the perceptions of the Vietnamese citizens,
expressions of concern about inequality being on the rise, especially amongst the youngster.
Moreover, the socio-economic status of the family still represents the first and most immediate
environment affecting children’s and youngster’s aspirations and opportunities in Vietnam.
Moreover, the lower educational aspirations of children from disadvantaged backgrounds raise
additional concerns about inter-generational mobility in Vietnam that could drive lower middle
class frustration in the next years. Children’s educational outcomes and youngster’s employment
opportunities are strongly associated with family’s economic resources and structure, as well as
with parental education levels. As more Vietnamese move to cities and are exposed to visible
differences in welfare, popular concern about inequality, and political pressure for policy responses
is likely to grow over time.
10 According to the 2015 Household Registration and Service Access Survey, more than 5.6 million
people lacked permanent registration status where they live. The survey was conducted only in Hanoi,
Ho Chi Minh City, Binh Duong, Da Nang, and Dak Nong, found large fractions of the population
without permanent registration, particularly in Ho Chi Minh City (36%) and Binh Duong (72%). This is
a lower limit on the total number without permanent registration because the survey only covered one
of three provinces near Ho Chi Minh city with large number of migrants.
11 Net school enrollment rates are for example lower at every level for children without permanent
registration, urban schools, often overcrowded, giving priority to residents.
161.3. What does it mean being middle class in Vietnam? A review of existing
classifications
1.3.1. The debate about the middle class in Vietnam: Should we call it a class?
Although, in Vietnam, the official language is still reluctant to mention middle class, the use of
this term has recently intensified. Various issues related to the identification of the Vietnamese
groups of intermediary income to middle classes can be found in the literature.
On the one hand, common Vietnamese people generally perceive the middle class category as
those “having enough to eat, having enough to save”, meaning that persons in the middle class are
those who possess the capacity to bear day-to-day living costs while also achieving some savings.
Vietnamese usually consider two categories of people as being included in this group, those who
are regarded as middle class due to their profession, socioeconomic status and education and
skills, and those who own property, including small entrepreneurs who take risks and invest in
business ventures. On the other hand, scholars have started describing the emergence of new and
diversified social groups, including landowners and a nascent urban bourgeoisie, in the 1990s.
Some scholars then considered that a more diversified social structure would progressively
transfer economic power outside the Communist party’s bureaucracy (Beresford, 1993). Still, these
social groups had not exactly formed a homogeneous social class (Pham Xuan Nam, 2002) in the
2000s and still featured very heterogeneous socioeconomic characteristics.
Although social stratification has considerably evolved since the late 1980s, the notion of ‘middle
class’, as well as the officially preferred term of ‘middle level’, has remained problematic in
Vietnam for various reasons. First, ‘middle level’ refers to household income and does not
presume that homogenous values, educational attainment or occupational status are similar and
enable identification (Nguyen-vo Thu-huong, 2004). As underlined by Earl (2014), Vietnam’s new
middle classes are diverse in origins and have experienced a qualitatively different path involving
postcolonial development, post-war setback and post- reform re-emergence. Second, describing
social class in occupational terms can be misleading in a Vietnamese society in which the
perception of social differences has been disrupted by economic reforms. Although the new
economic conditions introduced by Doi Moi and subsequent reforms took place at the different
levels of social stratification between classes, social groups, regions and branches, they have been
particularly acute in rural areas, where a fairly large share of the Vietnamese lower middle class
works and lives. From the late 1980s to present, the surveys of social structure and labor
occupation have for example revealed significant changes in the division of labor in the rural areas
imposed by the transition to market economy (Le Ngoc Hung, 2010). The two groups that
characterized for the pre-reform period of centralized administration, i.e. the collective farmers of
the State and the co-operative farmers, are now part of the more diversified social structure,
including farmer households self-controlling production and business. However, these perceived
changes interfere with inherited perceptions of the scale of relative socioeconomic positions. as
mentioned by Earl (2014) mentions that some agricultural households that are classified as ‘middle
17class’ peasants today were formerly considered as ‘rich peasant’, that is higher class, before the
concept of middle class emerged to consciousness.
Clearly, the reconfiguration of the position and role of the ’old’ and new social groups along the
course of economic and social development needs to be more consistently identified (Hoang Chi
Bao, 2008). For example, the pre-revolutionary ‘petty bourgeoisie’ category, referring to educated
urban professionals like doctors, engineers, or teachers, that has survived in large cities actually
describes a very heterogeneous group in terms of occupation and preferences, most of them being
far from those traditionally featured by middle classes (Earl, 2014). Symmetrically, although the
emerging group identified as business persons, comprising owner or managers of private
enterprises, liability limited companies, joint-stock companies and private household businesses,
obviously has a great potential of socioeconomic transformation (Heberer and Kohl, 1998), it
hardly can be defined as a social group both because of its heterogeneity and its weak willingness
and capacity to coordinate and influence public policies (Turner and Nguyen, 2005).
Nonetheless, various recent works have endeavored to describe Vietnamese middle classes by
focusing on ideal-typical subgroups defined by their specificities and differences in terms of
education, occupation, political power (Heberer, 2003), or by focusing on the differences of
control over administrative and economic power (Kim, 2008; King et al., 2008). Following recent
work by Shove et al. (2012) inspired by social practice theory, lived experiences and social
practices of individuals within the intermediary groups have been investigated. New groups
emerging in post-reform Vietnam have brought social differentiation through new consumption
and lifestyles valuing comfort, esthetics and mobility (Hansen et al., 2016). The term ‘middle class’
in Vietnam has also tended to be used to naturalize the consumer-oriented new practices of
middle-class by reference to globalized consumerist benchmarks (Drummond, 2012; King, 2008).
Putting together various attributes of the middle class as property ownership in urban areas,
education, occupation, ownership of such goods as a vehicle, consumption power, the importance
attached to leisure activities, information access and the maintenance of social status (Huong,
2015). On the other hand, values, attitudes and other indicators of class culture beyond income,
socio-economic status and consumption have been more rarely addressed (Leshkowich, 2012).
1.3.2. In search of the Vietnamese middle class (1): Income and socioeconomic status
Recently, several works related to the middle class in Vietnam have put forward a variety of
definitions and measurements based on income and socio-economic status.
First, several sources have endeavored to identify the middle class in Vietnam by relying on
income definitions. Only few estimations of the size of the Vietnamese middle class can be found
in the non- academic and academic literatures. They lead to very heterogeneous estimates. By
using estimations of the assets owned by households, Brandmeir et al. (2015) finds that about
three million people in Vietnam should be classified as middle class, with average property being
18worth about $18,074. This low bound accounts for only 5% of the 63.6 million adult population.
More realistic, the report “The rise of Asia’s middle class” of ADB (2010) estimates the size of the
middle class across the developing Asian countries by using an absolute definition of the lower and
upper income bounds. Defined as the households located within the $2–$20 range, the
Vietnamese middle class amounted to 52.27% of total population in 2006, in which middle class in
$2-4 (2005 PPP) was 35.53%, $4-10 was 14.81%, and $10-20 was 1.93%.
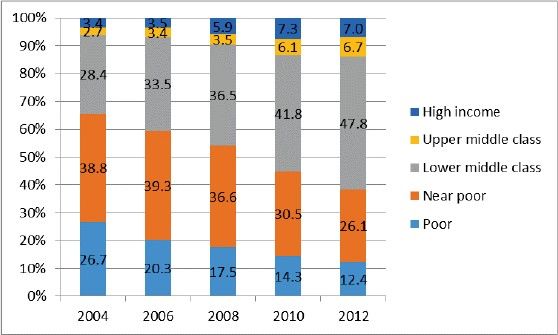
Figure 1. Change of the Vietnamese income structure: 2004-2012
Source: Vu Hoang Dat (2015): Figure 2.1. Based on VNHSS data.
19In the most recent Vietnam Human Development Report (VAAS-UNDP, 2015), emerging
middle class is defined and analyzed by using the VHLSS data. The surveyed population is broken
down into five groups by level of income: poor, with per capita income per day below US $2, near
poor, between US$2 and US$4, lower-middle class, between US$4 and US$10, upper-middle class,
between US $10 and US$13, and high income, above US $13 (all in 2005 PPP). The panel data used
by the report confirms the contrasted patterns of social mobility in the Vietnamese economy. On
the one hand, Figure 1 reveals important qualitative changes in the population structure by
income per capita over recent years, the lower and upper middle class share increasing steadily
from 31.1% to 54.5% between 2004 and 2012, as a consequence of the simultaneous decline of
the poor and near poor share from 65.5% to 38.5% (Vu Hoang Dat, 2015; VAAS- UNDP, 2016).
On the other hand, the study documents the limited scope for upward income mobility for lower
middle class since the lower middle class have found it harder to move upward the income ladder
since they were only 8.6 percent to have successfully moved up to the higher middle income group
during the period, as compared with 12.2 percent falling back to near poor category (Vu Hoang
Dat, 2015) 12.
Additional insights can be drawn from Table 6 reporting the average characteristics of the different
income groups, based on 2012 VNHSS data, with respect to various geographic and socio-
economic features of the Vietnamese middle class households. First, the upper middle class tends
to be more urban than the rest of the population with 53.2 percent of the upper middle class living
in cities as opposed to 29.6 percent for the whole population. In contrast, only 35.6 percent of the
lower middle class lives in urban locations. Highlands and ethnic minorities are underrepresented
in the two middle-class groups, while they are overrepresented in the near poor and poor groups.
Higher access to vocational training and to university, non-farm self-employment, wage
employment in formal sector and social insurance are the main socioeconomic characteristics
differentiating middle class groups from poor and near poor ones.
12 Another important finding is that economic growth has been inclusive in rural areas since 4.5 points of
the 6 percentage point increase in the population share of lower middle class group between 2010 and
2012 was due to the rural sample.
20Table 6. People in the lower middle class lack economic opportunities to resist shocks
Poor Near Lower- Upper- High
Poor middle middle income
class Class
All 12.4 26.1 47.8 6.7 7.0
Region 100 100 100 100 100
Red River Delta 9.1 16.9 26.8 34.8 29.7
North Uplands 37.0 15.1 9.1 6.1 5.8
North and Central Coast 26.4 27.9 20.6 11.8 15.6
Central Highlands 9.1 5.6 5.1 4.4 6.7
South East 2.6 9.6 19.7 26.4 27.8
Mekong River Delta 15.8 24.9 18.8 16.5 14.4
Urban/Rural 100 100 100 100 100
Rural 92.7 82.9 64.5 46.8 48.1
Urban 7.3 17.1 35.6 53.2 51.9
Ethinicity 100 100 100 100 100
Kinh-Hoa 42.6 81.4 94.8 97.6 97.3
Ethnic Minorities 57.4 18.6 5.2 2.1 2.7
Education (*) 100 100 100 100 100
Unfinished primary education 40.2 21.6 10.1 5.4 5.8
Primary 27.6 30.5 21.4 13.4 13.3
Lower Secondary 24.3 30.3 26.5 20.0 16.0
Upper Secondary 5.4 10.7 12.4 10.4 11.0
Short-term vocational training 1.4 2.8 7.4 6.6 7.1
Long-term vocational training 0.8 3.0 10.1 12.2 10.6
Junior college/university 0.2 1.1 12.2 32.0 36.3
Employment (**) 100 100 100 100 100
Agriculture 68.4 35.8 19.2 16.5 22.4
Non-farm self-employment 7.8 16.1 23.9 29.7 28.8
Wage employment in household businesses 18.1 31.1 18.3 5.0 2.1
Wage employment in formal sector 3.8 15.2 36.7 45.4 40.2
Owner of private business 0.0 0.1 0.1 0.7 4.7
Inactive 1.9 1.8 1.8 2.9 1.8
Household Characteristics
Number of members 4.9 4.6 4.4 4.1 4.0
Share of members who have health insurance 83.8 60.8 60.0 67.8 69.5
and/or are entitled to free healthcare services
Share of members over 15 years of age who 0.8 4.7 22.0 37.4 37.8
work
and have social insurance
Share of labor income out of total income 86.2 84.9 84.1 82.1 82.4
Source: VAAS-UNDP (2016).
Note: (*) and (**): respectively educational level and type of employment of the highest income earner in
the household. Source: NHDR calculated based on VHLSS 2012, Table 2.1
21Although useful, this partition of the income distribution does not allow identifying socioeconomic
profiles of middle class sub-groups. Indeed, socioeconomic characteristics are simply illustrative,
and they are not used to identify social groups rather than income groups as we propose to do in
the present study. This is also the idea behind the recent classification proposed by Le Kim Sa
(2017) based on five dimensions: Income and spending, education, housing, life and career.
Middle-class households can be divided into three groups: lower middle-class including those who
satisfy three out of five criteria, average middle-class who satisfy four criteria, and higher middle-
class and those who satisfy all five criteria. Considering that the Vietnam population was
86.9 million in 2010, and assuming that a family averages four members, Le Kim Sa (2017)
estimates that there were 29.6 million persons living in middle-class households in 2010,
representing a 34% share of the Vietnamese population. However, the estimated size of the
Vietnamese is lower for the most restrictive definition of the middle class since 19% of the whole
population could satisfy four criteria (making them average middle-class) and only 7% percent all
five criteria (making them higher middle-class). Although this approach adds socioeconomic
characteristics to the income criteria, it is nonetheless weakened by the fact that as the sub-groups
composing the middle class are not qualitatively characterized by socioeconomic features, as we do
later in the present study, they may not be assimilated to, and described as, genuine social groups.
1.3.3. In search of the Vietnamese middle class (2): Consumption trends
On the other hand, various works have tried to estimate the size of the Vietnamese middle class by
relying on consumption modes and lifestyles. According to a recent survey by Boston Consulting
Group (BCG) (Bharadwaj et al., 2013), the number of people defined as “the middle and affluent
class” (MAC) in Vietnam will jump from 12 million in 2012 to 33 million by 2020. In this survey
adopting consumption criteria, middle-income consumers are those whose income is higher than
VND 15 million (USD 714) or more a month, that is the ones whose actual spending starts to
take off for a wide array of goods and services. That amounts to about a third of the Vietnamese
population, which is by then projected to reach about 97 millions. The rapid increase of the
Vietnamese middle class is underlined by the Australian bank ANZ reporting that 2 million
Vietnamese join the middle class every year. ANZ trends are based on a market survey showing
that the middle-class tend to spend more money to buy things for themselves, especially on food
services, technology products, cars, household appliances and traveling.
With increasing incomes and living standards, Vietnamese consumers have become more
concerned about the quality, hygiene and safety of the products purchased, and health
consciousness increasingly translates into action and spending (Hansen et al., 2016). Although the
Vietnamese consumers is considered as prudent and highly price-sensitive (Huong, 2015) and the
demand for high-end consumer goods remains weak in absolute terms, various studies have
documented that Vietnamese consumers are adopting consumption patterns highly ‘symbolic of
middle class’ by buying cars, eating meat or increasingly using cosmetics and air conditioners.
Recent data show that middle-income and high-income earners are purchasing ever greater
quantities of expensive consumer electronic devices, furnishings and designer clothes, which are
22You can also read