Simple Sustainable Successful - H1 2016 Results Presentation - Nostrum Oil & Gas Plc

Page created by Harry Craig
 
CONTINUE READING
Simple Sustainable Successful - H1 2016 Results Presentation - Nostrum Oil & Gas Plc
Simple
Sustainable
Successful
H1 2016 Results Presentation
Simple Sustainable Successful - H1 2016 Results Presentation - Nostrum Oil & Gas Plc
H1 2016 Financial Results

             Financial and operational stability in a volatile and uncertain oil price environment

1 •         Stable production volumes — 3.6mmboe / 38,993 boepd (Q1 2016: 3.5mmboe / 38,754 boepd)

2 •         Continued reduction in cost base¹ — 11% reduction in combined Opex², G&A and transportation costs

3 •         Consistently strong margins — 62% EBITDA³ margin

4 •         Resilient at low oil prices — 15,000 bopd production hedged at US$49.16 / bbl with US$111.9m of cash4

5 •         Fully funded to complete GTU III and double production capacity during 2017

6 •         Substantial asset base — 2P reserves of 470mmboe as at 31 December 2015

                                                       Doubling production capacity to over 100,000 boepd in 2017
 1 Total US$m reduction from Q1 2016
 2 Opex is defined as COGS less depreciation, less royalties, less government profit share, less stock change
 3 Defined as Profit Before Tax + Finance Costs + Foreign Exchange Loss/(Gain) + ESOP + Depreciation – Interest Income + Other Expenses / (Income) + cash received from hedge
 4 Defined as Cash & Cash Equivalents + Current Investments + Non-Current Investments

                                                                                                                                                                                2
Simple Sustainable Successful - H1 2016 Results Presentation - Nostrum Oil & Gas Plc
Snapshot of key figures from Q2 2016

 Production                                                                                                                  Opex / boe2

    50,000                                                                                                                                      3.7
                                                                                                      39,232                                                   3.5
                                             38,754
    40,000                                                                                                                                      3.5

                                                                                                                             Opex / boe
                                                                                                                                                3.3
    30,000                                                                                                                                                                             3.1
boepd

                                                                                                                                                3.1
    20,000
                                                                                                                                                2.9
    10,000                                                                                                                                      2.7
                 -                                                                                                                              2.5
                                           Q1 2016                                                   Q2 2016                                              Q1 2016                 Q2 2016

 Net Operating Cash flows1                                                                                                    Gross debt / net debt
             60.0                                                                                      51.9                                   10.0x   Gross Debt / LTM EBITDA
             50.0                                                                                                                                     Net Debt / LTM EBITDA
                                                                                                                                               8.0x
             40.0

                                                                                                                             Leverage ratio
 US$m

                                                                                                                                               6.0x                             5.4x
                                                 27.0                                                                                                                                        4.7x
             30.0                                                                                                                                       4.1x
                                                                                                                                                                     3.5x
                                                                                                                                               4.0x
             20.0
             10.0                                                                                                                              2.0x

                     -                                                                                                                            -
                                          Q1 2016                                                Q2 2016                                                  Q1 2016                 Q2 2016
                                       [US$35.2 / bbl]                                        [US$46.9 / bbl]

        1   As reported in the consolidated group cash flow statement
        2 Opex    is defined as COGS less depreciation, less royalties, less government profit share, less change in stock

                                                                                                                                                                                                    3
Simple Sustainable Successful - H1 2016 Results Presentation - Nostrum Oil & Gas Plc
Capital discipline

Balance sheet                                                       Hedging programme
 • US$111.9m cash and cash equivalents¹ on balance sheet             • 15,000 bopd hedge entered into on 14 December 2015
 • US$400.0m 6.375% Notes maturing in 2019 with no                   • Strike price of US$49.16
   maintenance covenants                                             • Settles quarterly for eight quarters (final settlement
 • US$560.0m 7.125% Notes maturing in 2019 with no                     December 2017)
   maintenance covenants                                             • Total receipts of US$24.8m over the first two settlement
                                                                       periods
                                                                     • Change in fair value of the hedge of US$(40.7)m over H1
                                                                       2016 as shown on the income statement – this has no
                                                                       impact on cash received from the hedge

Capex flexibility                                                   Scalable drilling
 • Existing financing, hedging arrangements and cash flow from       • US$80m of drilling forecast for 2017
   operations ensures GTU III is fully funded under any oil price          Ø US$35m of maintenance drilling
   scenario
                                                                           Ø US$45m of discretionary drilling
 • Drilling capex scalable up/down according to prevailing oil
   price environment and outlook

  1   Defined as Cash & Cash Equivalents + Current Investments

                                                                                                                                  4
Resilience under low oil prices
– Fully funded to complete GTU III and maintain existing
production in 2016 and 2017 under any oil price

                                                                          US$35m          US$181m
                                        US$318m

                                                                                                        US$124m

                                                                                                                   US$12m
                                                                                                                            US$98m
        US$112m

                                                                                                                                        US$50m

       H1 2016                       Operating                       Gross cash             GTU III     Drilling   Other    Finance       2017
     Closing Cash                    Cash Flow                      received from         Capex (net)   Capex²     Capex     Costs    Closing Cash
                                   (@ US$45 / bbl)                     hedge
                                                                   (@ US$45 / bbl)¹

  ¹ Hedge income taxed at non-contractual rate of 20.0% included in Operating Cash Flow
  ² Drilling capex is scalable depending on oil price

                                                                                                                                                     5
A clear path to over 100k boepd
 – GTU III delivers material near term production growth
                                                             Able to deliver Ryder Scott production profile
                     Fully funded at any oil price                    with oil price of US$44 / bbl

                                                                                                                •   Fully funded to complete the construction of GTU III during
                                                                                                   110,000          2017 under any oil price scenario
                                                                              90 - 100,000
                                                            60 - 90,000
                                                                                                                •   Fully funded drilling programme to maintain existing
                                                                                                                    production in 2016 and 2017 under any oil price scenario

                                              40 - 60,000
                                                                                                                •   Following the completion of GTU III during 2017, Ryder
                                                                                                                    Scott production profile can be delivered under a US$44 /
                      40,000
                                                                                                                    bbl oil price environment prior to principal debt repayments
                                                                                                                    due 2019

                                                                                                                •   Drilling activity remains flexible according to the prevailing
                                                                                                                    oil price environment

                       2016                      2017          2018               2019               2020

Oil price                   –                     –         US$44 / bbl       US$44 / bbl         US$44 / bbl   •   A sustained improvement in the oil price environment
                                                                                                                    could increase drilling activity in 2017 which would
Drilling cost          US$50m                  US$80m       US$225m            US$230m             US$275m
                                                                                                                    increase available feedstock for GTU III in 2018

    Nostrum is fully financed to complete the construction of GTU III and has a clear path to delivering 100k
                                        boepd peak production by 2020
    Source: Ryder Scott 2015 Reserve Report

                                                                                                                                                                                     6
H1 2016 Financial Results
Financial Overview – H1 2016

US$m                                                                                                                                                           H1 2015           H1 2016    Change
Revenue                                                                                                                                                              274.1         163.5     (40.4%)
            1
EBITDA                                                                            Non-cash P&L Item                                                                  152.6         100.9     (33.9%)
                                                                                  • The change in fair value of the hedge is required under
Change in fair value of the hedge                                                   accounting policy “IFRS 9”
                                                                                  • It represents the change in the carrying value of the instrument
                                                                                                                                                                       (3.8)       (40.7)    978.6%
                                                                                    from FY 2015 to H1 2016 which is dependent on the expected
Profit before tax                                                                   future cash flows from the hedge                                                   51.8        (56.6)   (209.1%)
                                                                                  • This is purely an accounting policy and does not impact the
  Current income tax expense                                                        cash received from the hedge                                                    (40.2)         (15.5)       N/M
                                                                                  • Nostrum will receive cash from the hedge if Brent is lower than
  Deferred income tax expense                                                       US$49.16 / bbl for the settlement period                                              3.6       16.3        N/M
Net income                                                                                                                                                             15.2        (55.7)       N/M
                                                2
Earnings per share (US$c)                                                                                                                                                 8.0      (30.0)       N/M
                                  3
Capital expenditure                                                                                                                                                  135.0          99.4     (26.3%)
Net cash flows from operating activities                                                                                                                               55.6         78.9        N/M
Gross debt                                                                                                                                                           948.2         956.1       0.8%
Cash & cash equivalents4                                                                                                                                             238.1         111.9     (53.0%)
Net debt5                                                                                                                                                            710.1         844.3      18.9%
Net debt / LTM EBITDA                                                                                                                                                  2.1x         4.8x     123.8%

  1 Defined as Profit Before Tax + Finance Costs + Foreign Exchange Loss/(Gain) + ESOP + Depreciation – Interest Income + Other Expenses / (Income) + cash received from hedge
  2 Based on a weighted average no. of shares for Q1 2015 of 184.5m and 184.8m for Q2 2016
  3 Purchases (net of sales) of property, plant and equipment + purchase of exploration and evaluation assets + acquisitions

  4 Defined as Cash & Cash Equivalents + Current Investments + Non-Current Investments

  5 Defined as Total Debt - Cash & Cash Equivalents - Current Investments - Non-Current Investments

                                                                                                                                                                                                       8
Progress – Snapshot

Opex / boe1                                                                                                                         Transport costs / boe

                      4.4                              4.2                                                                                                   7.0   US$6.6 / boe
                      4.2                                                                                                                                    6.5

                                                                                                                                      Transport cost / boe
Opex / boe

                      4.0                                                                                                                                    6.0
                      3.8                                                                                                                                                         US$5.3 / boe
                                                                                                                                                             5.5
                      3.6
                      3.4                                                                                    3.3                                             5.0
                      3.2                                                                                                                                    4.5
                      3.0                                                                                                                                    4.0
                                                  H1 2015                                                H1 2016                                                     H1 2015        H1 2016

EBITDA margin                                                                                                                       Tax / boe2

                    80%                                                                                                                                      6.0   US$5.3 / boe
                                                                                                            62%
                                                      56%
                    60%
EBITDA margin

                                                                                                                                                             4.0

                                                                                                                                      Tax / boe
                    40%                                                                                                                                                           US$1.9 / boe
                                                                                                                                                             2.0
                    20%

                     0%                                                                                                                                        -
                                                  H1 2015                                                H1 2016                                                     H1 2015        H1 2016
                1   Opex is defined as COGS less depreciation, less royalties, less government profit share, less change in stock
                2   Total income tax paid (cash flow) plus royalties and government profit share

                                                                                                                                                                                                 9
Balance Sheet Summary

Highlights                                                                                                                            Gross debt / net debt

• +62% EBITDA¹ margin                                                                                                                                  10.0x    Gross Debt / LTM EBITDA
                                                                                                                                                        8.0x    Net Debt / LTM EBITDA
• US$111.9m cash & equivalents²

                                                                                                                                      Leverage ratio
                                                                                                                                                                                                5.4x
                                                                                                                                                        6.0x                                                4.8x
                                                                                                                                                                  4.1x
• 15,000 bopd production hedged at US$49.16 / bbl for 24                                                                                                                   3.5x
                                                                                                                                                        4.0x
  months (remaining value of c.US$160m @ US$30.0 / bbl oil
  price)                                                                                                                                                2.0x

                                                                                                                                                           -
                                                                                                                                                                      Q1 2016                        H1 2016

Q2 2016 Net Debt – US$785.9m                                                                                                          Maturity profile
US$m                                                                                                        Q2 2016
Total debt, including:                                                                                            956.1                                 1000              2012 Notes    2014 Notes

     2012 Notes (US$560m, 7.125% annual coupon)                                                                                                          800
                                                                                                                  548.3
                                                                                                                                                         600

                                                                                                                                             US$m
     2014 Notes (US$400m, 6.375% annual coupon)                                                                   406.3
                                                                                                                                                         400
     Finance lease                                                                                                     1.6
                                                                                                                                                         200
Cash & cash equivalents²                                                                                           111.9
                                                                                                                                                           0
Net Debt                                                                                                          844.3                                        2016        2017         2018         2019          2020

 1   Defined as Profit Before Tax + Finance Costs + Foreign Exchange Loss/(Gain) + ESOP + Depreciation – Interest Income + Other Expenses / (Income)
 ² Defined as Cash & Cash Equivalents + Current Investments + Non-Current Investments
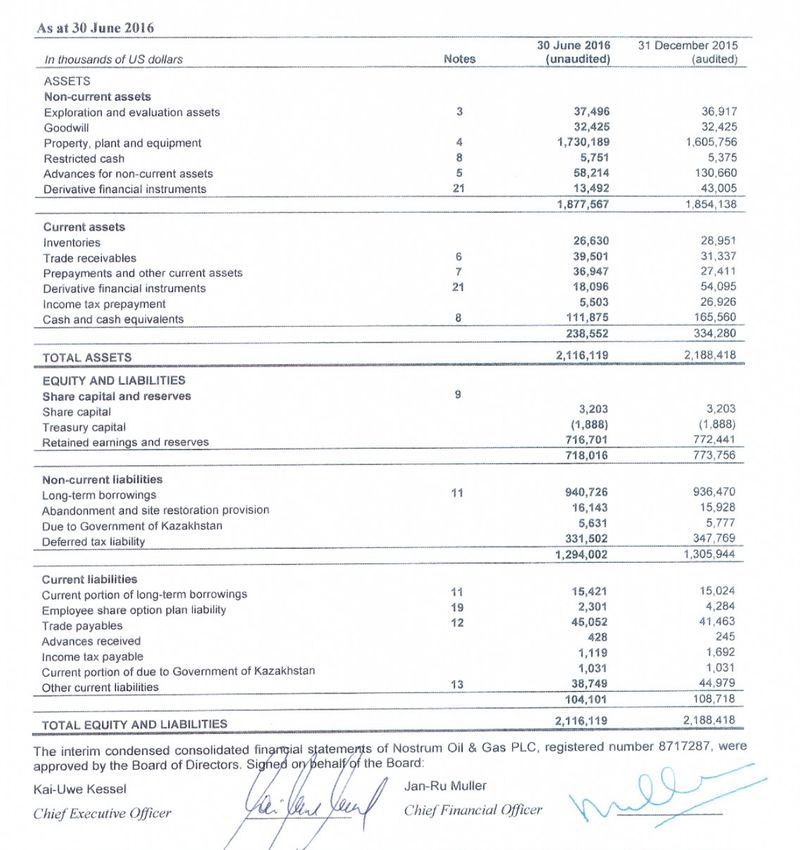
                                                                                                                                                                                                                          10
Supporting materials
Consolidated Statement of Financial Position

                                               12
Consolidated Statement of Comprehensive Income

                                                 13
Consolidated Statement of Cash Flows

                                       14
Disclaimer

THIS PRESENTATION IS NOT AN OFFER OR SOLICITATION OF AN OFFER TO BUY OR SELL SECURITIES. IT IS SOLELY FOR USE AT AN INVESTOR PRESENTATION AND IS PROVIDED AS
INFORMATION ONLY. THIS PRESENTATION DOES NOT CONTAIN ALL OF THE INFORMATION THAT IS MATERIAL TO AN INVESTOR. BY ATTENDING THE PRESENTATION OR BY READING
THE PRESENTATION SLIDES YOU ACKNOWLEDGE AND AGREE TO THE FOLLOWING:

This document and its contents are confidential and proprietary to Nostrum Oil & Gas PLC. (the “Company”) and may not be reproduced, redistributed, published or passed on (or the contents otherwise
divulged) to any other person, directly or indirectly, in whole or in part, for any purpose. If this presentation has been received in error then it must be returned immediately to the Company. This
presentation is not directed to, or intended for distribution to or use by, any person or entity that is a citizen or resident of, or located in, any locality, state, country or other jurisdiction where such distribution
or use would be contrary to law or regulation or which would require any registration or licensing within such jurisdiction. This presentation does not constitute or form part of, and should not be construed
as, an offer, invitation, recommendation to purchase, sell or subscribe for any securities of the Company in any jurisdiction or solicitation of any offer to purchase, sell or subscribe for any securities of the
Company in any jurisdiction and neither the issue of the information nor anything contained herein shall form the basis of or be relied upon in connection with any contract or commitment whatsoever, or act
as any inducement to enter into, any investment activity.

This presentation has been prepared by the Company, and no other party accepts any responsibility whatsoever, or makes any representation or warranty, express or implied, for the contents of this
presentation, including its accuracy, completeness or verification or for any other statement made or purported to be made in connection with the Company and nothing in this document or at this
presentation shall be relied upon as a promise or representation in this respect, whether as to the past or the future.
This presentation contains forward-looking statements. All statements other than statements of historical fact included in this presentation are forward-looking statements. Forward-looking statements give
the Company’s current expectations and projections relating to its financial condition, results of operations, plans, objectives, future performance and business. These statements may include, without
limitation, any statements preceded by, followed by or including words such as “target,” “believe,” “expect,” “aim,” “intend,” “may,” “anticipate,” “estimate,” “plan,” “project,” “will,” “can have,” “likely,” “should,”
“would,” “could” and other words and terms of similar meaning or the negative thereof. Such forward-looking statements involve known and unknown risks, uncertainties and other important factors beyond
the Company’s control that could cause the Company’s actual results, performance or achievements to be materially different from the expected results, performance or achievements expressed or implied
by such forward-looking statements. Such forward-looking statements are based on numerous assumptions regarding the Company’s present and future business strategies and the environment in which it
will operate in the future. Forward-looking statements are not guarantees of future performance and actual results, performance, achievements, industry or economic results may differ materially from those
described in, or suggested by, this presentation.

No representation, warranty or undertaking, express or implied, is made as to, and no reliance should be placed on, the fairness, accuracy, completeness or correctness of this presentation or the
opinions contained therein. This presentation has not been independently verified and will not be updated. The information and opinions contained in this document are provided as at the date of this
presentation and are subject to change without notice. The Company does not intend to, nor does it have any duty or obligation to supplement, amend, update or revise any of the forward-looking
statements contained in this presentation.
Market data used in this presentation not attributed to a specific source are estimates of the Company and has not been independently verified.
The Company does not accept any liability for any loss howsoever arising, directly or indirectly, from this presentation or its contents.
You can also read