Emerging Issues 2018 for Community Sector Leaders - #EmergingIssues2018 - wacoss
←
→
Page content transcription
If your browser does not render page correctly, please read the page content below

Emerging Issues 2018
for Community Sector Leaders

              #EmergingIssues2018
Rebecca Cassells
Principal Research Fellow, Head Research Impact &
Engagement
Bankwest Curtin Economic Centre
BANKWEST CURTIN ECONOMICS CENTRE

ECONOMIC AND SOCIAL OUTLOOK FOR WA
Rebecca Cassells, Principal Research Fellow
WACOSS Emerging Issues conference
10 April 2018, Bankwest Pavilion
WA’s economic and social outlook
BCEC’s core mission

       Deliver high quality, accessible research that enhances our
       understanding of key economic and social issues that contribute to the
       wellbeing of West Australians families, business and communities
WA’s economic and social outlook: current trends and risks
Overview and key issues

 What are the major economic and social challenges affecting WA?
 Themes and issues:
       • WA economy - an overview
       • Labour markets still in transition and lagging
       • Poverty and Disadvantage
       • Scarring effect of persistent poverty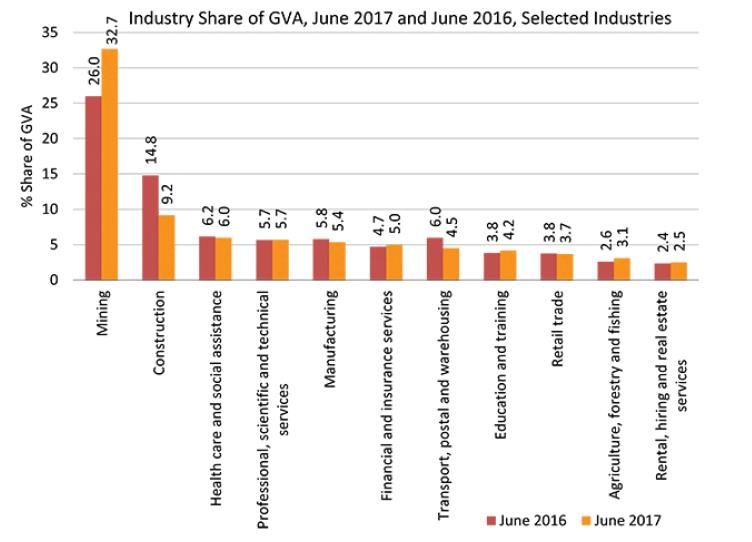
ECONOMIC
OUTLOOK FOR
WESTERN
AUSTRALIA

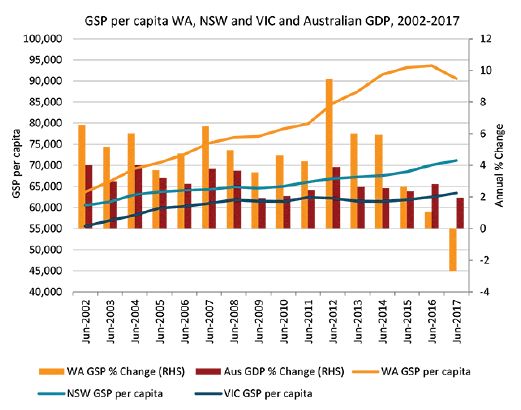
WA Economy lagging behind

Mining playing an even greater role than before
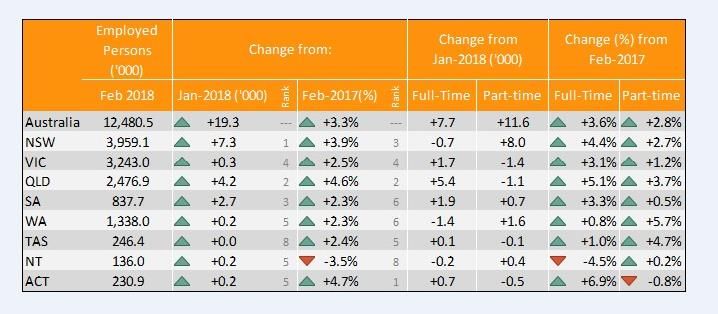
WA LABOUR
MARKETS
Full-time employment growth lagging behind
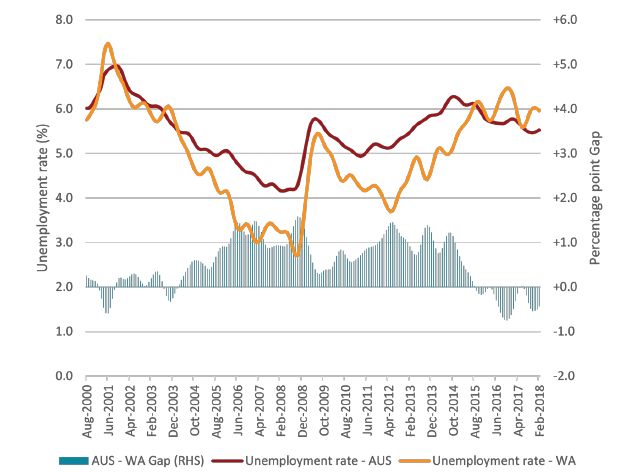
WA Unemployment above national trends
Employment gains and losses by sector - WA
POVERTY –
INCIDENCE AND
IMPLICATIONS
Poverty – Incidence and implications

  • Income and wealth inequality
  • Incidence and depth of poverty among children and young people
  • Prevalence of poverty and vulnerabilities – who is at highest risk?
  • Do government transfers protect against poverty?
  • The scarring effects of financial vulnerability
What is income poverty?

  • A measure of the deficiency of income relative to a benchmark.

  • ‘Standard’ income poverty measure is 50% median.

  • More severe measure – 30% median.

  • Standardised to control for household needs, using equivalised
    disposable income after housing costs
Depth of income poverty – Australia
Standard poverty Deep poverty
(50% median income) (30% median income)
Poverty base Rate Count Rate Count
Households 14.1% 1,253,982 5.3% 475,662
People 11.1% 2,580,601 3.6% 833,486
Children 12.1% 727,822 3.0% 180,952
Notes: Poverty rates are calculated as the percentage of children in households where real equivalised household disposable incomes
(after housing costs) fall below 50 per cent of the median. Nil and negative incomes are excluded from all poverty calculations. Data
are re-based to 2017 prices. Housing costs included mortgage repayments, rent and property rates.
Source: BANKWEST CURTIN ECONOMICS CENTRE | Authors’ calculations from HILDA longitudinal survey data, 2015Depth of income poverty – WA
Standard poverty Deep poverty
(50% median income) (30% median income)
Poverty base Rate Count Rate Count
Households 10.9% 103,439 6.2% 58,606
People 8.5% 209,305 4.3% 107,072
Children 7.2% 43,985 3.0% 18,574
Notes: Poverty rates are calculated as the percentage of children in households where real equivalised household disposable incomes
(after housing costs) fall below 50 per cent of the median. Nil and negative incomes are excluded from all poverty calculations. Data
are re-based to 2017 prices. Housing costs included mortgage repayments, rent and property rates.
Source: BANKWEST CURTIN ECONOMICS CENTRE | Authors’ calculations from HILDA longitudinal survey data, 2015Child poverty far more prevalent for single parents
The economic impact of vulnerability on young people

   • What is the impact of financial vulnerability in childhood and
     adolescence on the future economic outcomes of young people?
   • Use the HILDA survey to track young people after they
     leave the family home – select those observed for at least three years
     before and three years after leaving home
   • Compare young people according to the degree of financial vulnerability
     faced while in the family home:
       (i) no poverty at home
       (ii) poverty at home
       (iii) persistent poverty at home
   • How do their future economic outcomes compare?
Employment rates of young people after leaving home…..
Non-participation rates of young people after leaving home…..
Poverty rates of young people after leaving home…..
Summary Points

  • WA is lagging behind the rest of Australian in terms of economic
    activity – this has implications for labour market outcomes…which
    also has implications for preventing and escaping poverty.

  • The WA labour market has been underwhelming when it comes to
    full-time jobs – it’s been a story of part-time work, particularly in
    the health and caring sector.

  • Construction is lagging and pulling the state down – we need to
    think about whether there is a need for a stimulus.
Summary Points
• Income poverty is less prevalent in WA than national trends – but
still important and needs to be contextualised.
• There are significant scarring effects of persistent poverty for
children and young people that need to be addressed now to
prevent the inevitable cycle of disadvantage that these families are
experiencing.
• Welfare payment are increasingly inadequate as a protection
against poverty, and have to be part of the equationFurther reading: BCEC Quarterly Economic Update BCEC Focus on WA Series BCEC Monthly Labour Market Update
Heightened risk of poverty among young single families….

  • Children in single parent families face a far higher risk of poverty

  • More likely to experience financial hardship and material deprivation.

  • Nearly one in three children in single parent households are in poverty
    and one in seven in severe poverty.

  • Lone person - $145; single parent - $270 per week
Karen Middleton Chief Political Correspondent The Saturday Paper
Kasy Chambers
Executive Director
Anglicare Australia
What are the emerging social issues?
Is our sector and services prepared?
Emerging Issues
•   Society                                          •   Sector
•   Patchwork Economy/economic premiere              •   Employer of the working poor
•   Decrease in empathy – growth of “otherness”      •   Fit for purpose for the new demographics
•   Criminalisation and marginalisation of welfare   •   Changes in funding models
•   Individualisation of risk - employment           •   Missing the target of person centred care
•   Growing anonymity                                •   Professionalism v caring communities
•   Concentration of wealth                          •   War on advocacy
•   Changes in housing patterns
•   Population growth
Number of Job vacancies by level

                                     Job Vacancy skill level    total   National percent (rounded)

                                             Level 1           64507               37%

                                             Level 2           15006               9%

                                             Level 3           19947               12%

                                             Level 4           46105               27%

                                             Level 5           25979               15%

                                       All vacancies total     171544             100%

  Source – Internet Job Vacancy Index, data for May 2017
Emerging Issues • Society • Sector • Patchwork Economy/economic premiere • Employer of the working poor • Decrease in empathy – growth of “otherness” • Fit for purpose for the new demographics • Criminalisation and marginalisation of welfare • Changes in funding models • Individualisation of risk - employment • Missing the target of person centred care • Growing anonymity • Professionalism v caring communities • Concentration of wealth • War on advocacy • Changes in housing patterns • Population growth
Housing tenure type
#                               Household Type                                        Payment Type                Number Affordable & Appropriate          Percentage Affordable & Appropriate

1    Couple, two children                              Newstart Allowance                                                                            55                                           0.4%
     (one aged less than 5,                            (both adults)
     one aged less than 10)

2    Single, two children                              Parenting Payment Single                                                                      11                                           0.1%
     (one aged less than 5,
     one aged less than 10)

3    Couple, no children                               Age Pension                                                                                  257                                           2.1%

4    Single, one child                                 Parenting Payment Single                                                                       9                                           0.1%
     (aged less than 5)

5    Single, one child                                 Newstart Allowance                                                                             1                                           0.0%
     (aged over 8)

6    Single                                            Age Pension                                                                                   83                                           0.7%

7    Single aged over 21                               Disability Support Pension                                                                     5                                           0.0%

8    Single                                            Newstart Allowance                                                                             0                                           0.0%

9    Single aged over 18                               Youth Allowance                                                                                0                                           0.0%

10   Single in share house                             Youth Allowance                                                                                0                                           0.0%

11   Couple, two children                              Minimum Wage + FTB A                                                                         5817                                         46.8%
     (one aged less than 5,                            (both adults)
     one aged less than 10)

12   Single, two children                              Minimum Wage + FTB A & B                                                                     764                                           6.1%
     (one aged less than 5,
     one aged less than 10)

13   Single                                            Minimum Wage                                                                                 124                                           1.0%

14   Couple, two children                              Minimum Wage + Parenting payment (partnered) + FTB A & B                                     2244                                         18.0%
     (one aged less than 5,
     one aged less than 10)

                              Total No of Properties                                   12,437

           2017 Rental Affordability Snapshot Perth Metro
Emerging Issues • Society • Sector • Patchwork Economy/economic premiere • Employer of the working poor • Decrease in empathy – growth of “otherness” • Fit for purpose for the new demographics • Criminalisation and marginalisation of welfare • Changes in funding models • Individualisation of risk - employment • Missing the target of person centred care • Growing anonymity • Professionalism v caring communities • Concentration of wealth • War on advocacy • Changes in housing patterns • Population growth
Cost of privilege
Benefit                          Total expenditure ($B) Bottom 20% ($B) Top 20% ($B)
Principle residence CGT exemption 74                  5.1              31.8
Superannuation – earnings        19.25                -0.06            11.1
Superannuation – contributions   16.9                 -0.05            9.75
Capital gains tax concession     10.3                 0.23             8.4
Negative gearing                 4.55                 0.3              1.73
Private health GST exemption     4.3                  0.22             2.26
Education GST exemption          4.1                  0.4              1.51
Discretionary trusts             2.0                  0                2.0
Total                            135.4                6.14             68.55
www.anglicare.asn.au
Chris Twomey
Leader Policy Development & Research
Western Australian Council of Social Service

                          #EmergingIssues2018
Environmental Scan
• ECONOMIC
• POLITICAL
• SOCIAL
• SERVICES
• SECTOREnvironmental Scan
• ECONOMIC Rebecca Castells
• POLITICAL Karen Middleton
• SOCIAL (National) (State)
• SERVICES Kasy Chambers Chris Twomey
• SECTORWhere to from here?
• WA Politics - some observations
• Machinery of government timeline & risks
• Community services as an ecosystem?
• The Care Economy
• Future work & 21C safety netPolitical Issues - State
• The honeymoon is over… Time to deliver
• Beyond austerity? – Diversifying WA economy
• Narrative in Govt? … 2018 Budget vision
• Lack of effective Opposition – need to reframeMachinery of Government changes
• The need and long-term benefits of change
• A realistic timeline for impact?
• Cultural change – Community at the heart of it all
• The risks of austerity
• A focus on long-term outcomesMachinery of Government changes
• The need and long-term benefits of change
• A realistic timeline for impact? 7-10 years
• Cultural change – community at the heart of it
• The risks of austerity
• A focus on long-term outcomesThe Ecosystem Project …
• What does a healthy CS ecosystem look like?
• Challenging assumptions
Competition vs collaboration, economies of scale,
markets, diversity & choice, resilience …
• Hollowing out local capacity in NSW
• Principles & metricsThe Care Economy
• UK research on stimulus in 7 OECD nations (incl. Oz)
• 2% GDP in Care: 356,812 jobs (+2.3%)
indirect = 613,597 jobs (+4.0%)
• 2% GDP Construction: 74,791 jobs (+0.5%)
indirect = 387,452 jobs (+2.5%)
• Counter-cyclic investment to meet projected needThe Future of Work?
• Human jobs will be more human
• WA care workforce – triple by 2030
• A 21st Century social safety net …Child poverty rates in WA - post Welfare to Work
Youth employment rates after persistent poverty
The Future of Work?

     • Human jobs will be … more human
     • WA care workforce – triple by 2030
     • A 21st Century social safety net …
     • Fit-for-purpose, resilient and work ready
     • A Guaranteed Adequate Income?
Emerging Issues Panel
Rebecca Cassells, Kasy Chambers
Karen Middleton, Chris Twomey
#EmergingIssues2018You can also read