Snapshot of Race and Home Buying in America - 2022 National Association of REALTORS
←
→
Page content transcription
If your browser does not render page correctly, please read the page content below

2022
Snapshot of Race and Home
Buying in America
National Association of
REALTORS®
Research Group

NAR Research Staff
Lawrence Yun, Ph.D.
Chief Economist and Senior Vice President

Jessica Lautz, Dr. of Real Estate
Vice President, Demographics and Behavioral Insights

Nadia Evangelou
Senior Economist and Director of Forecasting

Brandi Snowden
Director, Member and Consumer Survey Research

Meredith Dunn
Research Manager

©2022 National Association of REALTORS®
All Rights Reserved.
May not be reprinted in whole or in part without permission of the
National Association of REALTORS®.
For reprint information, contact data@realtors.org.
February 2022

                                                                     2
Table of Contents
Homeownership Trends, Mortgage Market and           4
Affordability by Race

Methodology: Section One                            21

Home Buyer Demographics from the 2021 Profile       22
of Home Buyers and Sellers

Home Buyers and Fair Housing                        35

Methodology: Section Two and Three                  39

                                                3
Homeownership
Trends, Mortgage
Market and
Affordability by
Race

               4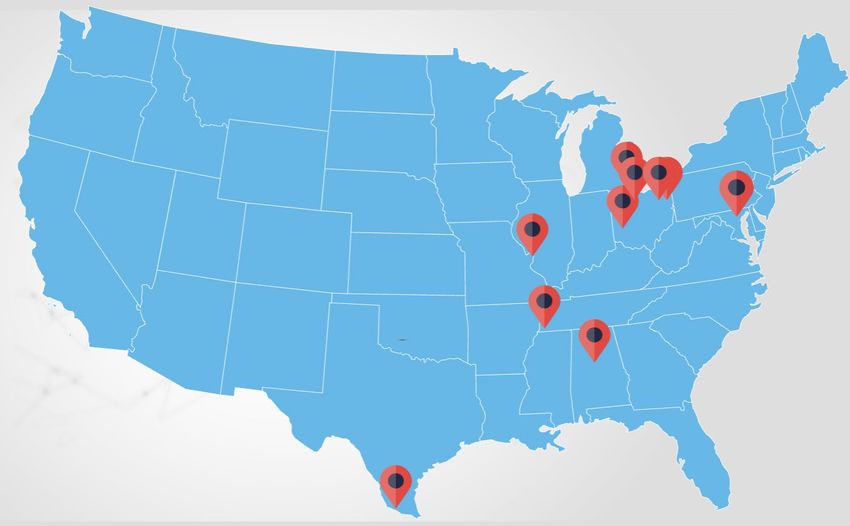
Introduction
Since 2006, 2021 was the best year for the real estate          Owing a home is associated with better educational
market in the last 15 years. Home purchases surged over         performance of children, higher participation in civic and
the past year in an abnormal way. Even though home              volunteering activity, better health care outcomes and lower
prices hit record highs eroding affordability, the housing      crime rates in the communities.
market outperformed. The main driver of this booming
housing market was record low mortgage rates, as the            Nevertheless, not all families have the same opportunities to
interest rate on a mortgage has a direct impact on the size     homeownership, with many of them facing more constraints in
of a mortgage payment. Higher rates increase mortgage           their effort to achieve the American Dream. Indeed, there are
payments while higher rates typically reduce the amount of      sizeable differences in homeownership rates across groups, with
money that people can borrow. Thus, millions of people          the rate of homeownership for minority families lagging behind
rushed to benefit from these low rates pushing up activity      the national average. Given that homeownership contributes to
in the real estate market. Furthermore, pent-up demand          wealth accumulation and the homeownership rate is lower in
and lifestyle shifts during the pandemic were also drivers of   minority groups, data shows that the net worth for these groups
the housing market.                                             is also lower. At $188,200, the net worth of a typical white family
                                                                was nearly 8 times greater than that of a Black family ($24,100) in
While the booming housing market contributed                    2019.
significantly to the recovery of the U.S. economy, research
has consistently shown that homeownership is also               Thus, this report examines the homeownership trends among
associated with multiple economic and social benefits to        each race and the challenges that they face to become
individual homeowners. Homeownership has always been            homeowners. Since all real estate is local, the report also
an important way to build wealth. According to NAR, the         examines homeownership across race groups and locations in
net worth of a homeowner was about $300,000 while that          order to explain the current racial disparities in the housing
of a renter’s was $8,000 in 2021. The net worth of a typical    market. Finally, using the Profile of Home Buyers and Sellers data
homeowner is about 40 times the net worth of a renter. In       from 2021, the report looks at the characteristics of who
addition to tangible financial benefits, homeownership          purchases homes, why they purchase, what they purchase, and
brings substantial social benefits for families, communities,   the financial background for buyers based on race.
and the country as a whole.                                                                                              5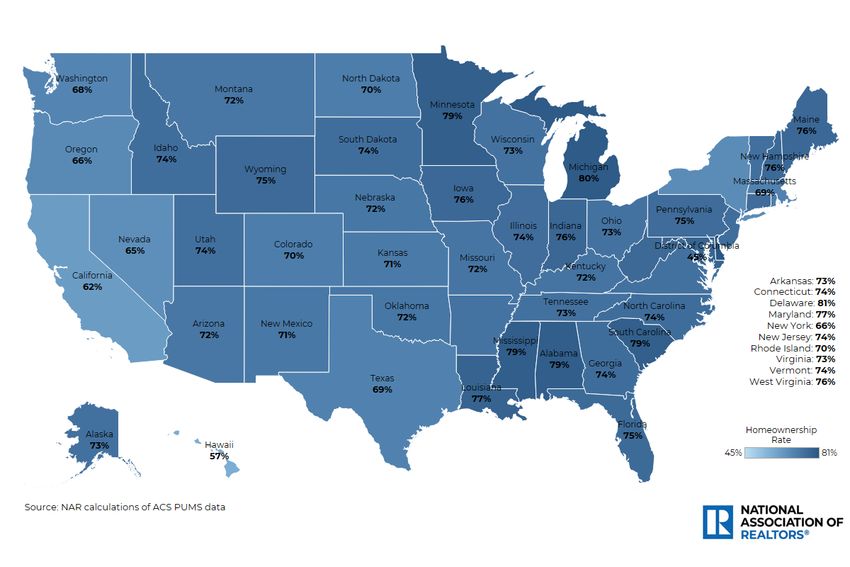
Homeownership trends in the pact decade

Americans today are more likely to own a home than 10 years ago. There are about 6.5 million more
homeowners than in 2010. Specifically, the homeownership rate was 65.5% in 2020 compared to 65.4% in
2010. In fact, the homeownership rate has continuously risen since 2015, when homeownership reached its
lowest level in the history of the data. However, during the first year of the pandemic, the homeownership
rate rose even faster due to low mortgage rates. Within a year, the homeownership rate increased by 1.3%, its
fastest growth ever. This translates to nearly 2.6 million households that were able to become homeowners
across the country in 2020.

 However, the overall homeownership rate does not tell the full story. Homeownership rate for Black
 Americans is still lower than in 2010, the group most affected by declines in homeownership rates before,
 during, and after the Great Recession.

                                                                                                                6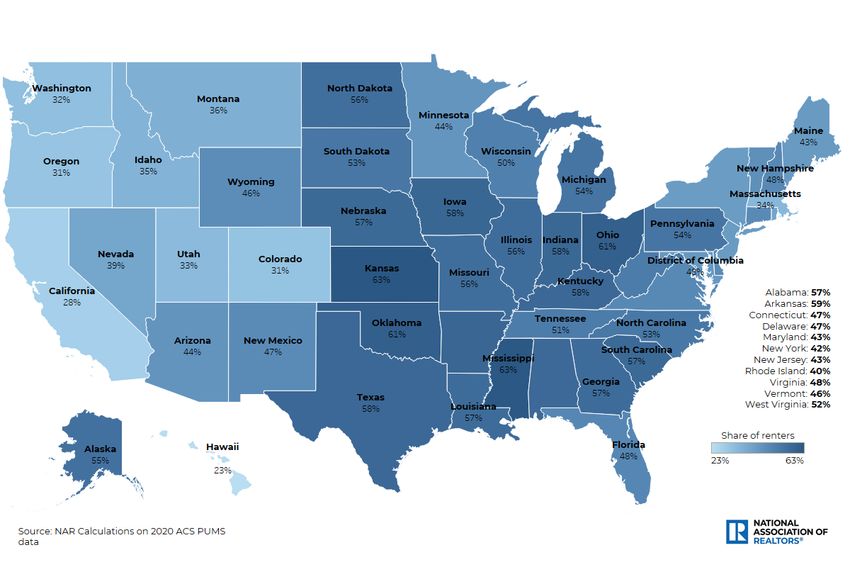
Homeownership trends in the last decade
by race
The homeownership rate for White
Americans has been consistently nearly 70%
since 2017. During the same period, the
homeownership rate for Black Americans
has been nearly 30 percentage points lower
than that of White Americans – above 41%
from 2017 on. For Hispanic Americans, the
homeownership rate has held above 47%,
and for Asian Americans it has been above
59% over the same time period.

In 2020, White and Hispanic Americans
experienced the largest homeownership
gains. The homeownership rate for Hispanic
Americans rose by 3 percentage points
within a year, pushing the rate above 51%, its
highest level in the history. Although the
homeownership rate for Black households
rose by 1.4 percentage points, it’s still lower
than in 2010. In fact, this is the only
race/ethnic group whose homeownership
rate is lower than 10 years ago. As a result,
the homeownership gap between White
and Black households became even larger in
2020.
                                                  7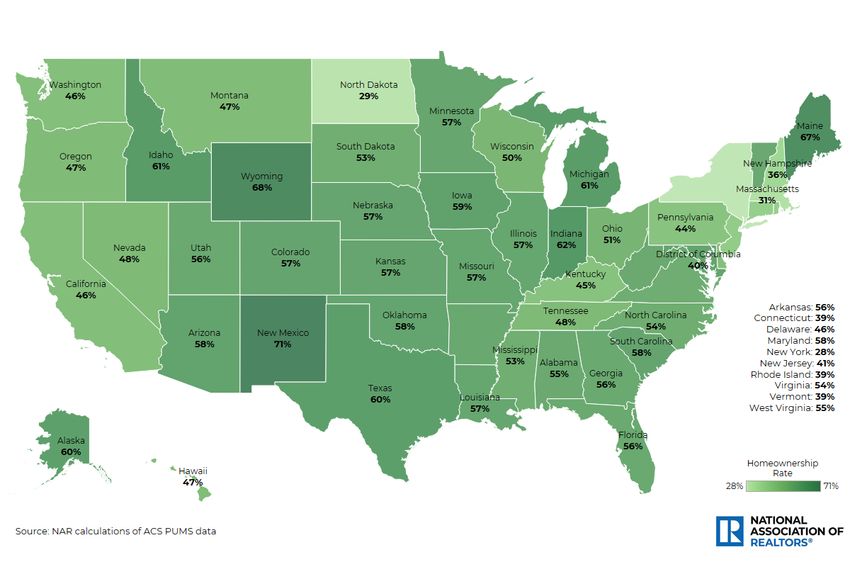
Homeownership rate for White Americans
by state
                                         Delaware (81%), Michigan (80%)
                                         and Mississippi (79%) were the
                                         states with the highest
                                         homeownership rates for White
                                         Americans in 2020.

                                         In contrast, the District of
                                         Columbia (45%), Hawaii (57%)
                                         and California (62%) had the
                                         lowest homeownership rates.

                                         The homeownership rate for
                                         White Americans varied from
                                         45% to 81% across the country.
                                         Among 51 states including the
                                         District of Columbia, 33 states
                                         had a homeownership rate for
                                         White Americans higher than
                                         72.1% – the national rate - in
                                         2020.

                                                                8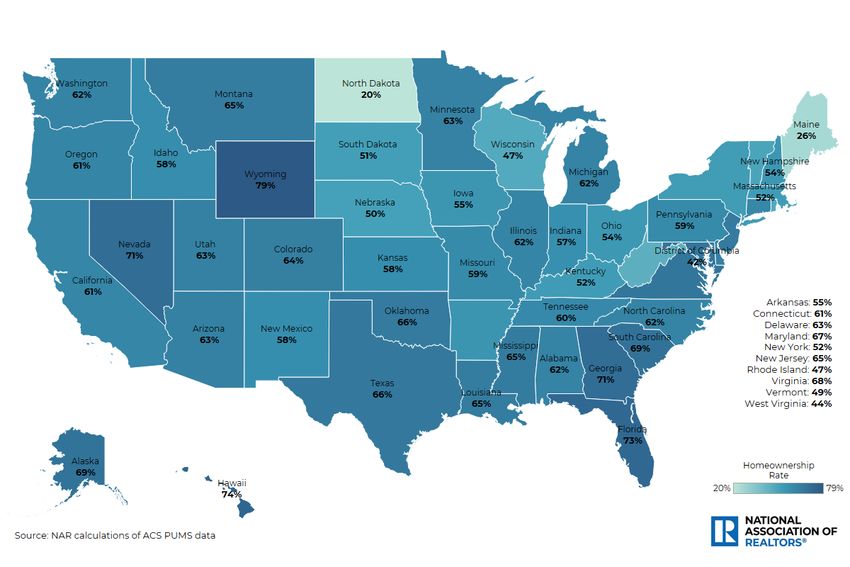
Homeownership rate for Black Americans
by state

                                         Mississippi (56%), South
                                         Carolina (56%) and Alabama
                                         (52%) were the states with the
                                         highest homeownership
                                         rates for Black Americans in
                                         2020.

                                         In contrast, North Dakota (9%),
                                         South Dakota (13%) and
                                         Montana (16%) had the lowest
                                         homeownership rates.

                                         The homeownership rate for
                                         Black Americans varied from
                                         9% to 56% across the country.
                                         Among 51 states including the
                                         District of Columbia, 13 states
                                         had a homeownership rate for
                                         Black Americans higher than
                                         43.4% - the national rate- in
                                         2020.

                                                                9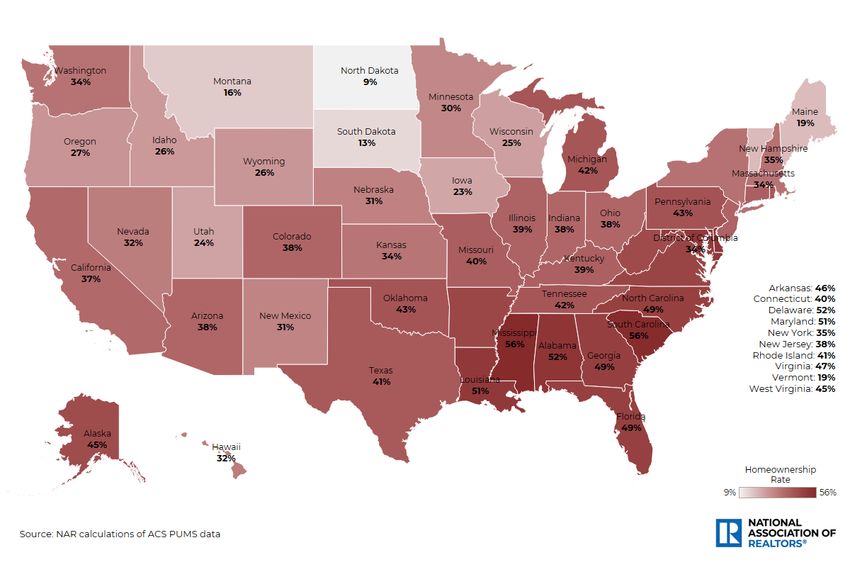
Homeownership rate for Asian Americans
by state

                                         Wyoming (79%), Hawaii (74%) and
                                         Florida (73%) were the states with
                                         the highest homeownership
                                         rates for Asian Americans in 2020.

                                         In contrast, North Dakota (20%),
                                         Maine (26%) and the District of
                                         Columbia (42%) had the lowest
                                         homeownership rates.

                                         The homeownership rate for Asian
                                         Americans varied from 20% to 79%
                                         across the country. Among 51
                                         states including the District of
                                         Columbia, 24 states had a
                                         homeownership rate for Asian
                                         Americans higher than 61.7% - the
                                         national rate- in 2020.

                                                                 10
Homeownership rate for Hispanic Americans
By state
New Mexico (71%), Wyoming (68%)
and Maine (67%) were the states
with the highest homeownership
rates for Hispanic Americans in
2020.
In contrast, New York (28%), North
Dakota (29%) and Massachusetts
(31%) had the lowest
homeownership rates.
The homeownership rate for
Hispanic Americans varied from
28% to 71% across the country.
Among 51 states including the
District of Columbia, 31 states had
a homeownership rate for
Hispanic Americans higher than
51.1% - the national rate- in 2020.
11Racial Disparities in the Mortgage Market
Denial Rates
Although mortgage rates dropped below 3% in 2020, not At the local level, in the states with high concentration of Black
everyone had the same opportunities to get a home loan households, the denial rate is disproportionately high for Black
and benefit from these low rates. Data shows that Black and homeowners and buyers. Low income seems to be the main
Hispanic home buyers face extra challenges in getting a reason that more Black households were denied mortgages in
mortgage. Denial rates vary significantly by race/ethnic these areas. Specifically, in the top 10 states with the highest
group with Black Americans having the highest denial rates denial rates, the median income of Black applicants was
for purchase and refinance loans. According to NAR’s Profile $62,990 on average. For instance, the median income for Black
of Home Buyers and Sellers report, 7% of Black and Hispanic households was $51,760 in Mississippi, which was the state with
home buyers were denied mortgages, compared with the highest denial rates across the country. Nevertheless, as the
about 4% of White and 3% of Asian applicants. While the income increases, the denial rates drop. In the top 10 states with
main reason the mortgage lender rejected their application the lowest denial rates for Black households, the median
is the debt-to-income ratio, Black and Hispanic home income of those applicants was $81,440. For example, the
buyers reported that they also had a low credit score. income of Black households that applied for a mortgage was
$102,830 in Hawaii, the state with the lowest denial rates for
Parsing out by the purpose of loan, denial rates for Black Black households.
Americans are even higher for home purchase loans.
According to Home Mortgage Disclosure Act (HMDA), nearly
27% of the loan applications for a home purchase were
denied compared to 20% which is the denial rate for
refinancing. These racial disparities in the mortgage market
contribute to the persistent homeownership gap between
White and Black households. Purchasing a home is one of
the largest financial transactions with 87% of the home
buyers getting a mortgage.
12Denial Rates for White households
By state
New York (18%), Florida (18%) and
West Virginia (18%) were the
states with the highest denial
rates for White Americans in
2020.
In contrast, North Dakota (8%),
South Dakota (8%) and the District
of Columbia (9%) had the lowest
denial rates.
Denial rates for White Americans
varied from 8% to 21% across the
country. Among 51 states
including the District of Columbia,
22 states had a denial rate for
White Americans higher than 13%
- the national rate- in 2020.
13Denial Rates for Black households
By state
14Affordability by race
During the pandemic, demand far surpassed supply across households in proportion to their income distribution. For
the nation and home prices continued to increase, eroding example, a household in the 40th percentile of income should
affordability. Specifically, since 2019, home prices rose nearly afford to buy 40% of the homes currently listed for sale. Thus, a
30 percent. As a result, a typical home is about $80,000 more score of 1 suggests a market in which the availability of homes
expensive than pre-pandemic. Wages may have also for sale roughly matches the population’s ability to afford
increased but not anywhere near the pace of the home homes. A score of 2 means that all households can afford all of
prices. This means that potential buyers need to spend more the homes that are currently on the market. Finally, a score of 0
of their budget on housing in order to buy the typical home shows that there is no household in that specific income group
now compared to 2019. Meanwhile, the inventory of homes that can afford any of the homes that are currently on the
for sale has dropped significantly in the last couple of years, market. Thus, to put it simply, higher scores suggest better
reaching record lows in 2021. In fact, there was a housing affordability conditions.
shortage even before the pandemic hit in 2020. There are
currently only around 1 million units available for sale Nationwide, housing is more affordable for Asian Americans
compared to near 4 million homes available for sale in 2007. among all other races as nearly 50% of them earn more than
This translates to fewer options for home buyers leading to $100,000. In contrast, 35% of White, 25% of Hispanic and only
multiple offers and competition in the housing market. 20% of Black Americans have an income higher than $100,000.
As a result, the score for White Americans is 0.86; 0.60 for Black
So, “two troubles” are happening simultaneously: record high Americans; 0.70 for Hispanic Americans and 1.03 for Asian
home prices and record low inventory. NAR Research and Americans. This means that Asian Americans can afford a
Realtor.com® partnered to do an analysis to estimate how greater share of houses on the market than their income
these “two troubles” affect home buyers. percentile. For instance, 51% of homes currently listed for sale
are affordable to households with at least $100,000 income. For
To do so, we created a score for each of the race groups that Asian Americans, 48% earn more than $100,000 and can afford
compares the share of households with the share of active these homes, but for Black Americans, only 20% have the same
listings that they can afford to buy in each income group. In level of affordability.
balanced conditions, homes on the market are affordable to
15Affordability for Black households
Since all real estate is local, these racial variations in For example, in North Dakota, the affordability score for
affordability are even larger in some areas. Indeed, in White households is 1.10 compared to 0.68 for Black
households. Respectively, in South Carolina, the
North Dakota, South Carolina and Massachusetts White
affordability score for White households is 0.97 compared
households are nearly twice as likely to afford to buy to 0.59 for Black households.
compared to Black households.
Maryland (0.93), West Virginia
(0.92) and Kansas (0.88) were the
most affordable states for Black
Americans.
In contrast, Utah (0.39), Oregon
(0.42) and California (0.43) were
the least affordable states.
The affordability Score for Black
Americans varied from 0.39 to 0.93
across the country.
16Most affordable metro areas for Black households
The study also identified the most affordable areas by race. For Here is the list of the top 10 most affordable
instance, Akron, OH was the most affordable area for Black areas for Black households. In these areas below,
households with a score of 0.93. Specifically, 77% of Black Black households can afford to buy homes
roughly in proportion to their income distribution.
households earn less than $75,000 while they can afford to buy
72% of the active listings in Akron, OH.
1. Akron, OH
Score: 0.9
2. Youngstown, OH-PA
Score: 0.9
3. McAllen, TX
Score: 0.9
4. Baltimore, MD
Score: 0.9
5. Memphis, TN-MS-AR
Score: 0.8
6. Toledo, OH
Score: 0.8
7. Dayton, OH
Score: 0.8
8. Birmingham, AL
Score: 0.8
9. Detroit, MI
Score: 0.8
10. St. Louis, MO-IL
Score: 0.8
17Renter households
Data shows that Black renter households are more At local level, Black renter households are even more
squeezed than any other race/ethnic group. One in two cost burdened in some areas. For example, in Idaho,
Black renter households spend more than 30% of their 54% of the Black renter households spend more than
income on rent. And, about 28% of the Black renter 50% of their income on rent; 38% in Hawaii; and 37% in
households spend more than 50% of their income on rent, West Virginia. In contrast, 9% of the Black renter
representing nearly 2.3 million households. In contrast, 21% households in Alaska spend more than 50% of their
of White renter households are severely cost burdened, income on rent; 11% in New Hampshire; and 12% in
spending over 50% of their income on rent. This translates to Vermont.
about 4.9 million white renter households.
After comparing the qualifying income to purchase the
The main reason that Black renter households are more cost typical home by state with the median income of
burdened is that although they have a lower income (30% renter households, the National Association of
lower) than White renters, their monthly rent isn’t REALTORS® was able to estimate how many of these
significantly lower than that of White renters. In 2020, the renters can afford to buy the typical home. It’s
median income of Black renter households was $31,700, interesting to see that while nearly 50% of the White
compared to $45,200 for white renter households. In the renter households can afford to buy the typical home
meantime, the average monthly rent was $1,010 for White only 36% of the Black renter households can do,
compared to $830 for Black renter households. While rental nationwide. Thus, the homeownership gap between
cost is expected to rise even further in 2022, it will be more White and Black households will continue to persist
difficult for Black renter households to save for down unless more entry-level homes will enter the market.
payment for a home purchase.
18White renter households that can afford to buy the typical home
by state
Kansas (63%), Mississippi (63%)
and Oklahoma (61%) were the
areas with the most White renter
households that they can afford
to buy the typical home in these
areas.
In contrast, Hawaii (23%),
California (28%) and Oregon (31%)
were the areas with the least
White renter households that
they can afford to buy the
typical home.
The share of White renters varied
from 23% to 63% across the
country. Among 51 states
including the District of Columbia,
30 states had more White renter
households that can afford to buy
the typical home compared to
nationwide – 47% in 2020.
.
19Black renter households that can afford to buy the typical home
by state
South Dakota (69%), Alaska (64%)
and Vermont (60%) were the areas
with the most Black renter
households that they can afford
to buy the typical home in these
areas.
In contrast, the District of
Columbia (7%), Montana (9%) and
Hawaii (13%) were the areas with
the least Black renter
households that they can afford
to buy the typical home.
The share of Black renters varied
from 7% to 69% across the
country. Among 51 states
including the District of Columbia,
28 states had more Black renter
households that can afford to buy
the typical home compared to
nationwide – 36% in 2020.
.
20Methodology: Section One
Using the ACS Public Microdata Sample (PUMS) data, NAR was able to compute
homeownership rates and affordability by race at the state level. The American
Community Survey releases the Public Use Microdata Sample (PUMS) files every year,
which include population and housing unit records with individual response information.
Regarding renters’ affordability, qualifying income for a 30-year fixed rate mortgage
was computed assuming a 10% down payment. Monthly principal and interest was
limited to 25% of income. After defining the qualifying income for each state, NAR
calculated the percent of renter households for each race/ethnicity that have an
income higher than the qualifying income for that specific area.
Using the Home Mortgage Disclosure Act (HMDA) data, NAR computed the denial rates
by race in 2020. To calculate mortgage denial rates, NAR divided all denied loans by
total loan applications for each race/ethnic group.
21Home Buyer
Demographics
from the 2021 Profile
of Home Buyers
and Sellers
22Home Buyer Demographics by Race/Ethnicity
Using data from the 2021 Profile of Home Buyers and Sellers report Family continue to help buyers enter the home buying market.
we can look at the characteristics of recent home buyers, their Twenty-one percent of Asian/Pacific Islanders, and 11% of
reasons for purchasing, the steps they took in the home buying Hispanic/Latino, buyers used a gift from relative or friend
process, and the ways buyers financed their home purchase based towards their down payment for their home. Another way to help
on race. family is living at home before buying. Twenty-two percent of
Among all home buyers, White/Caucasian home buyers made up White/Caucasian, 21% of Hispanic/Latino, and 20% of
the largest share at 82%, followed by Hispanic/Latino (7%), Asian/Pacific Islander first-time home buyers lived with parents,
Asian/Pacific Islander (6%) and Black/African-American home buyers relatives, or friends prior to purchasing their home compared to
(6%), and Other at 2%. only 15% of Black/African-American first-time home buyers .
Among Asian/Pacific Islander home buyers, we see the largest share Black/African-American home buyers reported the highest
of married couples at 70%. Single female home buyers were most
share of student loan debt at 41%, with a median amount of
common among Black/African-American home buyers (33%). Fifty-six
percent of Asian/Pacific Islanders, and 49% of Black/African American $45,000. Hispanic/Latino home buyers reported a median
buyers were first-time home buyers. While the majority of all buyers student loan debt amount at $35,500, with 26% saying they had
had two-income households, the highest share of one-income student loan debt. Asian/Pacific Islander buyers had the highest
households were found among Black/African American households share of buyers with at least some college education.
at 40%, and White/Caucasian households at 39%.
Seven percent of Black/African-American and Hispanic/Latino
Nineteen percent of Hispanic/Latinos, and 18% of Asian/Pacific home buyers, have had a mortgage application denied,
Islanders and Black/African-Americans purchased multi-
compared with just 4% of White/Caucasian and 3% of
generational homes. Among those groups, they primarily
purchased a multi-generational home to spend more time with Asian/Pacific Islander buyers. While the main reason for
aging parents, health/caretaking of aging parents/relatives, wanting Asian/Pacific Islander, Hispanic/Latino, and White/Caucasian
a larger home that multiple incomes could afford together, and cost buyers for being rejected by a mortgage lender was their debt-
savings. The share of multi-generational buyers was 10% among to-income ratio, the main reason for Black/African-American,
White/Caucasian buyers. buyers was due to low credit score.
23Quick Look: Home Buyer Finances
Median Household Income & Median Home Price
3 Sources of Down Payment
Income earners per household
Three
One Two or more
Asian/Pacific Islander 34% 54% 11%
White/Caucasian 39% 53% 7%
Hispanic/Latino 34% 58% 8%
Black/African-American 40% 48% 12%
24Race/Ethnicity of Home Buyers
All Buyers
White/Caucasian 82%
Hispanic/Latino 7
Asian/Pacific Islander 6
Black/African-American 6
Other 2
Note: Respondents were permitted to select as many races and ethnicities as they felt applicable.
The percentage distribution may therefore sum to more than 100 percent.
Source: 2021 Profile of Home Buyers and Sellers
25Household Composition by Race/Ethnicity
Racial and Ethnic Distribution
Black/African- Asian/Pacific
Hispanic/Latino White/Caucasian
American Islander
Married couple 51% 70% 63% 60%
Single female 33 10 19 19
Single male 10 9 6 9
Unmarried couple 5 8 9 10
Other 1 3 3 2
Source: 2021 Profile of Home Buyers and Sellers
26Buyer Demographics by Race/Ethnicity
Racial and Ethnic Distribution
Black/African- Asian/Pacific
Hispanic/Latino White/Caucasian
American Islander
First-time buyers 49% 56% 47% 31%
Repeat buyers 51 44 53 69
Median age 44 40 41 46
Median household income $82,300 $120,600 $96,700 $101,900
Income earners in household
None * 1 * *
One 40 34 34 39
Two 48 54 58 53
Three or more 12 11 8 8
* Less than 1 percent
Source: 2021 Profile of Home Buyers and Sellers
27Home Characteristics Purchased by Race/Ethnicity
Racial and Ethnic Distribution
Black/African-
Asian/Pacific Islander Hispanic/Latino White/Caucasian
American
Purchased new home 25% 22% 19% 14%
Purchased previously owned
75 78 81 86
home
Detached single-family 80% 81% 81% 83%
Townhouse/row house 11 13 9 6
Duplex/apartment/condo 4 3 3 5
Other 4 3 7 6
Median square feet of home
1,960 2,060 1,800 1,900
purchased
Median home price $268,800 $459,100 $315,000 $300,000
Source: 2021 Profile of Home Buyers and Sellers
28Purchased Through Real Estate Agent/Broker, and Reasons For Purchase by
Race/Ethnicity
Racial and Ethnic Distribution
Black/African-
Asian/Pacific Islander Hispanic/Latino White/Caucasian
American
Purchased through a real estate
88% 88% 88% 89%
agent or broker
Primary reason for purchasing a
home
Desire to own home of own 48% 41% 42% 25%
Desire for larger home 10 14 11 11
Desire for a home in a better area 5 7 5 7
Change in family situation (e.g.
marriage, birth of child, divorce, 5 5 6 7
etc.)
Job-related relocation or move 4 5 3 6
Desire to be closer to
4 3 8 11
family/friends/relatives
Desire to be closer to
1 3 1 2
job/school/transit
Source: 2021 Profile of Home Buyers and Sellers
29Purchased Multi-Generational Home by Race/Ethnicity
Racial and Ethnic Distribution
Black/African- Asian/Pacific
Hispanic/Latino White/Caucasian
American Islander
Multi-generational
18% 18% 19% 10%
household
Reasons for purchase
Health/caretaking
29 38 26 29
of aging parents/relatives
To spend more time
25 27 24 12
with aging parents
Cost savings 17 33 27 13
Children/relatives over
18 moving back into the 11 13 15 17
house
Wanted a larger home
that multiple incomes 10 21 12 8
could afford together
Children/relatives over
6 13 8 16
18 never left home
None of the above 39 13 16 25
Other 8 5 8 11
Source: 2021 Profile of Home Buyers and Sellers
30Sources of Down Payment by
Race/Ethnicity
Racial and Ethnic Distribution
Black/African- Asian/Pacific
Hispanic/Latino White/Caucasian
American Islander
Savings 58% 79% 60% 55%
Proceeds from sale of primary
21 16 25 38
residence
401k/pension fund including a
14 10 12 6
loan
Gift from relative or friend 10 21 11 10
Tax refund 6 6 6 3
Loan from relative or friend 3 4 1 2
Sale of stocks or bonds 3 17 6 8
Source: 2021 Profile of Home Buyers and Sellers
31Prior Living Arrangement by Race/Ethnicity
Racial and Ethnic Distribution
Black/Africa
Asian/Pacific Islander Hispanic/Latino White/Caucasian
n-
American
All buyers previous living arrangement
Rented an apartment or house 58% 50% 46% 34%
Owned previous home 29 34 37 54
Lived with parents/relatives/friends,
did not pay rent 7 7 9 5
Lived with
5 8 6 5
parents/relatives/friends, paid rent
Rented the home ultimately
1 1 2 1
purchased
First-time buyers previous living
arrangement
Rented an apartment or house 82% 75% 74% 72%
Lived with parents/relatives/friends,
did not pay rent 9 10 13 11
Lived with
6 10 8 11
parents/relatives/friends, paid rent
Owned previous home 2 3 2 4
Rented the home ultimately
1 1 2 2
purchased
Source: 2021 Profile of Home Buyers and Sellers
32Education Level of Household Head and Student Debt by Race/Ethnicity
Racial and Ethnic Distribution
Black/African- Asian/Pacific
Hispanic/Latino White/Caucasian
American Islander
Less than high school * * 3% *
High School diploma 15 6 19 16
Associates degree 15 5 16 13
Bachelor's degree 28 39 26 31
Some graduate work 8 6 3 7
Master's degree/MBA/law
30 30 26 27
degree
Doctoral degree 4 13 6 7
Have student loan debt 41% 18% 26% 22%
Median student loan debt
$45,000 $24,400 $35,500 $30,000
amount
* Less than 1 percent Source: 2021 Profile of Home Buyers and Sellers
33Buyer Mortgage Application Had Been Rejected From Mortgage Lender
by Race/Ethnicity
Racial and Ethnic Distribution
Black/African-
Asian/Pacific Islander Hispanic/Latino White/Caucasian
American
Have had application denied 7% 3% 7% 4%
Median number of times
2 1 1 1
application was denied
Reason for being rejected by
mortgage lender
Debt-to-income ratio 32% 40% 44% 33%
Low credit score 43 10 33 18
Income was unable to be verified * 33 4 12
Not enough money in reserves 14 * 15 7
Insufficient down payment 9 * 11 8
Too soon after refinancing another
* * * 1
property
Don't know 14 * 11 6
Other 14 20 26 42
* Less than 1 percent Source: 2021 Profile of Home Buyers and Sellers
34Home Buyers and
Fair Housing
35Home Buyers and Fair Housing
In addition to being asked about their recent home buying When recent home buyers were asked whether they
experience, recent home buyers were also asked if they had experienced discrimination in a real estate transaction, 7%
experienced or witnessed discrimination during their real
estate transaction. When asked about their neighborhood and of Black/African-American, 6% of Hispanic/Latino, and 4% of
whether or not the majority of residents are the same race as Asian/Pacific Islander home buyers experienced
them, 74% of Asian/Pacific Islander, 69% of Black/African- discrimination based on race. Three percent of
American, and 55% of Hispanic/Latino home buyers said that Black/African-American, and 2% of Asian/Pacific Islander
the majority of their neighborhood is not the same race as
them. This is compared to only 16% of White/Caucasian home and Hispanic/Latino home buyers experienced
buyers saying that the majority of their neighborhood is not the discrimination based on color. Thirty-nine percent of
same race as them. Sixty-nine percent of White/Caucasian Black/African-American, 38% of Asian/Pacific Islander, 36%
home buyers said that the majority of the neighborhood was of Hispanic/Latino, and 28% of White/Caucasian home
the same race as them. In comparison, 26% of Hispanic/Latino,
17% of Black/African-American, and 15% of Asian/Pacific buyers did not experience discrimination in their real estate
Islander home buyers said that the majority of their transaction but believe that it exists. Seven percent of
neighborhood was the same race as them. Black/African-American, and 1% of White/Caucasian home
buyers reported the discrimination against them to a
Looking at ways recent home buyers witnessed or experienced government agency.
discrimination in a real estate transaction, the most common
discrimination was steering towards or away from specific
neighborhoods with 50% of Hispanic/Latino, 48% of
Asian/Pacific Islander, and 46% of Black/African- American
home buyers having experienced this. Black/African- American
and Asian/Pacific Islander home buyers were more likely to
report witnessing or experiencing discrimination with more
strict requirements for themselves, the type of loan product
offered. Asian/Pacific Islander home buyers were the most likely
to report purchase offers being denied for possibly
discriminatory reasons, and to witness or experience
discrimination based on a home appraisal.
36Neighborhood Residents and Discrimination in Transactions by Race/Ethnicity
Racial and Ethnic Distribution
Black/African-
Asian/Pacific Islander Hispanic/Latino White/Caucasian
American
The majority of residents in your
neighborhood are the same race as you
Yes, majority are same race 17% 15% 26% 69%
No, majority are not same race 69 74 55 16
Don’t know 14 10 20 15
Ways you witnessed or experienced
discrimination in a real estate transaction
Steering towards or away from specific
46% 48% 50% 35%
neighborhoods
More strict requirements for myself 32 4 16 19
Type of loan product offered 32 13 23 32
Purchase offer denied for possibly
19 39 26 17
discriminatory reasons
Refusal of home owner or agent to show
13 17 6 4
property to particular classes
Appraisal of home 5 9 6 6
Other 8 17 23 26
Source: 2021 Profile of Home Buyers and Sellers
37Discrimination in Home Search and Reporting Discrimination by Race/Ethnicity
Racial and Ethnic Distribution
Black/African-
Asian/Pacific Islander Hispanic/Latino White/Caucasian
American
Experienced discrimination in a real
estate transaction against any of the
following
Race 7% 4% 6% *
Color 3 2 2 *
Religion 1 * * *
Sex 2 1 1 *
Disability * * 1 *
Familial status (including marriage or
* * 1 *
parental status)
National Origin * 1 1 *
Sexual orientation 1 1 1 *
Not sure 7 4 3 1
No, but I believe it exists 39 38 36 28
No 46 53 54 70
Reported the discrimination to a
government agency
Yes, reported 7% * * 1%
No, did not report 93 100 100 99
* Less than 1 percent Source: 2021 Profile of Home Buyers and Sellers
38Methodology: Section Two and Three
In July 2021, NAR mailed out a 129-question survey using a random sample weighted to be representative of sales on
a geographic basis to 129,800 recent home buyers. The recent home buyers had to have purchased a primary
residence home between July of 2020 and June of 2021. A total 5,795 responses were received from primary
residence buyers. After accounting for undeliverable questionnaires, the survey had an adjusted response rate of 4.5
percent.
Respondents had the option to fill out the survey via hard copy or online. The online survey was available in English
and Spanish.
Consumer names and addresses were obtained from Experian, a firm that maintains an extensive database of recent
home buyers derived from county records. Information about sellers comes from those buyers who also sold a home.
All information in this Profile is characteristic of the 12-month period ending June 2021, with the exception of income
data, which are reported for 2020. In some sections comparisons are also given for results obtained in previous
surveys. Not all results are directly comparable due to changes in questionnaire design and sample size. Some results
are presented for the four U.S. Census regions: Northeast, Midwest, South, and West. The median is the primary
statistical measure used throughout this report. Due to rounding and omissions for space, percentage distributions
may not add to 100 percent.
Data gathered in the report is based on primary residence home buyers. From the Realtors Confidence Index, 85
percent of home buyers were primary residence buyers in 2020, which accounts for 5,502,900 homes sold in 2020
(accounting for new and existing homes). Using that calculation, the sample at the 95 percent confidence level has a
confidence interval of plus-or-minus 1.29%.
39The National Association of REALTORS® is America’s largest trade association, representing more than 1.5 million members, including NAR’s institutes, societies and councils, involved in all aspects of the real estate industry. NAR membership includes brokers, salespeople, property managers, appraisers, counselors and others engaged in both residential and commercial real estate. The term REALTOR® is a registered collective membership mark that identifies a real estate professional who is a member of the National Association of REALTORS® and subscribes to its strict Code of Ethics. Working for America’s property owners, the National Association provides a facility for professional development, research and exchange of information among its members and to the public and government for the purpose of preserving the free enterprise system and the right to own real property. NATIONAL ASSOCIATION OF REALTORS® RESEARCH GROUP The Mission of the NATIONAL ASSOCIATION OF REALTORS® Research Group is to produce timely, data-driven market analysis and authoritative business intelligence to serve members, and inform consumers, policymakers and the media in a professional and accessible manner. To find out about other products from NAR’s Research Group, visit nar.realtor/research-and-statistics NATIONAL ASSOCIATION OF REALTORS® Research Group 500 New Jersey Avenue, NW Washington, DC 20001 202-383-1000 data@nar.realtor 2022 Snapshot of Race and Home Buying in America
You can also read