SOC Telemed / HCMC Analyst Day Presentation - SEPTEMBER 2020
←
→
Page content transcription
If your browser does not render page correctly, please read the page content below

SOC Telemed / HCMC
Analyst Day Presentation

                           SEPTEMBER 2020
Disclaimer
This presentation (together with oral statements made in connection herewith, this “Presentation”) contains selected information about Specialists On Call, Inc. (“SOC”) and Healthcare Merger Corp. (“HCMC”).
This Presentation is being made in respect of the proposed business combination between HCMC and SOC.
This Presentation shall not constitute an offer to sell or the solicitation of an offer to buy any securities, nor shall there be any sale of securities in any jurisdiction in which such offer, solicitation or sale would be
unlawful prior to registration or qualification under the securities laws of any such jurisdiction. No offering of securities shall be made except by means of a prospectus meeting the requirements of Section 10 of
the Securities Act of 1933, as amended (the “Act”).
Industry and Market Data. Information contained in this Presentation concerning SOC’s industry and the markets in which it operates, including SOC’s general expectations and market position, market
opportunity and market size, is based on information from SOC management’s estimates and research, as well as from industry and general publications and research, surveys and studies conducted by third
parties. In some cases, we may not expressly refer to the sources from which this information is derived. Management estimates are derived from industry and general publications and research, surveys and
studies conducted by third parties and SOC’s knowledge of its industry and assumptions based on such information and knowledge, which we believe to be reasonable. In addition, assumptions and estimates of
SOC’s and its industry’s future performance are necessarily subject to a high degree of uncertainty and risk due to a variety of factors. These and other factors could cause SOC’s future performance and actual
market growth, opportunity and size and the like to differ materially from our assumptions and estimates. No representation or warranty, express or implied, is or will be given by SOC, HCMC or any of their
affiliates, directors, officers, employees or advisers or any other person as to the accuracy or completeness of the information in this Presentation (including as to the accuracy or reasonableness of statements,
estimates, targets, projections, assumptions or judgments) or any other written, oral or other communications transmitted or otherwise made available to any party in the course of its evaluation of a possible
transaction. Accordingly, none of SOC, HCMC or any of their respective affiliates, directors, officers, employees or advisers or any other person shall be liable for any direct, indirect or consequential loss or
damages suffered by any person as a result of relying on any statement in or omission from this Presentation and any such liability is expressly disclaimed.
Trademarks. HCMC and SOC own or have rights to various trademarks, service marks and trade names that they use in connection with the operation of their respective businesses. This Presentation may also
contain trademarks, service marks, trade names and copyrights of third parties, which are the property of their respective owners. The use or display of third parties’ trademarks, service marks, trade names or
products in this Presentation is not intended to, and does not imply, a relationship with HCMC or SOC, or an endorsement or sponsorship by or of HCMC or SOC. Solely for convenience, the trademarks, service
marks, trade names and copyrights referred to in this Presentation may appear without the TM, SM, ® or © symbols, but such references are not intended to indicate, in any way, that HCMC or SOC will not
assert, to the fullest extent under applicable law, their rights or the right of the applicable licensor to these trademarks, service marks, trade names and copyrights.
Use of Projections. This Presentation contains projected financial information with respect to SOC, including revenue, net income, bookings, adjusted gross margin, operating expenses, Adjusted EBITDA,
Adjusted EBITDA Margin and Telemed IQ growth for 2020-2022. Such projected financial information constitutes forward-looking information and is for illustrative purposes only and should not be relied upon
as necessarily being indicative of future results. The assumptions and estimates underlying such projected financial information are inherently uncertain and are subject to a wide variety of significant business,
economic, competitive and other risks and uncertainties that could cause actual results to differ materially from those contained in the prospective financial information. See “Forward-Looking Statements”
below. Actual results may differ materially from the results contemplated by the projected financial information contained in this Presentation, and the inclusion of such information in this Presentation should
not be regarded as a representation by any person that the results reflected in such projections will be achieved. Neither of HCMC’s or SOC’s independent auditors have audited, reviewed, compiled, or
performed any procedures with respect to the projections for the purpose of their inclusion in this Presentation, and accordingly, neither of them expressed an opinion or provided any other form of assurance
with respect thereto for the purpose of this Presentation.
Use of Non-GAAP Financial Measures. The financial information and data contained in this Presentation is unaudited and does not conform to Regulation S-X promulgated under the Act. Accordingly, such
information and data may not be included in, may be adjusted in or may be presented differently in, any proxy statement to be filed by HCMC with the Securities and Exchange Commission (the “SEC”). Some of
the financial information and data contained in this Presentation, such as Adjusted EBITDA and Adjusted EBITDA Margin, have not been prepared in accordance with United States generally accepted accounting
principles (“GAAP”). HCMC and SOC believe these non-GAAP measures of financial results provide useful information to management and investors regarding certain financial and business trends relating to
SOC’s financial condition and results of operations. HCMC and SOC believe that the use of these non-GAAP financial measures provides an additional tool for investors to use in evaluating projected operating
results and trends. Other companies may calculate these non-GAAP financial measures differently, and therefore such financial measures may not be directly comparable to similarly titled measures of other
companies. Management does not consider these non-GAAP measures in isolation or as an alternative to financial measures determined in accordance with GAAP. The principal limitation of these non-GAAP
financial measures is that they exclude significant expenses and income that are required by GAAP to be recorded in SOC’s financial statements. In addition, they are subject to inherent limitations as they reflect
the exercise of judgments by management about which expense and income are excluded or included in determining these non-GAAP financial measures. In order to compensate for these limitations,
management presents non-GAAP financial measures in connection with GAAP results which are included in the Appendix of this Presentation.

                                                                                                                                                                                                                         2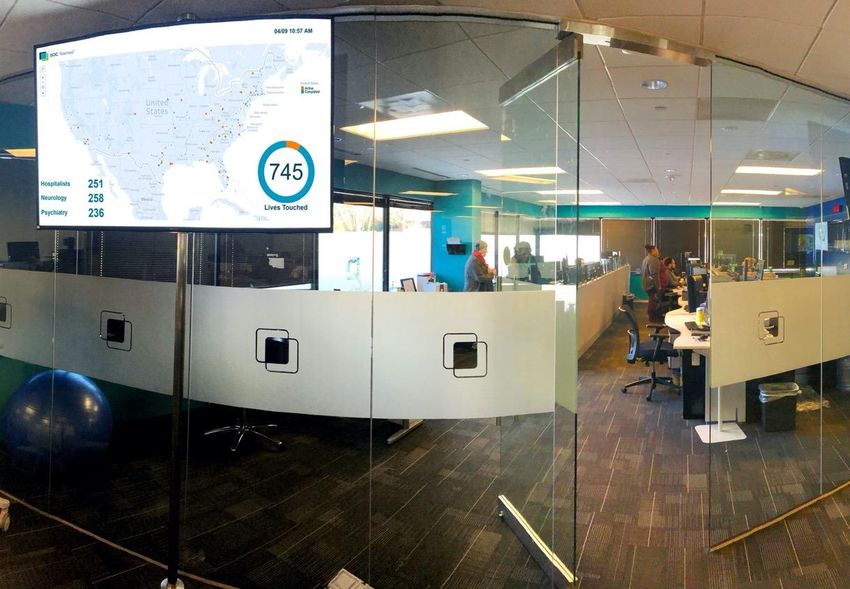
Disclaimer (Cont’d)
Additional Information; Participants in the Solicitation. A definitive agreement with respect to the proposed business combination between HCMC and SOC was signed on July 29, 2020. In connection with the
proposed business combination, HCMC has filed a registration statement on Form S-4, including a proxy statement/consent solicitation statement/prospectus (the “Registration Statement”), and other relevant
documents with the SEC. The Registration Statement includes a preliminary proxy statement to be distributed to HCMC’s stockholders in connection with HCMC’s solicitation of proxies for the vote by HCMC’s
stockholders with respect to the proposed business combination and other matters as described in the Registration Statement; a consent solicitation statement to be distributed to SOC’s stockholders in
connection with SOC’s solicitation of written consents to approve the proposed business combination; and a prospectus relating to the offer of the securities to be issued to SOC’s stockholders in connection
with the proposed business combination. After the Registration Statement has been declared effective by the SEC, HCMC will mail a definitive proxy statement/prospectus, when available, to its stockholders.
Stockholders and other interested persons are urged to read the proxy statement/consent solicitation statement/prospectus and any other relevant documents filed with the SEC when they become available
because they will contain important information about HCMC, SOC and the proposed business combination. Stockholders will be able to obtain a free copy of the preliminary proxy statement/consent
solicitation statement/prospectus and definitive proxy statement/consent solicitation statement/prospectus (when filed), as well as other filings containing information about HCMC, SOC and the proposed
business combination, without charge, at the SEC’s website located at www.sec.gov. HCMC and its directors and executive officers and other persons may be deemed to be participants in the solicitations of
proxies from HCMC’s stockholders in respect of the proposed business combination and the other matters set forth in the definitive proxy statement/consent solicitation statement/prospectus. Information
regarding HCMC’s directors and executive officers is available under the heading “Directors, Executive Officers and Corporate Governance” in its Annual Report on Form 10-K for the year ended December 31,
2019, filed with the SEC on March 25, 2020. Additional information regarding the participants in the proxy solicitation and a description of their direct and indirect interests, by security holdings or otherwise, will
be contained in the definitive proxy statement/consent solicitation statement/prospectus relating to the proposed business combination when it becomes available. This Presentation does not contain all the
information that should be considered in the proposed business combination. It is not intended to form any basis of any investment decision or any decision in respect to the proposed business combination.
The definitive proxy statement/prospectus will be mailed to HCMC’s stockholders as of a record date to be established for voting on the proposed business combination when it becomes available.
Forward Looking Statements. This Presentation includes “forward-looking statements” within the meaning of the “safe harbor” provisions of the United States Private Securities Litigation Reform Act of 1995.
Forward-looking statements may be identified by the use of words such as “estimate,” “plan,” “potential,” “predict,” “project,” “forecast,” “intend,” “may,” “should,” “would,” “will,” “expect,” “continue,”
“anticipate,” “believe,” “seek,” “target” or other similar expressions that predict or indicate future events or trends or that are not statements of historical matters. These forward-looking statements include,
but are not limited to, statements regarding estimates and forecasts of other financial and performance metrics and projections of market opportunity and market share. These statements are based on various
assumptions, whether or not identified in this Presentation, and on the current expectations of SOC’s and HCMC’s management and are not predictions of actual performance. These forward-looking statements
are provided for illustrative purposes only and are not intended to serve as, and must not be relied on by any investor as, a guarantee, an assurance, a prediction or a definitive statement of fact or probability.
Actual events and circumstances are difficult or impossible to predict and will differ from assumptions. Many actual events and circumstances are beyond the control of SOC and HCMC. These forward-looking
statements are subject to a number of risks and uncertainties, including changes in business, market, financial, political and legal conditions; the inability of the parties to successfully or timely consummate the
proposed business combination, including the risk that any required regulatory approvals are not obtained, are delayed or are subject to unanticipated conditions that could adversely affect the combined
company or the expected benefits of the proposed business combination or that the approval of the stockholders of HCMC or SOC is not obtained; failure to realize the anticipated benefits of the proposed
business combination; risks relating to the uncertainty of the projected financial information with respect to SOC; risks related to SOC’s business, adoption of its software platform and other matters; the effects
of competition on SOC’s future business; the amount of redemption requests made by HCMC’s public stockholders; the ability of HCMC or the combined company to issue equity or equity-linked securities in
connection with the proposed business combination or in the future, and those factors discussed in the Registration Statement under the heading “Risk Factors,” and other documents of HCMC filed, or to be
filed, with the SEC, as well as in any materials made available to you in connection with this Presentation. If any of these risks materialize or our assumptions prove incorrect, actual results could differ materially
from the results implied by these forward-looking statements. There may be additional risks that neither HCMC nor SOC presently know or that HCMC and SOC currently believe are immaterial that could also
cause actual results to differ from those contained in the forward-looking statements. In addition, forward-looking statements reflect HCMC’s and SOC’s expectations, plans or forecasts of future events and
views as of the date of this Presentation. HCMC and SOC anticipate that subsequent events and developments will cause HCMC’s and SOC’s assessments to change. However, while HCMC and SOC may elect to
update these forward-looking statements at some point in the future, HCMC and SOC specifically disclaim any obligation to do so. These forward-looking statements should not be relied upon as representing
HCMC’s and SOC’s assessments as of any date subsequent to the date of this Presentation. Accordingly, undue reliance should not be placed upon the forward-looking statements.
Neither SOC, HCMC, nor any of their respective affiliates have any obligation to update this Presentation unless required by applicable law. Although all information and opinions expressed in this Presentation
were obtained from sources believed to be reliable and in good faith, no representation or warranty, express or implied, is made as to its accuracy or completeness. This Presentation contains preliminary
information only, is subject to change at any time and is not, and should not be assumed to be, complete or to constitute all the information necessary to adequately make an informed decision regarding SOC
and HCMC. Recipients of this Presentation should each make their own evaluation of SOC and of the relevance and adequacy of the information and should make such other investigations as they deem
necessary.

                                                                                                                                                                                                                   3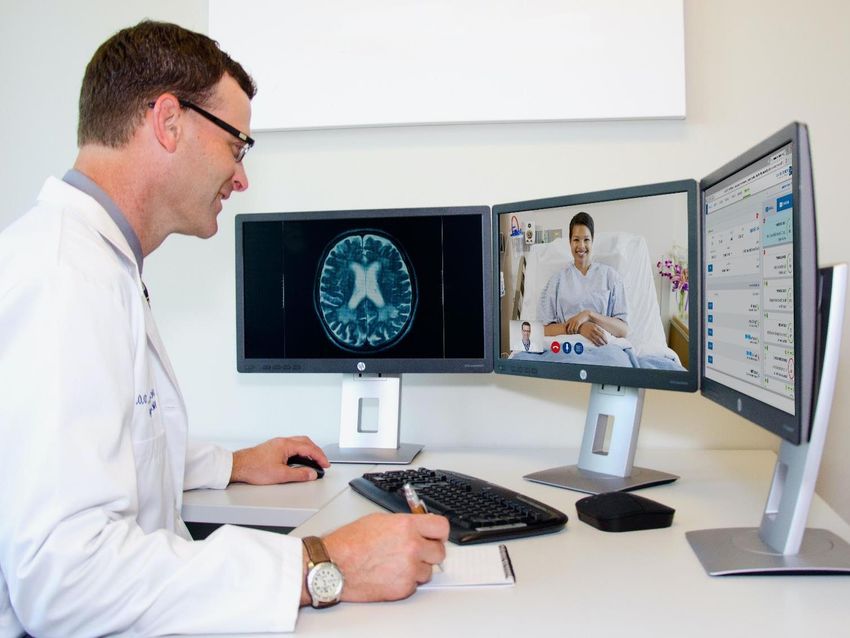
Today’s Agenda

                 1                       Steve Shulman
                     Introduction
                                         Chairman and CEO, HCMC

                 2   Company             Paul Ricci
                     Overview            Chairman and Interim CEO, SOC Telemed

                 3   Technology          Sean Banerjee
                     Overview            CTO, SOC Telemed

                 4   Market Overview &   John Kalix
                     Growth Strategy     President, SOC Telemed

                 5   Financial           Hai Tran
                     Overview            COO and CFO, SOC Telemed

                                                                                 4
Introduction

Investment Highlights

                        Compelling Market Opportunity

                        Scaled, Differentiated Acute Care Telemedicine Platform

                        Substantial Opportunities To Expand And Grow

                        Attractive Financial Profile

                                                                              6
Company Overview

SOC Telemed
At A Glance
ACUTE CARE MARKET FOCUS
Largest provider of acute teleNeurology and telePsychiatry 847 1 million+
Expanding service lines include critical care, emergency Facilities(1) Cumulative
Teleconsults
medicine, hospitalist medicine, cardiology
543 acute care hospitals and physician groups in 47 states
− 19 out of 25 of the largest U.S. health systems
− 2 of top 5 physician groups
Diversified, blue chip customer base $80m 100%
2021E Revenue Net Revenue
Retention(2)
CRITICAL MASS OF PHYSICIAN RESOURCES
172 board certified neurologists, psychiatrists and intensivists Implementations and Teleconsults
(Implementation count; cumulative teleconsult count in thousands)
10,500+ specialists through physician group partnerships (3)
1,200
953
(3)
698 300
CLOUD BASED TECHNOLOGY PLATFORM DESIGNED TO 533
402
MAXIMIZE CLINICAL EFFICIENCY 175
144
Flexible configuration mirrors workflow for any specialty 100 97
Real time data and analytics
2016 2017 2018 2019 2020E
Implementations Cumulative Teleconsults (4)
Note: Unless otherwise stated, all figures as of June 30, 2020; projections use SOC estimates. (3) Represents 2020E estimated implementations and cumulative teleconsults.
With respect to projections, see slide 2 “Use of Projections” under “Disclaimer”. (4) Combination of SOC, NeuroCall and JSA since inception. 8
(1) Facilities include 543 hospitals and other sites of care.
(2) Based on 2019 net revenue retention; excludes planned terminations.
SOC Telemed

Telemed IQ: Purpose-Built And Scaled
                                                       Standardized
                                          Supply &    consult request
                                           demand        process        Continuous technology
                                        forecasting                     updates
                     Integration with                                              Enterprise-wide
                    multiple EMRs &                                                analytics & reporting
                               PACs
   Consult coordination center                                                              Clinical
                                                                                            quality
             Clinician                                                                             Cohort
           scheduling                                                                              benchmarking

         Shared                                                                                            Standardized
       physician                                                                                           workflow design &
      resources                                                                                            optimization

                                                                                                             Clinician
                                                                                                             training

                                                                                                                          9
SOC Telemed
A Panel Of Coordination Experts
Patient Advocates
manage process from
patient intake to consult
summary delivery—24/7
Coordinators handle call
intake and patient
information
Dispatchers ensure
consult readiness and
physician assignment
10SOC Telemed
National Network Of Acute Care Specialists
Mix of employed and contracted physicians
− Employed physicians salaried with benefits
− Contracted physicians paid per scheduled shift hours with upside for additional consults on per
consult rate
Top Quality Specialist
Dedicated to Telemedicine Scaled and Fractionalized
Physicians
• Board certified • 94% retention(1) • 172 physicians within SOC
practice
• 17 years of average • 4 years of average tenure(2)
experience with SOC • 2,500+ state licenses
• teleNeurologists • Employed and contracted • 13,500+ hospital privileges
Over 20 sub-
• telePsychiatrists specialties
• teleIntensivists
Telemedicine solves growing pain of supply / demand mismatch by fractionalizing and empowering
scarce specialist resources
Note: Unless otherwise stated, all figures as of June 30, 2020.
(1) For employed physicians and excludes one planned termination. 11
(2) For employed and contracted physicians.SOC Telemed
Supports Complex Hospital Workflows
PATIENT / HOSPITAL HOSPITAL SOC COORDINATION TELECLINICAN
CENTER
Patient arrives Hospital Client-configurable teleClinician Telemed IQ
at hospital requests consult decision engine engages with sends consult
matches patient and / or note seamlessly
patient and clinician. care team and into patient medical
SOC queues, assigns, documents consult record in hospital EMR
& dispatches request
Robust reporting package provides actionable insights across every step
12SOC Telemed
Value Delivered
Connecting patients to high quality clinicians at the right time, regardless of proximity
ACCESS QUALITY CARE WHEN
AND WHERE IT’S NEEDED PROVIDE EFFICIENT,
PATIENTS
Access to scarce specialist resources
HIGH QUALITY CARE
AT LOWER COST
Early and rapid intervention
Increased revenue and / or profitability
Improved standardization / quality of care
Improved throughput
Reduced patient transfers/readmissions
EFFECTIVELY DEPLOY Standardized clinical protocols
CLINICAL CAPITAL
Improved patient care / quality
Match clinician supply to patient surges
Supports business continuity
PHYSICIAN HOSPITALS during crises
Increased productivity / profitability
GROUPS
Staffing model flexibility
13SOC Telemed
Clinical And Financial Benefits For Our Clients
TeleNeurology TelePsychiatry TeleICU
82% retention of stroke patients Avoided $1.7 million of annual 12% reduction in patient
after tPA administration boarding cost transfers led to $1.4 million
additional annual revenue
Previously 0% retention $3 million in incremental profits
Leapfrog Score D to A
227% ROI 281% ROI 170% ROI
With every stroke, time is of the Before, our psychiatrists were Our physicians enjoy working
essence. SOC has been a game burning out. We couldn’t keep with SOC’s providers. Even
changer... them on staff. SOC has been a though they may be 1,000 miles
lifesaver, especially for our night away, they’ve built that rapport
staff. And patients love it, they which is so important for
can get home faster... cultivating trust…
Dr. Michael Somers, MD, FACEP Nick Rosauer
Medical Director Behavioral Health Counsellor Chief Nursing Officer
14SOC Telemed
Well Positioned To Grow
TRANSFORMATIONAL
Create New
Markets,
Target New ● Retail specialist care ● Self testing / diagnostics ● Virtual referral management ● AI – triage, diagnosis,
Customer Needs support
ADJACENT
● Hospital at home
Enter SETTINGS OF CARE MARKETS CLINICAL SOLUTIONS
Adjacent ● Urgent Care ● Employers ● Oncology
● Post-acute ● Payors ● Infectious Disease
Markets ● Pediatric Hospitals ● Retail ● Nephrology
● Assisted Living ● Hospitality ● Maternal Fetal Medicine
● Dialysis and Infusion ● Schools / Universities ● Dermatology / Wound Care ● Medication adherence
● Palliative Care
● Geriatrics
CORE
PRODUCTS AND SERVICES ● Virtual care health plan
Existing CLINICAL SOLUTIONS SETTINGS OF CARE ● Asynchronous telemedicine
Markets and ● Neurology ● Hospitals ● Patient engagement /
Customers ● Psychiatry ● Health Systems navigation
● Intensive Care ● SNF ● Remote patient monitoring
● Freestanding EDs ● Digital triage ● Virtual clinical trials
● Intake, eligibility, payment
PRODUCTS AND ASSETS CHANNELS
● Telemed IQ Platform ● Physician Staffing
● SOC Specialists Companies INTERNATIONAL
● Revenue Cycle ● Government ● Precision medicine
● Hardware
Existing Products and Assets Incremental Products and Assets New Products and Assets
15SOC Telemed
Growth Strategy
Acquisitions
Accelerating SaaS
Platform Growth
Cross-Selling and
Upselling Existing
Clients
New Client Wins
16Technology Overview
Telemed IQ Platform Overview
Central Coordination Center
Hospital Staff Workflow Agent Workflow Physician Workflow
Customizable consult request Determine patient priority Robust phone application features
submission forms
Optimize physician coordination and Easy-to-use dashboard
Acuity and SLA determination assignment − On-demand consults and tasks
algorithms − Configurable physician − Support local facility operational /
recommendation engine clinical protocols
Capture data for KPIs − Rapidly increase physician supply
Real-time notifications of demand
during demand surges
Embeddable in hospital EMR surges and volunteering
− Minimize physician disruptions opportunities
with low-chatter communication
Single-click to video
Ensure consult readiness
Documentation templates:
Capture events for operational − Capture clinical quality data
analytics and insights − Optimize physician productivity
− Validate clinical / billing
compliance of documentation
18Broad Video Connection Capabilities and Real-Time
Integration With Partner Systems
Telemed IQ Video Capabilities Partner Systems
CAPABILITIES
• Device Agnostic – connect anywhere
• Far end camera control & zoom(1)
• One-click connect, no need for remembering UserID/Password
• Encrypted HIPAA-compliant connection
• Complete audit trail of connection activity
• Invite others: multi-person video capability
Patient / Clinician-Owned Facility-Owned Telemed IQ Carts Facility Owned Carts
Consumer Devices Consumer Devices T-7100 T-5100 (SIP or H.323 protocol based)
Telemed IQ establishes video sessions with dedicated telemedicine video Telemed IQ supports real-time service integration
endpoints as well as smartphones, tablets, and laptops with partner systems
(1) For supported cameras.
19Application Infrastructure And Security Controls
Modern Application Technology
.Net with MS SQL Server & IIS web servers
Angular JavaScript library for user interface
Single Page Application for browser-based thick-client like rich responsive
functionality
Web 2.0 Material Design user interface widgets
Responsive Web Design for support of different device screen & window sizes
Best-practice Application Development Methodology
Agile development with two-week sprints
Automated Code-Build-Test-Deploy cycle to reduce risk: Continuous Integration /
Continuous Deployment (CI/CD)
Infrastructure-as-Code (IaC) for automatic management and provision of the
technology stack for an application through software
High Availability Hosting AWS
High availability replicated infrastructure between multiple AWS availability zones
Automatic switch to the other zone on sensing heartbeat interruptions
Upgrades without any downtime
99.99% uptime over last 12 months
Corporate
Completely replicated regionally distributed data centers for phone, video, file
servers, Internet, networking with primary and backup configurations
20Market Overview & Growth Strategy
Large Acute Care Telemedicine Market With
Increasing Adoption
$8.9bn Addressable Acute Care Telemedicine Market(1)
Upside Utilization increase
Potential and more specialties
Current
Utilization $8.9bn
$2.8bn Highly Addressable Adjacent
Addressable Market within Specialties
Current Specialties
Neurology Cardiology Maternal Fetal
Psychiatry Infectious Disease Medicine
ICU Hospitalists Palliative Care
Emergency Medicine Oncology
Health System Telemedicine Spending and Usage Increasing Post-COVID-19
(Health System response %)
~90% of health systems expect to
Increase Usage 25%
increase spend on clinician-to- Further
clinician acute care telemedicine in
Increase Spend the next 12 to 18 months(2)
90% Maintain
Increased Usage 65%
~90% of hospitals expect greater
usage of telehealth vs. pre-COVID-19 Return to
10% Spend the Same pre-COVID Usage 10%
levels to persist(3)
(1) Hospital count per Definitive Healthcare as of 12/2019 and revenue based on current SOC client average.
(2) EY-Parthenon study as of June 2020. 22
(3) LEK study as of April 2020.Differentiated Position In The Telemedicine Landscape
Clinician
Supply Is
Limited
Optimization model for
financial, clinical, operational
sustainability
Increasing need for resource optimization
Turnkey 24x7 command center
for workflow assurance
Active management of
App-based direct-to-consumer physician’s time, the costliest
provides digital patient intake, resource
eligibility & copay verification,
online payment Low code platform using
configurable decision engines
Addresses simple acute care and UI screens
hospital workflows with Real-time visibility to clinical
Primarily support scheduled InTouch and Avizia supply for supply-side
virtual office visits for elasticity, on-shift or off-shift
existing patients Non-supervised self-service
consult management Complex workflows for care
Focus on video session continuity in acute care
establishment technology Large payer contracts Revenue cycle management
On-demand capability limited
to waiting rooms
Clinician
Supply Not Popular with small physician
An Issue practices for outpatient cases
One-to-One Many-to-Many
Increasing workflow complexity
Scheduled On-Demand
23SOC’s Flexible Enterprise Telemedicine Solution
CLINICAL ANY SPECIALTY / ANY MIX OF ANY DEVICE,
WORKFLOWS CLINICAL SERVICE LINE PROVIDER NETWORKS ANY LOCATION
Neurology
On-Demand Health System Client Equipment
Clinicians
Psychiatry
Scheduled
Critical Care Contracted
Physician
Groups
SOC Carts
Rounds Hospitalist
SOC
Cardiology Clinicians
Care Coordination
Task Management
Emergency Medicine
Hybrid
Hybrid
Store & Forward
Infectious Disease
24Go-To-Market Strategy
Direct Sales Team Channel Sales & Strategic Partnerships
Hospitals & Health Systems
Mid to Large Physician Groups, Physician
767 Staffing Organizations & Locum Tenens
880
4,283 Federal & Government (DHA, VA)
Small (1-20 Hospital Systems) Adjacent Markets (e.g. Correctional
Facilities)
Medium (21-50 Hospital Systems)
Large (51+ Hospital Systems)
Core Services: Neurology, Psychiatry & Critical Care
– Using SOC Physician Network
Telemed IQ SaaS Platform – Using 3rd Party Provider Network(s) in a Multitude of Acute Specialties
Source: Hospital count per Definitive Healthcare.
Note: Includes 5,930 hospitals. 25Omni-Channel Approach Drives Demand
TV
Email
SEO
Digital Marketing
Paid
Omni-Channel search
Strategy
Outbound
Business Development
Partners
Direct
Targeted
Mail
Calls
Client-led webinars Local / national PR
Industry articles Robust blog program
Case studies
Traffic to SOC Solutions web pages +216%(1) YoY in 2020
(1) For the eight months ended August 31, 2020 and 2019.
26Scaling Investment In Sales And Marketing To Drive
Bookings
Increasing Headcount To Drive Growth 2020 Pipeline Sourcing
(Quota-bearing headcount) (2020E pipeline by source)
20
Other
10%
9
Inbound
5 33%
Up-Sell
28%
2019A 2020E 2021E
Organized by geographic territory Business
Development
Typical experience includes 5-10 years managing 29%
complex health care sales cycles
Backgrounds include commercial roles at IBM Watson,
Optum, Gartner, and Nuance
Doubling sales headcount in 2021
Note: Projections use SOC estimates. With respect to projections, see slide 2 “Use of Projections” under “Disclaimer”.
27Client Success Team Drives Growth
Efficient Implementation
Tailored Sales Approach (90-120 days)
Personalized outreach and Single point of contact
messaging
Customized training tailored to
Leverage intelligence to craft organization and role
client-centric offers
Physician privileging and
credentialing
Executive and key stakeholder
onboarding
RAPID implementations available
as necessary (Numerous Paths To Grow
Acquisitions
Accelerating SaaS
Platform Growth
Cross-Selling and
Upselling Existing
Clients
New Client Wins
29Strong Momentum Signing New Clients
Geographic Hospital Mix
(2019 revenue)
31%
69%
Urban Rural
Hospital Bed Mix
(2019 bed mix by facility count)
19%
41%
40%
< 100 100 - 250 250+
Balanced mix of historical bookings; 47% new clients as percentage of 1H 2020 total bookings
30Increase Penetration With Existing Clients
~$670m Proven record of selling additional services to facilities
Expand service lines
Service / facility 1.72
1.61
1.52
1.38 1.42
~$670m 2015A 2016A 2017A 2018A 2019A
~$860m 0.1 Δ in service/facility generates $3.7m revenue
Whitespace
opportunity with
existing clients Strong history of further penetrating health systems
~$190m Facility Count
Client (Yr Signed) First Year Current
Client A (2015) 2 34
Client B (2012) 2 34
Client C (2006) 1 29
Client D (2007) 5 18
Client E (2011) 1 18
~$190m 1% Δ in facility penetration generates $2.5m in revenue
Expand facilities
Source: Definitive Healthcare as of 12/2019 and company data.
Note: Analysis includes hospitals and does not include other sites of care (i.e., SNFs, Federal Agencies, Clinics, etc.) 31Accelerating Telemed IQ SaaS Rollout
Strong Telemed IQ Revenue Growth
(Revenue in $ millions)
Leverage SOC’s SaaS platform and reporting &
analytics with clients’ own clinicians $18.9
Platform powers other physician networks
$7.5
Access to adjacent channels, fulfilling demand for
telemedicine services $1.6 $2.6
$0.2
High gross margin 2018A 2019A 2020E 2021E 2022E
Select Channel Opportunities Market Size Representative SOC Clients
Physician Groups 75,000 providers(1)
Military Health System 12,000 providers(2) Confidential
Multi-site IDNs 1,000 hospitals(3)
Note: Projections use SOC estimates. With respect to projections, see slide 2 “Use of Projections” under “Disclaimer”.
(1) Company estimate of the Top 30 groups that provide Hospitalist medicine and Emergency Medicine.
(2) American Board of Medical Specialties Report on Military Physicians and Continuing Certification, April 2015. 32
(3) IQVIA 2018 whitepaper.Disciplined M&A Focus
Acquisition Strategy Robust Pipeline of Accretive Acquisition Opportunities
($ in millions)
Estimated Target
Revenue Opportunities
Core specialties
Core Specialties $245 21
Adjacent specialties to leverage Core + Adjacent Specialties
$145 10
and End Markets
platform
Adjacent Specialties and
$195 9
End Markets
Select technologies to expand
capabilities
Total $585 40
Note: Estimated revenues per Datafox.
33Growth Targets
$21.8m $7.5m $80.4m
2021E Bookings(1) 2021E Telemed IQ 2021E Total Revenue
Revenue
67% ~150% 41%
2021E – 2022E 2021E – 2022E 2021E – 2022E
Bookings(1) Growth Telemed IQ Revenue Total Revenue Growth
Growth
Note: Projections use SOC estimates. With respect to projections, see slide 2 "Use of projections" under "Disclaimer."
(1) Bookings are defined as sum of the annualized fixed monthly fees and implementation fees, also referred to as the First Year Contract Value (variable fees excluded). Implementation fees are 34
amortized on a monthly basis over the length of the average customer life.Financial Overview
Predictable Revenue Model
Long History of Growth Longstanding Client Relationships
Highly visible and predictable revenue model Tenured customer base
− Recurring revenues − Average customer relationship ~48 months
− Fixed monthly fees provide predictable revenue 6%
stream 8%
< 1 Year
− Multi-year agreements (average 2 years) with annual
evergreen renewal 15% 1-2 Years
− Annual COL(1) adjustments (price escalators) 2-3 Years
64% 8% 3-4 Years
Customers have demonstrated increasing utilization
volume over time 4+ Years
($ in millions)
$66.2
Track record of net revenue retention(2)
$53.7
$25.2 103% 102% 103%
$43.7 98% 100%
$15.4
$33.0 $8.9
$28.5
$6.0
$3.5
$36.9 $39.7
$33.1
$22.6 $24.8
2015A 2016A 2017A 2018A 2019A 2015A 2016A 2017A 2018A 2019A
Fixed Fee Utilization-based Fees Deferred Revenue
(1) COL – cost of living.
(2) Net revenue retention measures how much revenue has been retained at the end of the period, including any change from the same customers due to utilization change. 36Strong Bookings Momentum Supports Future Growth
Record Bookings 1H 2020(1)
$5.7m 1H 2020 bookings - highest in company
($ in millions)
history
Q1 Bookings
Q2 Bookings − Balanced mix (47% new clients; 53% cross-
$36.3 selling)
− Historically, 2H of year stronger than 1H
− On target to achieve full year bookings of
$10.9m (remaining pipeline coverage(2) of
$5.7 ~5.9x)
$21.8
Sales organization revamp in 1H showing
results
− Achieved record 1H 2020 bookings with only
$10.9 $2.4
$2.9 half of current team; fully ramped team
available going into 2H 2020
$6.1
− Traffic to SOC Solutions web pages +216%(3)
YoY in 2020
$0.9
2019A 2020E 2021E 2022E 1H 1H
2019A 2020A
Note: Projections use SOC estimates. With respect to projections, see slide 2 “Use of Projections” under “Disclaimer”.
(1) Bookings are defined as sum of the annualized fixed monthly fees and implementation fees, also referred to as the First Year Contract Value (variable fees excluded). Implementation fees
are amortized on a monthly basis over the length of the average customer life. 37
(2) Pipeline coverage calculated as pipeline as a multiple of bookings plan.
(3) For the eight months ended August 31, 2020 and 2019.Revenues Continue To Grow As Volumes Recover
Revenues Have Grown Steadily Utilization Volumes Recovering to Pre-COVID Levels(1)
($ in millions) (% change in volumes vs. March 13, 2020 levels)
Q1 Revenues
Q2 Revenues 140%
$113.5
Impact of Impact of
decreased decreased
utilization utilization 120%
from COVID-19 from COVID-19
$80.4
CAGR: 23% 100%
$66.2
$32.6
$57.3
$53.7 $28.4
$43.7 80%
$15.9 60%
$14.8
40%
2017A 2018A 2019A 2020E 2021E 2022E 1H 1H Jan-20 Mar-20 May-20 Jul-20 Sep-20
2019A 2020A teleNeurology telePsychiatry US ED Visits
(2)
Note: Projections use SOC estimates. With respect to projections, see slide 2 “Use of Projections” under “Disclaimer”.
(1) Volume data re-based to 100% as of March 13, 2020.
(2) ED visit volume data from Strata Decision Technology. 38Line Of Sight To 2021E Revenues
($ in millions)
$4.7
$7.2 $80.4
($3.7)
$14.8
Recovery from
$9.8 lower utilization
$57.3 due to COVID
2020E Growth From Revenue From Revenue From Projected 2021E
Existing Customers(1) Remaining 2020E 2021E New Terminations
New Bookings (2) Bookings (2)
Bookings expected to double from $10.9m in 2020E to $21.8m in 2021E
Note: Projections use SOC estimates. With respect to projections, see slide 2 “Use of Projections” under “Disclaimer”.
(1) Includes $3.3m of revenue from customers who are contracted and in the process of implementation.
(2) Bookings are defined as sum of the annualized fixed monthly fees and implementation fees, also referred to as the First Year Contract Value (variable fees excluded). Implementation fees 39
are amortized on a monthly basis over the length of the average customer life; remaining bookings in 2020E from 4/30/2020 onwards.Financial Update
Strong bookings 2020 YTD and outlook driving additional operational investments and updated revenue mix
Total bookings and revenue projections remain unchanged
Revenues
Mix shift of $2.0m in 2021E and $1.3m in 2022E due to focus on core services in go-to-market strategy and
slower ramp in direct platform sales staffing for Telemed IQ
Physician
Expense
Projections revised up $2.2m in 2020E, $1.0m in 2021E and $0.8m in 2022E, primarily related to onboarding
new physicians and retaining contracted physicians to build capacity for future growth in core services
Projections revised up $2.9m in 2021E and $2.8m in 2022E, primarily related to increased
Marketing
− Hiring to support growth opportunities in core services
Sales &
− Direct platform sales staffing of Telemed IQ
− Marketing expenses to drive revenue and pipeline growth
− Resources and incentives to also drive cross-sells
Note: Projections use SOC estimates. With respect to projections, see slide 2 “Use of Projections” under “Disclaimer”.
40Revenue Growth Drivers
Core Consults Core Revenue / Core Consult Revenues
(In thousands) ($ in millions)
Telemed IQ Revenue
Core Revenue $113
Impact of
decreased Impact of $19
utilization 200 decreased
from COVID-19 utilization
from COVID-19
$473
163 $460 $80
159
$8
138 $423 $66
129
$395 $57
$387
$54
$95
$73
$65
$54 $55
(1) (1)
18A 19A 20E 21E 22E 18A 19A 20E 21E 22E 18A 19A 20E 21E 22E
Note: Core consults and core revenue exclude contribution from Telemed IQ; projections use SOC estimates. With respect to projections, see slide 2 “Use of Projections” under “Disclaimer”.
(1) 2018 core consult volume includes estimated consults from acquired JSA business.
41Improving Adjusted Gross Profit Margins
Adjusted Gross Profit Margins(1)
60%+
Eliminate non-recurring
LT Target teleNeurologist incentive
payments
5% 56% Physician productivity
5% Mix-shift of higher margin
Telemed IQ
(2)
2%
44%
2019A Reduction Of Increased Product 2022E
Coverage Costs Productivity Mix-Shift
From Scale
Note: Projections use SOC estimates. With respect to projections, see slide 2 “Use of Projections” under “Disclaimer”; with respect to Non-GAAP financial measures, see slide 2 “Use of Non-
GAAP Financial Measures” under “Disclaimer” and reconciliation set forth in Appendix.
(1) Adjusted Gross Profit excludes depreciation and amortization and telemedicine equipment financing costs. 42
(2) Impact of $2.3m in one-time incentive payments made to teleNeurologists in 2019A due to elevated volumes.Financial Summary And Targets
$5.7m 100%
1H 2020 Bookings(1) 2019 Net
Highest in History Revenue Retention(2)
26% 60%+ ~20%
2016 – 2019 LT Adjusted Gross Profit LT Adjusted EBITDA
Revenue CAGR Margin(3) Target Margin Target
Note: Projections use SOC estimates. With respect to projections, see slide 2 “Use of Projections” under “Disclaimer”.
(1) Bookings are defined as sum of the annualized fixed monthly fees and implementation fees, also referred to as the First Year Contract Value (variable fees excluded). Implementation fees are
amortized on a monthly basis over the length of the average customer life. 43
(2) Net revenue retention measures how much revenue has been retained at the end of the period, including any change from the same customers due to utilization change.
(3) Adjusted Gross Profit excludes depreciation and amortization, and telemedicine equipment financing costs.Conclusion
Compelling Market Opportunity
Scaled, Differentiated Acute Care Telemedicine Platform
Substantial Opportunities To Expand And Grow
Attractive Financial Profile
44Appendix
Transaction Overview
SOC Telemed entered into a definitive agreement to merge with Healthcare Merger
Corp. on July 29, 2020
Implied enterprise value of $721 million (9.0x 2021E revenue)(1)
Transaction to be funded through a combination of HCMC’s $250 million of cash in trust
(subject to stockholder redemptions) and $165 million of committed PIPE financing, led
by a number of institutional investors
Proceeds used to pay cash consideration to selling shareholders, to pay down existing
debt, for general corporate purposes and for transaction expenses
Current shareholders of SOC to maintain ~40% pro forma ownership(1)
Closing expected in Q4 2020
Note: Projections use SOC estimates. With respect to projections, see slide 2 “Use of Projections” under “Disclaimer”.
(1) Assumes no redemptions. Excludes 1.9 million founder shares subject to earnout at $12.50 and $15.00. 46Pro Forma Capitalization And Ownership
Estimated Transaction Sources & Uses Pro Forma Enterprise Valuation at Close
($ in millions) ($ in millions, except for share price)
Sources PF Transaction
HCMC Cash in Trust $250 SOC Telemed Illustrative Share Price $10.00
Anticipated PIPE Proceeds $165 Pro Forma Shares Outstanding 77.1m
Total Equity Value $771
Seller Rollover Equity $305
(+) Debt as of 6/30/20(3) –
Total Sources $720
(–) Cash as of 6/30/20 ($50)
Uses
Pro Forma Enterprise Value $721
Cash Consideration to SOC Shareholders $267
Pro Forma 2021E EV/Revenue 9.0x
Cash to Balance Sheet $45
Illustrative Post-Transaction Ownership Breakdown
Debt Repayment(1) $83
Seller Rollover Equity $305 21%
Estimated Transaction Expenses(2) $20 SPAC Sponsor Shares
7% Public Stockholder Shares
Total Uses $720 40%
Seller Rollover Shares
PIPE Investor(s)
32%
Note: Projections use SOC estimates. With respect to projections, see slide 2 “Use of Projections” under “Disclaimer”; assumes no redemptions; share count includes 30.5 million roll-over shares
(assumes $10.00 redemption price for illustrative purposes), 25.0 million HCMC shares, 16.5 million PIPE shares and 5.1 million sponsor shares; share count excludes 1.9 million sponsor earnout
shares (50% vesting at $12.50 and 50% at $15.00); as well as the impact of 12.5 million public warrants and 0.4 million private placement warrants (struck at $11.50).
(1) Debt repayment as of 6/30/2020 including back-end facility fees; debt subject to 4% PIK interest if repaid at later date. 47
(2) Includes deferred HCMC IPO fees and other fees and expenses.
(3) Undrawn $20m revolver contemplated to be put in place at time of transaction close.Operational Benchmarking
Digital Health Communications Teleconference Peer Averages
Revenue Growth
(2020E – 2021E)
54%
40% 40% 41%
34%
30% 27%
23%
17%
13%
(2021E & LT Target)
~80%
Adj. Gross Margin
~75% ~70% ~75%
~60% ~65% NA ~59%
~50% ~45%
84% 77%
68% 73% 71%
64% 57%
54%
39% 37%
~20% ~20% ~20% ~20% ~20% ~20% ~30% ~20% ~25%
(2021E & LT Target)
Adj. EBITDA Margin
NA
27%
14% 18% 20%
9% 6%
(4%) (5%)
(9%)
(46%)
Source: Company filings and FactSet as of 9/18/2020.
Note: Data calendarised to December year end; Teladoc based on broker forecasts, pro forma for full-year impact of InTouch acquisition in 2020E and 2021E and pro forma for merger with
Livongo; Livongo shown as of unaffected date 8/4/2020; Amwell projections use broker forecasts. With respect to projections, see slide 2 “Use of Projections” under “Disclaimer”. 48Valuation Benchmarking
EV / Revenue (2021E)
Digital Health Communications Teleconference Peer Averages
41.2x
33.6x
25.9x
20.3x 20.4x
18.6x 18.0x 18.6x
9.0x 8.9x
Source: Company filings and FactSet as of 9/18/2020.
Note: Data calendarised to December year end; Teladoc based on broker forecasts, pro forma for full-year impact of InTouch acquisition in 2020E and 2021E and pro forma for merger with
Livongo; Livongo shown as of unaffected date 8/4/2020; Amwell projections use broker forecasts. With respect to projections, see slide 2 “Use of Projections” under “Disclaimer”. 49Valuation Benchmarking (Cont’d)
EV / ‘21E Revenue vs. ‘20E – ‘21E Revenue Growth
45x
40x
35x
30x
EV / 2021E Revenue
25x
20x
15x
10x
5x
–
– 10% 20% 30% 40% 50% 60%
2020E – 2021E Revenue Growth
Faster Growing at an Attractive Multiple
Source: Company filings and FactSet as of 9/18/2020.
Note: Data calendarised to December year end; Teladoc based on broker forecasts, pro forma for full-year impact of InTouch acquisition in 2020E and 2021E and pro forma for merger with
Livongo; Livongo shown as of unaffected date 8/4/2020; Amwell projections use broker forecasts. With respect to projections, see slide 2 “Use of Projections” under “Disclaimer”. 50Historical And Projected Financial Summary
($ in millions) 6 months ending
2018A 2019A 2020E 2021E 2022E 6/30/19A 6/30/20A
Bookings(1) $11.1 $6.1 $10.9 $21.8 $36.3 $2.4 $5.7
Total Revenue $53.7 $66.2 $57.3 $80.4 $113.5 $32.6 $28.4
YoY (%) 23% 23% (13%) 40% 41% 36% (13%)
(2)
Adj. Gross Profit $24.9 $28.9 $23.2 $43.1 $64.0 $13.5 $10.5
Adj. Gross Profit Margin (%) 46% 44% 40% 54% 56% 41% 37%
Operating Expenses(3)
Sales & Marketing 6.2 5.9 8.3 13.4 16.1 3.2 3.0
R&D 1.7 1.2 1.4 2.2 2.8 0.6 0.6
Operations 7.3 7.7 9.0 11.3 11.8 3.7 4.3
G&A 14.6 15.1 15.6 19.8 20.5 7.5 6.9
Adj. EBITDA(4) ($4.9) ($1.0) ($11.1) ($3.6) $12.9 ($1.6) ($4.3)
Adj. EBITDA Margin (%) (9%) (1%) (19%) (4%) 11% (5%) (15%)
Net Income ($18.1) ($18.2) ($8.9) ($15.4)
Select Data:
CapEx $4.0 $5.2 $5.5 $5.4 $6.9 $2.9 $3.3
Change in NWC 1.6 1.1 (0.7) 1.6 2.7 (0.8) 3.1
(5)
Select KPIs :
Core Consults (in thousands) 138 163 129 159 200 79 67
Core Revenue / Core Consult $387 $395 $423 $460 $473 $407 $413
Note: Projections use SOC estimates. With respect to projections, see slide 2 “Use of Projections” under “Disclaimer”; with respect to Non-GAAP financial measures, see slide 2 “Use of Non-
GAAP Financial Measures” under “Disclaimer” and reconciliation set forth in Appendix.
(1) Bookings are defined as sum of the annualized fixed monthly fees and implementation fees, also referred to as the First Year Contract Value (variable fees excluded). Implementation fees
are amortized on a monthly basis over the length of the average customer life.
(2) Adj. Gross Profit excludes depreciation and amortization and telemedicine equipment financing costs.
(3) Operating expenses exclude depreciation and amortization, stock compensation expenses, and non-recurring expenses (transaction related expenses, stock-based compensation, legal
settlements, advisory fees and other non-operating expenses).
(4) Excludes non-recurring expenses (transaction related expenses, stock-based compensation, legal settlements, advisory fees and other non-operating expenses) of $4.6m in 2018A and 51
$2.6m in 2019A; $0.4m in 1H 2019A and $2.9m in 1H 2020A. See slide 52.
(5) 2018 core consult volume includes estimated consults from acquired JSA business.EBITDA Reconciliation
($ in millions) 6 months ending
2018A 2019A 6/30/19A 6/30/20A
Net Income ($18.1) ($18.2) ($8.9) ($15.4)
Interest 7.6 10.3 4.8 5.6
Tax (1.8) 0.0 0.0 0.0
D&A 2.7 4.3 2.0 2.6
Non-Recurring Expenses(1) 4.6 2.6 0.4 2.9
Adj. EBITDA ($4.9) ($1.0) ($1.6) ($4.3)
(1) Non-recurring expenses include stock-based compensation, transaction related expenses, legal settlements, advisory fees and other non-operating expenses.
52You can also read


