Soundscape Ecology at Audible Frequencies - Oliver Metcalf - CIEEM
←
→
Page content transcription
If your browser does not render page correctly, please read the page content below
Soundscape Ecology at
 Audible Frequencies
       Oliver Metcalf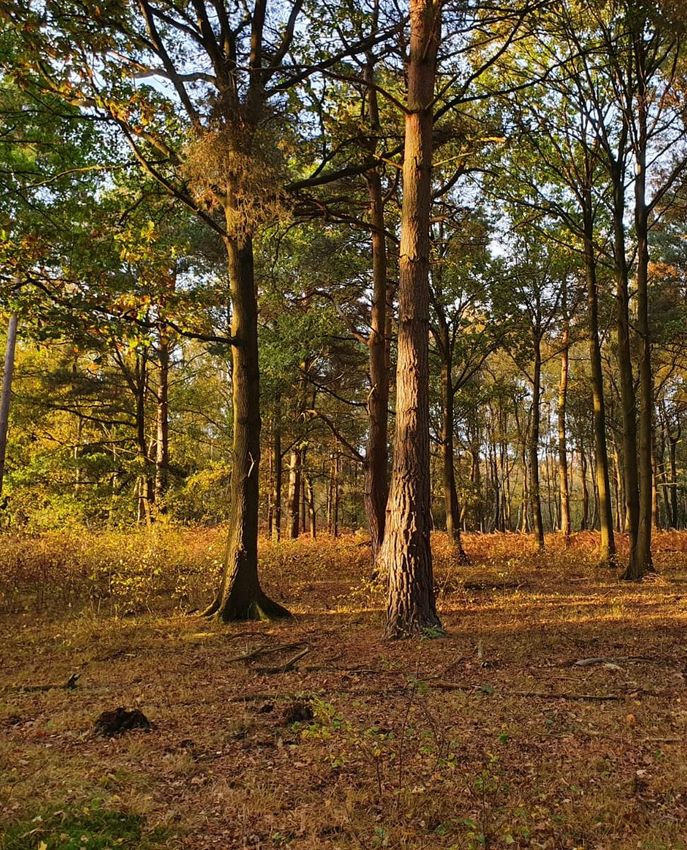
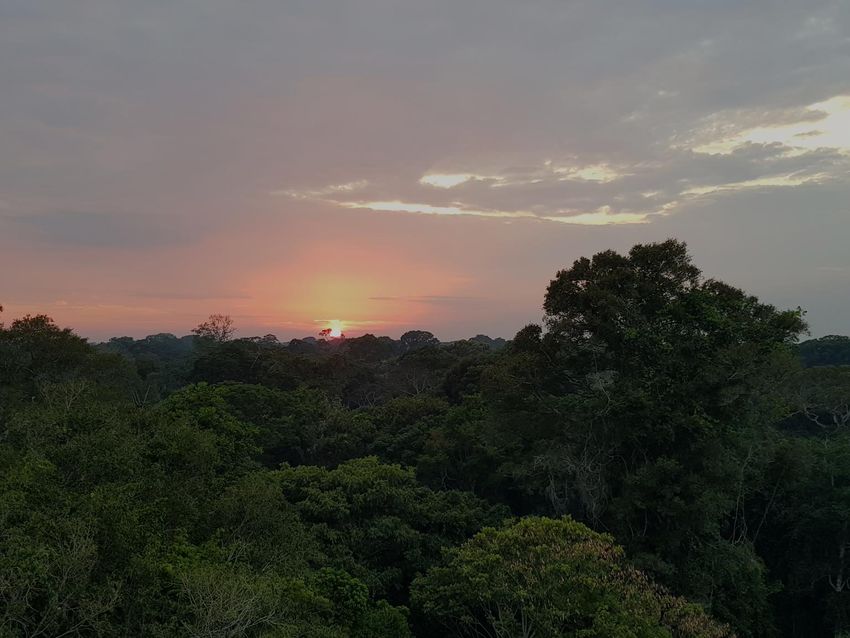
Understanding the impacts of fire and logging
   on Amazonian wildlife using acoustic
                monitoring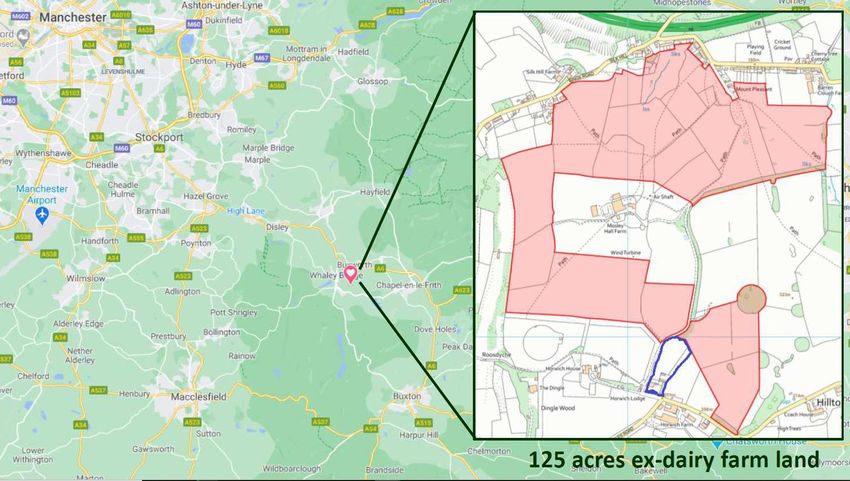
About me:
Passive Acoustic Monitoring:
• Record for long periods
• Record for short periods many times
• Reduce number of field visits
• Reduce impact of observer
• Data can be checked by multiple
 analysts to reduce bias
• Data can be analysed multiple times
Passive Acoustic Monitoring: the downsides
• Data loss
• Bias against non-soniferous species
• No ‘rulebook’ to follow –
 …although see Carlos Abraham’s guidelines for CIEEM and WWF’s
guidelines for acoustic monitoring
• Huge amounts of data collected
How to analyse sound data?
                             1.Manual analysis
        “Autonomous sound recording outperforms human observation for
        sampling birds” Darras et al., (2019) Ecol.App.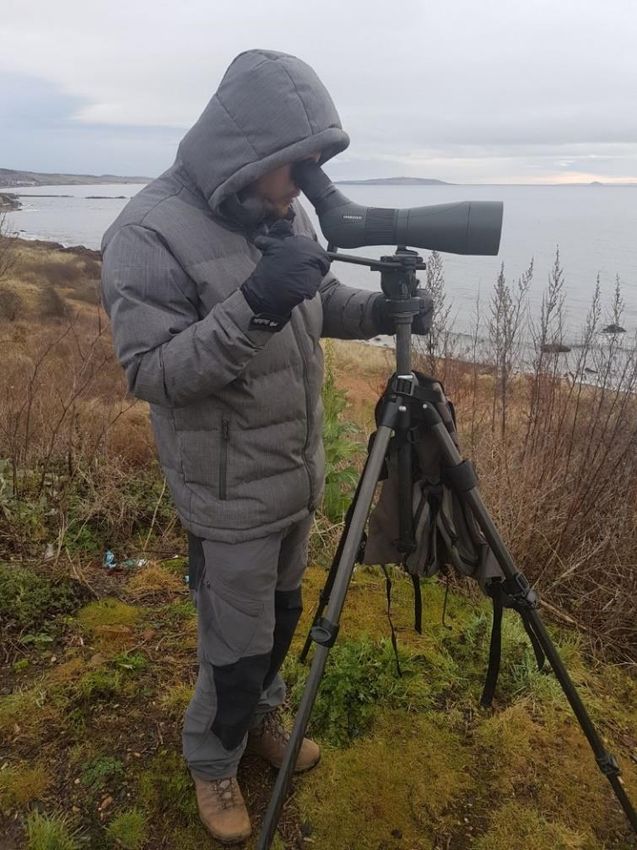
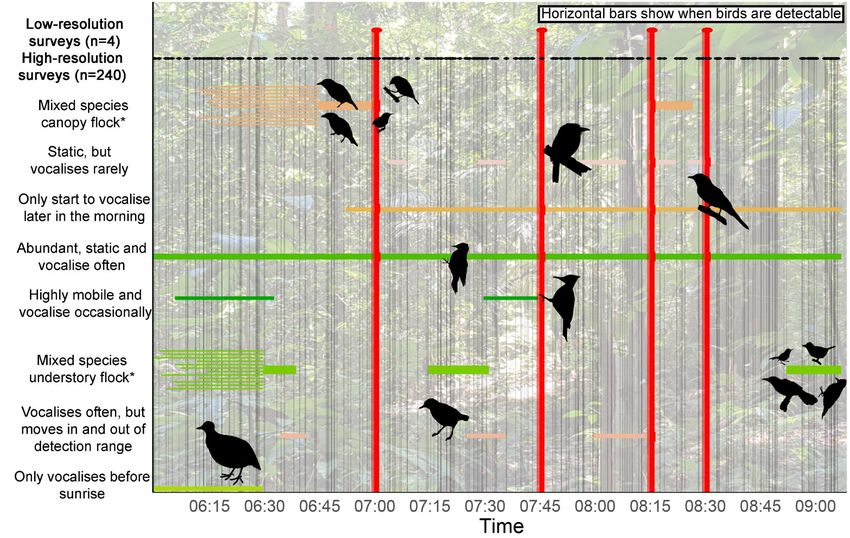
Case study:
High temporal-resolution surveys for bird diversity
Results:

Optimising tropical forest bird surveys using passive acoustic monitoring and repeated short-duration point counts
Oliver C. Metcalf, Jos Barlow, Stuart Marsden, Nárgila Gomes de Moura, Erika Berenguer, Joice Ferreira, Alexander C. Lees
bioRxiv; doi: https://doi.org/10.1101/2020.08.24.263301
Manual listening:
Case study:
Nocturnal scoter migration

• Citizen-science project
• Birdwatchers recorded scoter over
  there gardens between 31st March-3rd
  April
• Entered sighting in to online Google
  Sheet
• Mapped sightings by time and location

• Clear flight lines emerged
How to analyse sound data?
         2.Automated classification

• Machine-learning or deep-learning models to detect and classify sound

• Widely used in bat analysis – but lower frequencies have more noise!

• Can accurately detect species presence in large amounts of data
Reality:
• Fully-automated models rarely used in
ecological studies
• Tend to be for low numbers of species
• In order to avoid false detections, often
miss many true positives
• Relies on large amounts of (manually) Species Balanced False
labelled training data Accuracy detection
rate
• Limited user-friendly options – Silky-tailed nightjar 91%In the meantime –
1A: Semi-automated classification
AI models detect vocalisations, human observers confirm presence
Uses
• Occupancy models
• Species distribution models
• Abundance (in special cases)
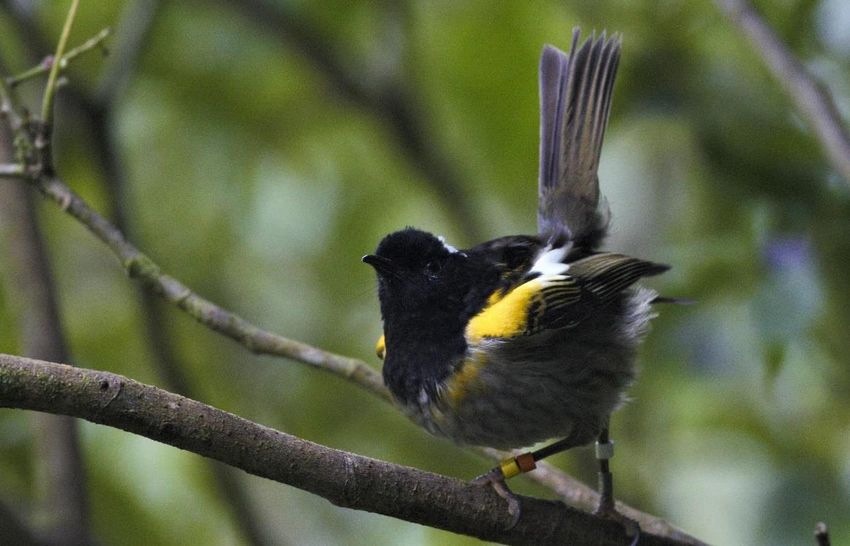
• Behavioural studiesCase study: Reintroduction monitoring
How to analyse sound data?
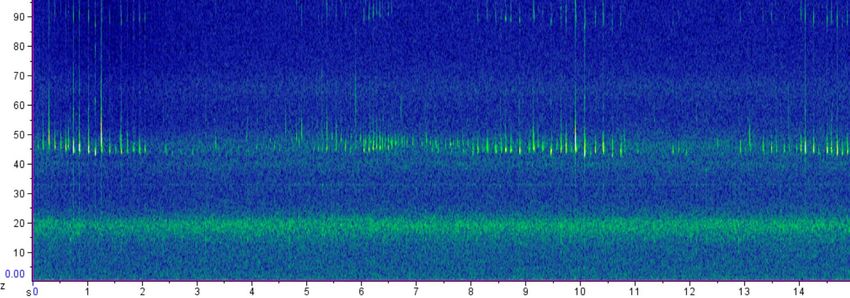
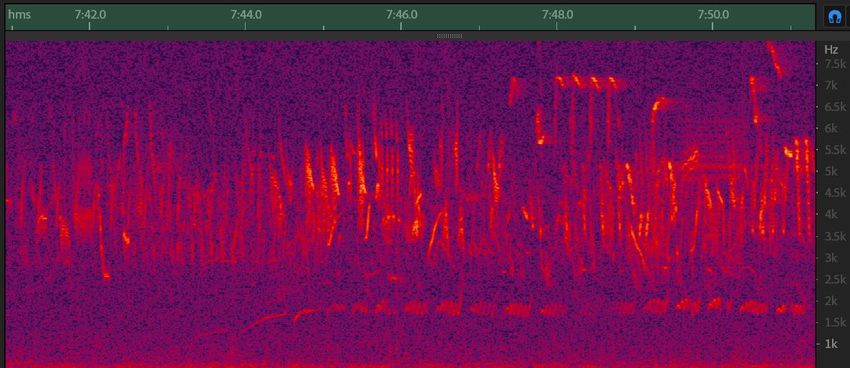
3: Acoustic Indices
• Automated analysis – very
quick!
• No information at species
level.
• Statistical measures of power
in a spectrogram
• Huge number of different
indices available (Bradfer-
Lawrence et al 2019, Methods.
Ecol.Evol for good summary)
• Have been used in terrestrial
and aquatic environments Fairbrass et al ., (2017) Ecol.Ind.Uses of Acoustic Indices
• Correlating with species richness – many examples, including coral
reefs and UK landscape
• Prediction of habitat types at macro and fine scale
• Including predicting human perceptions of ‘wilderness’ in the UK
(Carruthers-Jones et al., 2019. Sci.Tot.Env)
• Detection of temporal trends – e.g. ‘winter chorusing’ (Farina &
Ceraulo, 2017. Wiley)
• Features in classification
• Data reduction and production of long-duration false colour
spectrograms (Towsey et al., 2014. Ecol. Inf)Appropriate study design: Use lots of data Bradfer-Lawrence et al., (2019) Methods in Ecol.Evol.
Appropriate study design: Apply at appropriate times
and frequency bands

                                                Metcalf et al., (2020)
                                                Methods in Ecol.Evol
To improve sensitivity:
Metcalf et al., (2020)
Methods in Ecol.EvolAnd fidelity:
Metcalf et al., (2020)
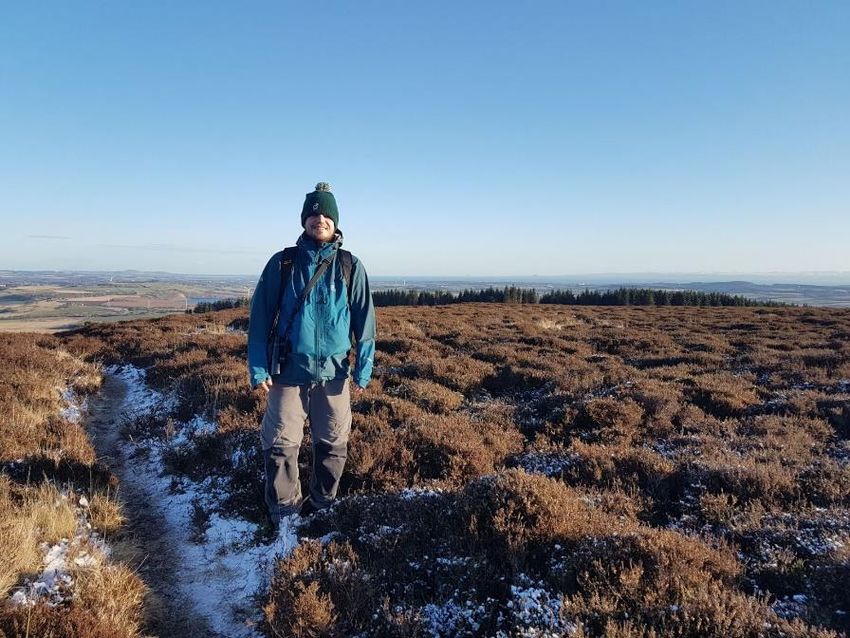
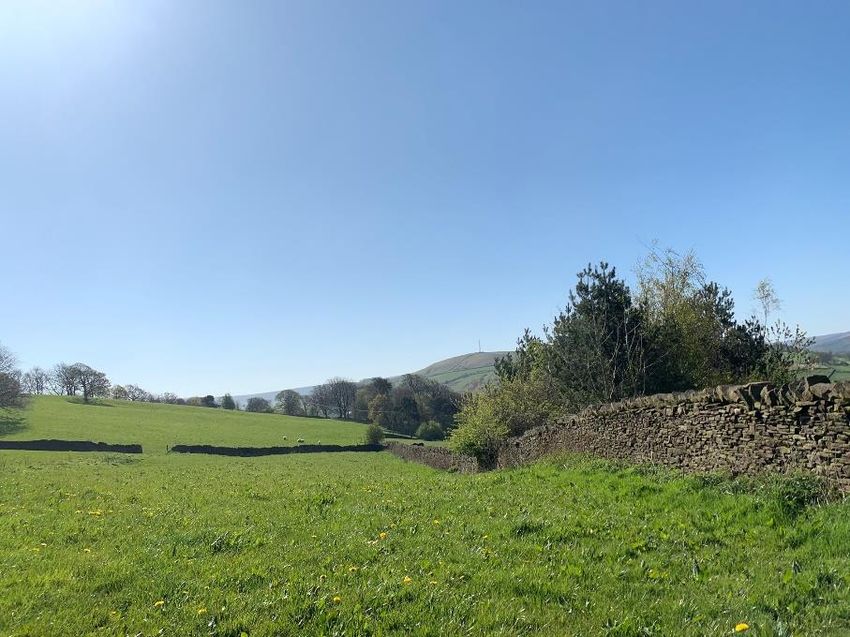
Methods in Ecol.EvolSunart Fields: a case study
Photo credits: Rachel EvattAcoustic Indices – some quick examples from Sunart Fields:
A single index….
Traditional and acoustic surveys:
• BBS surveys and territory mapping

• Vegetation surveys

• Manually checked PAM point-counts

• Local bat group using PAM data for bats

• Acoustic Indices

• Use BTO classification tools?
Oliver Metcalf
PhD Candidate, Manchester Metropolitan University
    @ecoacou_ollie               o.metcalf@mmu.ac.uk

                   Supervisors:
 Alexander Lees, Jos Barlow and Stuart Marsden

        Thanks to:
        Yves Bas, Erika Berenguer, Filipe França, Joice Ferreira and Christian
        Devenish

        And a huge thanks to our fantastic field team and co-ordinators
You can also read