Visualizaon in IRSA Services using Firefly - Emmanuel Joliet Caltech / IPAC - adass 2018
←
→
Page content transcription
If your browser does not render page correctly, please read the page content below
Visualiza(on in
 IRSA Services
  using Firefly

 Emmanuel Joliet
  Caltech / IPAC
   ejoliet@caltech.edu

     ADASS XXVII
   College Park, MD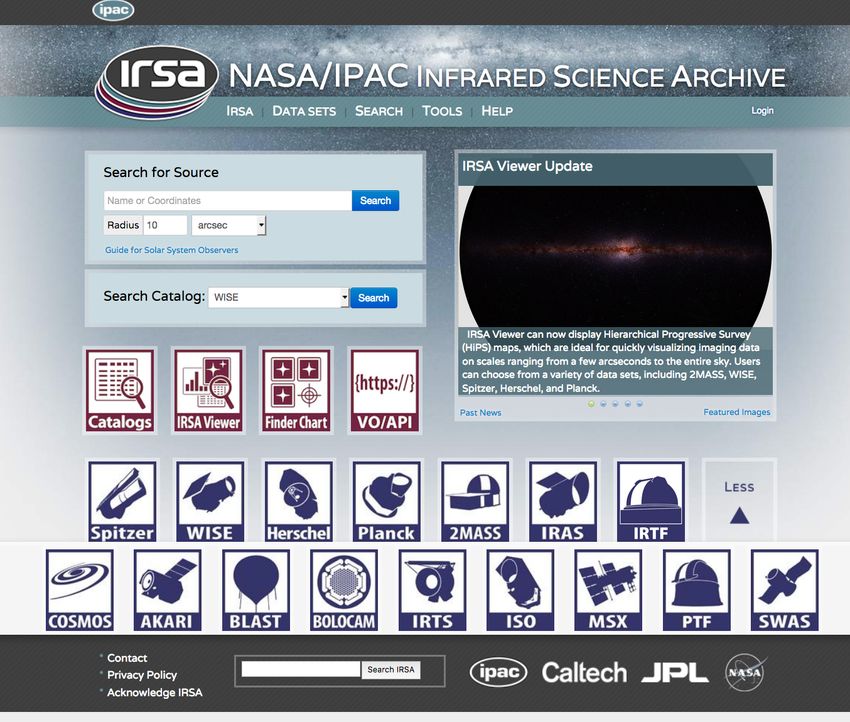
Data driven (archives)
• IRSA hosts >1PB of data from over 15 projects
• Data extracNon, exploraNon and visualizaNon
• Long-term soRware dev and maintenance
   ∘ UX learning curve is faster and UI consistent across site
   ∘ SoRware engineering / Scrum / Good pracNces
• API companions, UI build on top

       Data                            App.
       providers                       Servers

                   November 12, 2018             Firefly Focus Demo, ADASSXXVIII   2
Challenges
•   Data view as Images, charts and tables
•   InteracNvity and interconnecNvity
•   “User friendly” access
•   Rely on services running closer to the data
•   Reusable and derived components across projects and
    datasets

                 November 12, 2018   Firefly Focus Demo, ADASSXXVIII   3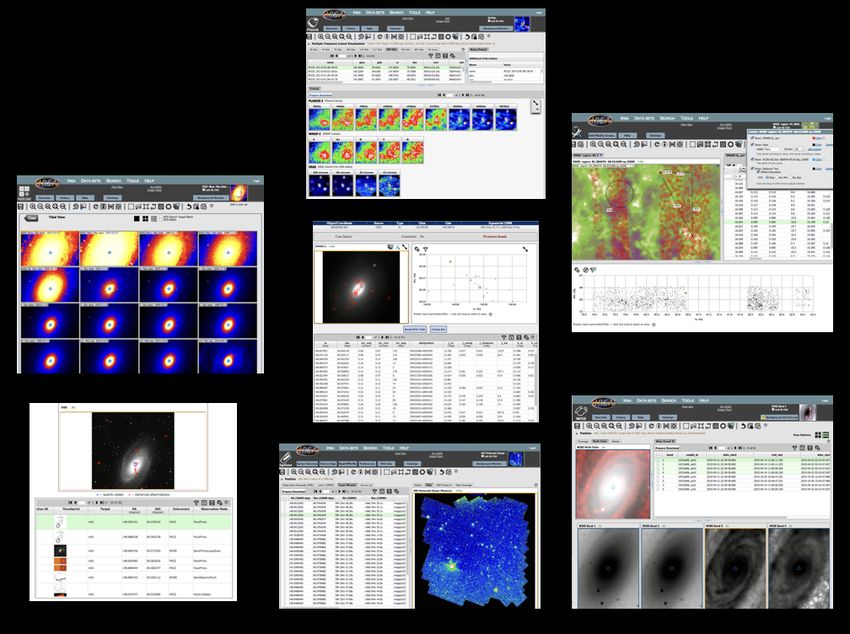
Technical
• IPAC/Firefly open-source library to build UI
  core components based on ReactJS/Java
  ü IPAC contributors, collaboraNve development across IRSA,
    LSST and NED
• Web-based applicaNons
  ∘ Server/client UI apps sharing
    common library/stack (apache +
    tomcat),
  ∘ Running HTML/JS client from ES6+
    (npm+redux+sagas+plotly+,etc.)
  ∘ And Java layer on the server side,
    staging searches from DB/APIs/VO
  ∘ Gradle/Jenkins for building/tesNng
  ∘ GitHub PRs docker/kubernetes
                 November 12, 2018       Firefly Focus Demo, ADASSXXVIII   4
Usage
• Main widgets: FITS image viewer, tables and charts
• Main features related to data brushing and linking
• Science data tools:
∘ Time Series tool for light-curve datasets
∘ Finder Chart for cross-comparison of images from various
surveys (+API)
• Project specific apps: i.e. WISE, Spitzer, Planck, Herschel,
contributed products.
• Recently: HIPs, periodogram, instrument footprints
• Stack exposed via high-level JS API or standalone using
full React classes (low-level)
∘ Framework composiNon used to ease maintenance and new
development
∘ Exposed properNes to control project specific requirements
November 12, 2018 Firefly Focus Demo, ADASSXXVIII 5(near) Future
• Updates coming soon including
∘ New available image datasets for searching IRSA archives
∘ Footprint overlay improved (dev/test data)
∘ MOC outline maps
• ExisNng integraNon with other languages to enable science
plaiorm access to run code closer to data for mining and cross
exploraNon with big-data
∘ Python integraNon within notebooks/JupyterLab exists already
∘ Same UI widgets are exposed to allow mulNple integraNon
• Constant effort to adopt modern web technology to enable
richer features and take advantage of 3rd party libraries
running in browsers
November 12, 2018 Firefly Focus Demo, ADASSXXVIII 6ApplicaNons/API
• Dataset/project specific
∘ WISE
∘ Herschel
∘ NED / Atlas
• Science tool
∘ IRSAViewer: table/chart/image
∘ Light-curve: Nme series tool
∘ Finder Chart: All-in-one, URL API
November 12, 2018 Firefly Focus Demo, ADASSXXVIII 7Demo outline
• Brushing with histogram/charts: IV catalog search, with
error bars, column expression (i.e. WISE)
• Gator -> Light-curve / Period finder with periodogram (WISE/PTF)
• HIPs demo , with URL (+ ivo://), ex:
hmps://irsa.ipac.caltech.edu/data/hips/list
∘ Footprint overlay (JWST) – layers control
• API html integraNon: Atlas, Herschel or NED
• IRSA Finder Chart applicaNon
• Python integraNon
• Dev: MOC, new Footprint tool
hmps://github.com/ejoliet/adass2018
November 12, 2018 Firefly Focus Demo, ADASSXXVIII 8Step by step demo
1. Brushing/Linking example with Time Series tool
1. WISE light-curve search (Gator)
2. Save table (via IRSA workspace) and Upload to Time Series tool
3. Or Launch to Time Series tool
4. See periodogram
5. HTML format axis label!: log(v [Hz])See docs here
2. HIPs: Discover or Catalog search with IV
1. See HIPs, change to others
2. Plot error bars, new column based on new math. Expression (WISE color color)
3. Add by URL or ivo://, see here: hips servers
3. API: Herschel, Atlas, NED…
1. Search Herschel, see coverage footprint
2. Launch image viewer
3. Show NED integraNon of FinderChart/IRSAViewer
4. See SIA search URL used in example under ‘demo’ folder, url sample here
4. Finder Chart, and API mode
5. Python / Jupyter notebook, see next slide
6. In development
1. Release soon: MOC, footprint enhanced
2. Future: demo with ‘slate’ with 3D chart and custom layout
November 12, 2018 Firefly Focus Demo, ADASSXXVIII 9
hmps://github.com/ejoliet/adass2018JavaScript API sample
{
onFireflyLoaded= function(firefly) {
Sample code taken
from IRSA Atlas
window.extViewer = firefly.getViewer();
firefly.setGlobalImageDef({
ZoomType : 'TO_WIDTH'
} );
firefly.debug= true;
tblReq = firefly.util.table.makeFileRequest('', 'https://irsa.ipac.caltech.edu:443//workspace/TMP_jwFPx0_378/Atlas/
204.159607_41.489799_eq_378.v0001//img_subset_whdr.txt', null,
{ pageSize: 50, META_INFO: {CENTER_COLUMN: 'ra;dec;EQJ2000'}
});
firefly.showTable('tableHere', tblReq, {removable: false,
showTitle: false,
showUnits: true,
showFilters: false,
selectable: false,
rowHeight: 40,
expandable: false,
help_id: "tables"});
extViewer.setDefaultParams({ "TitleOptions" : "FILE_NAME",
"ZoomType" : "TO_WIDTH",
"ColorTable" : "1",
"PreTitle" : "Abell1763",
"PostTitle" : "204.159607 41.489799 eq",
"overlayPosition" : "204.15961;+41.48980;EQ_J2000",
}) ;
}
}
API to build js docs: `gradle :buildJsDoc`
hmp:/localhost:8080/firefly/docs/js/ or file:///Users/ejoliet/projects/firefly/build/
firefly/war/docs/js/index.html
November 12, 2018 Firefly Focus Demo, ADASSXXVIII 10Python demo
1. Demo python, run in CLI:
> git clone https://github.com/Caltech-IPAC/firefly_client.git
> cd firefly_client/
> pip install -e .
> wget http://web.ipac.caltech.edu/staff/roby/demo/2mass-m31-green.fits
> wget http://web.ipac.caltech.edu/staff/roby/demo/m31-2mass-2412-row.tbl
> python # to enter in python console, see next
# in python console, import files and launch viewer (see docs):
from firefly_client import FireflyClient
fc = FireflyClient('https://irsa.ipac.caltech.edu/irsaviewer')
# show image
fval = fc.upload_file('2mass-m31-green.fits')
fc.show_fits(fval)
# display table
tval = fc.upload_file('m31-2mass-2412-row.tbl')
fc.show_table(tval)
2. Notebook, run in CLI and see notebook under ./examples:
> jupyter notebook
November 12, 2018 Firefly Focus Demo, ADASSXXVIII 11You can also read