Reporting & Analytics - Customer Digital Experience Day Online André Lucy, Product Owner
←
→
Page content transcription
If your browser does not render page correctly, please read the page content below

Reporting & Analytics
Customer Digital Experience Day Online

André Lucy, Product Owner                May 2020

Agenda
Reporting & Analytics

            Get up to date   Get ready for the future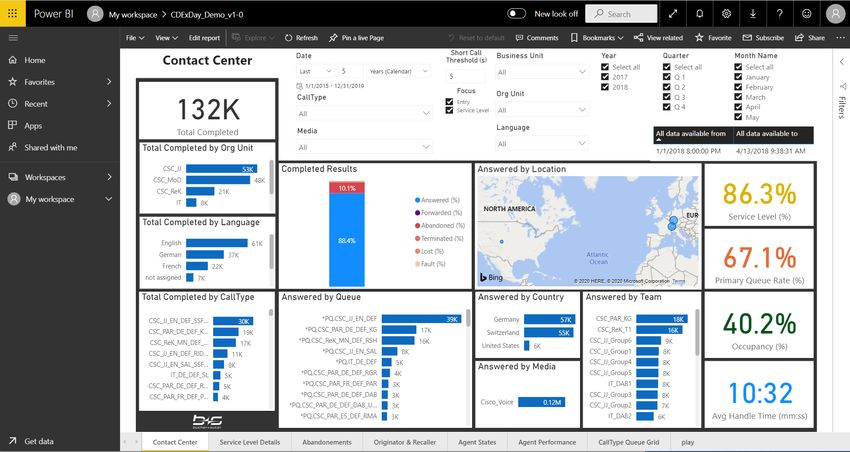
Updates on b+s Reports for CUIC
Features of version 3.2
• Primary Queue Reporting
                                             Topics
• Productivity & First Login / Last Logout
• Omnichannel Reporting

Roadmap of version 4.0 & 5.0
Primary Queue Configuration & Reporting
How to measure overflows?
to configure one or more primary queues per CallType
to verify the configuration
Service A
Queue A
Queue B
Measurements about Primary Queue handled tasks are available
within existing CallType and Ent. CallType Performance Reports (# All Fields)
Service A
Service B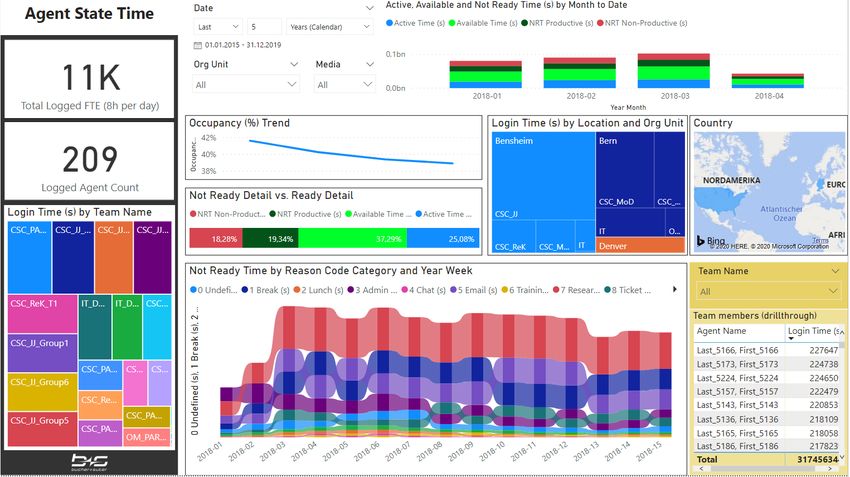
Productivity & First Login / Last Logout
Separating productive and non-productive Not Ready Reason Code categories
Allows to measure productivity including not ready time for categories with activity
Break Lunch
Timeout
Admin
Meeting Phone
Pause Chat Mittag
Project TOI RONA
Tracking
Training Dev
1 2 3 4 5 6 7 … 20
{Admin} {Break} {Chat} {Lunch} {Meeting} {Project} {Training} {RONA}
yes no yes no yes yes no no
Measurements about productivity are available within existing Agent State Reports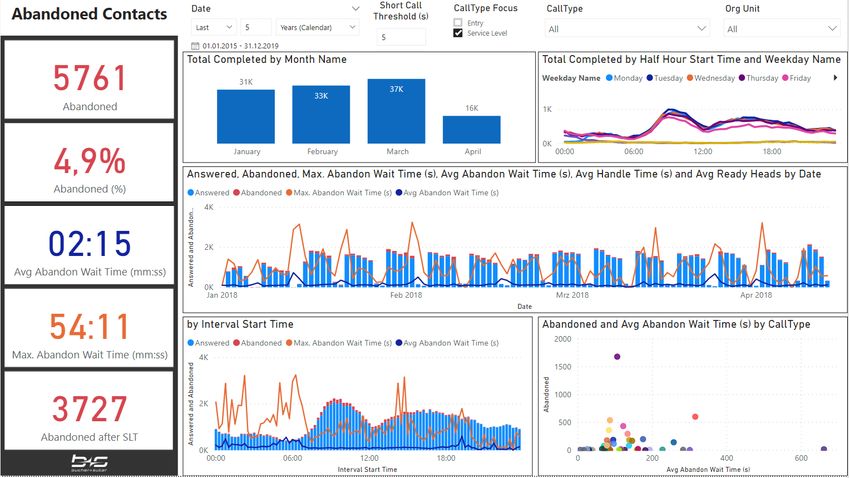
Omnichannel Agent Performance
Cisco b+s Media b+s Media mapping for ECE standard
Media Mapping Media medias allows to create pre-defined
1 (voice) - (default) Voice agent reports for voice, chat and email
2 (tickets) 4 Chat
Cisco data 4 (chat) 5 Email
5 (email) - other
8 (doc)
Agent State ACD ACD DN In & Dialer Agent State Chat Tasks Agent State Email Tasks &
Voice Inbound Callbacks DN Out Outbound Chat Email other Tasks
Voice Chat Email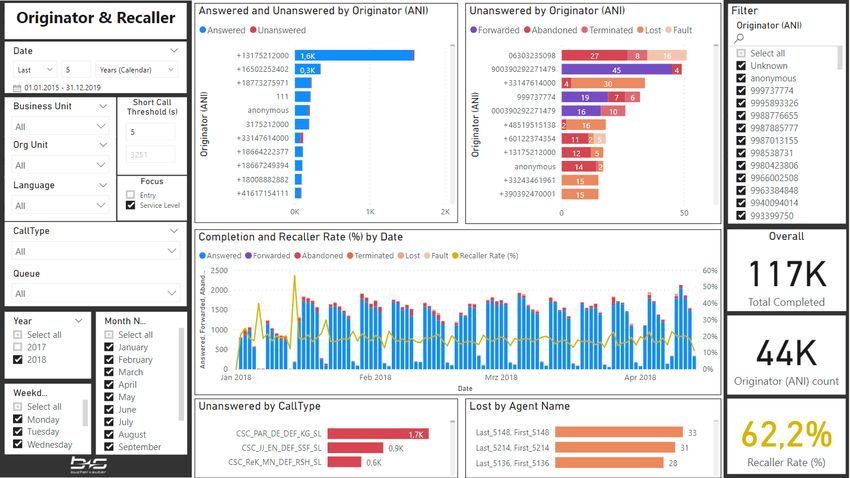
Media State Reports
Media mapping also allows to create pre-defined real time agent state displays per Media
Agent states for 3 medias on
a single row per agent
Single agent state per agent over medias Voice,
Chat and Email for the "most active" media:
1) Status priority: 1. Talking, 2. Hold, 3. Wrapup, 4.
Ringing, 5. Available, 6. Not Ready, 7. Logged Out
2) Media priority: 1. Voice, 2. Chat, 3. Email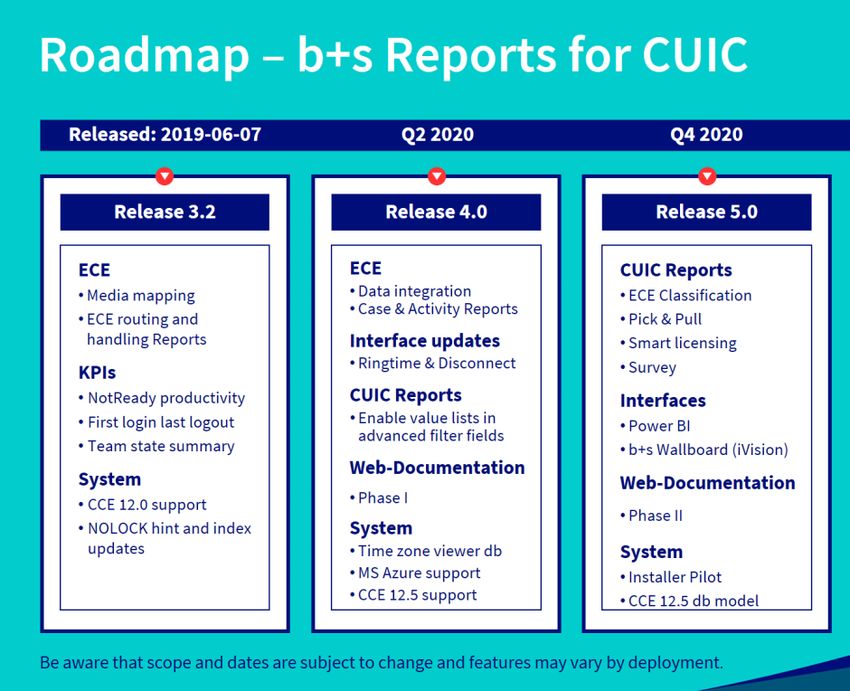
Multimedia Contact Reports
Contact performance reporting is available based on the contact start or end time (what could be
different dates for non-voice tasks) and includes the final outcome of the contact handling.
Knowing the completion duration allows to measure the Completion Level as well and not just
when agents started working on a task.
Completion means that the Completion Level also uses
contact was handled and the Service Level Threshold
completed by an agent
Enterprise CallTypes can be used
to create any media group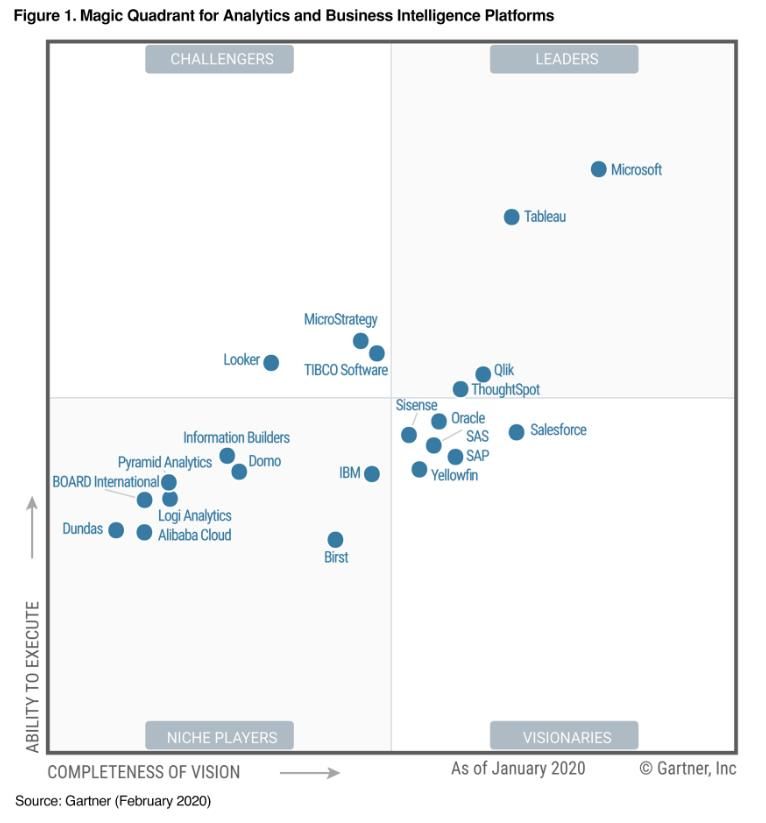
Roadmap – b+s Reports for CUIC
   Released: 2019-06-07                       Q2 2020                            Q4 2020                      Future

          Release 3.2                        Release 4.0                       Release 5.0                  Release X

    ECE                                ECE                                CUIC Reports                Installer & Licensing
    • Media mapping                    • Data integration                 • ECE Classification
                                       • Case & Activity Reports                                      Interfaces
    • ECE routing and                                                     • Pick & Pull
                                                                                                      • WebEx CC Analyzer
      handling Reports                 Interface updates                  • Smart licensing
    KPIs
                                       • Ringtime & Disconnect            • Survey                    Outbound
                                       CUIC Reports                                                   • Dialing List Status
    • NotReady productivity                                               Interfaces
                                       • Enable value lists in                                        • Call detail summary
    • First login last logout                                             • Power BI
                                         advanced filter fields
    • Team state summary                                                  • b+s Wallboard (iVision)   CVP Reporting
                                       Web-Documentation                                              • Data integration
    System                                                                Web-Documentation
                                       • Phase I                                                      • Self service
    • CCE 12.0 support
                                                                          • Phase II                  • Courtesy callback
    • NOLOCK hint and index            System
      updates                          • Time zone viewer db              System
                                       • MS Azure support                 • Installer Pilot
                                       • CCE 12.5 support                 • CCE 12.5 db model

Be aware that scope and dates are subject to change and features may vary by deployment.
Contact Center Insights with Microsoft‘s Power BI
Why Analytics Software?
Reporting vs. Analytics

                                                                                b+s Reports for CUIC
•   Reports for any area within the
    Contact Center
                                                                                                       More than
•   with different scope:                                    CUIC                                      100 reports
    •   RealTime
    •   Interval
                                             Contact Center Enterprise
    •   Daily
    •   Detail
    •   Configuration
                                      ..and how the managers and the data analysts
•   with different filter:              handle the 500 objects and 8000 rows limit?
    •   Agent                                                                                            Reporting
                                                        Why not..
    •   Team                                                                                             User
    •   Queue                         ..the whole Contact Center in a single Report?

    •   CallType                                   ..self service based?
    •   Contact
                                        ..without exporting data to get insights?
    •   Campaign
    •   etc.
Why Microsoft Power BI?
Source
https://www.gartner.com/doc/reprints?id=1-
3TXXSLV&ct=170221&st=sb&wt.mc_id=mkto_EM297495A1LA1+&ls=email&mkt_tok=eyJpIjoiTjJRMlpERTVNek5sTkRrdyIsInQiOiJFQTI5dGNxOTkxTU5ONG9kMkpm
N3FSY25vaEdMeDl3QmVvb2xqc3Vhb3Q2TWF4U3ZFa0NhVDR4ampES200WkJ3S0dCK0ZwcGdGa1wvRGljcTFtcGlDV2c9PSJ9Magical Database Compressing
180 GB 0.440 GB
Contact Center Power BI
b+s Reporting Database
Database DatabaseArchitecture and Storage Examples
Contact Center
Pre-Defined
Contact Center
pbix I: 0,014 GB
Data Model Visuals pbix II: 0,440 GB
400 days of data
12’000 avg calls per day
626 max. Concurrent Agents
Cisco
Contact Center Enterprise
Reporting Interface
for Power BI
b+s Reporting
HDS I: 25 GB Database Organization
HDS II: 180 GB Location
Segregation
bs_Reporting I: 2 GB
bs_Reporting II: 23 GBPower BI Licensing
Sources: https://powerbi.microsoft.com/de-de/pricing/#powerbi-comparison-table
https://dynamics.folio3.com/blog/difference-between-power-bi-pro-vs-free-vs-premium/#pro-premium-pro
Free Power BI Pro Power BI Premium
• Power BI Desktop only • $ 10 per month per user • $ 5’000 per month per instance
• Can’t share created reports with non- • max. 1 GB per dataset, max. 10 GB • max. 10 GB per dataset, total 100 TB
Power BI Pro users per user
• 48 refreshes per day
• No app workspaces • 8 refreshes per day
• provides a dedicated unit of capacity
• Share datasets, dashboards and for all users in the organization
reports with other Power BI Pro users
• Included in Office 365 Enterprise E5• Self service: access the full
data model and design your
own visuals
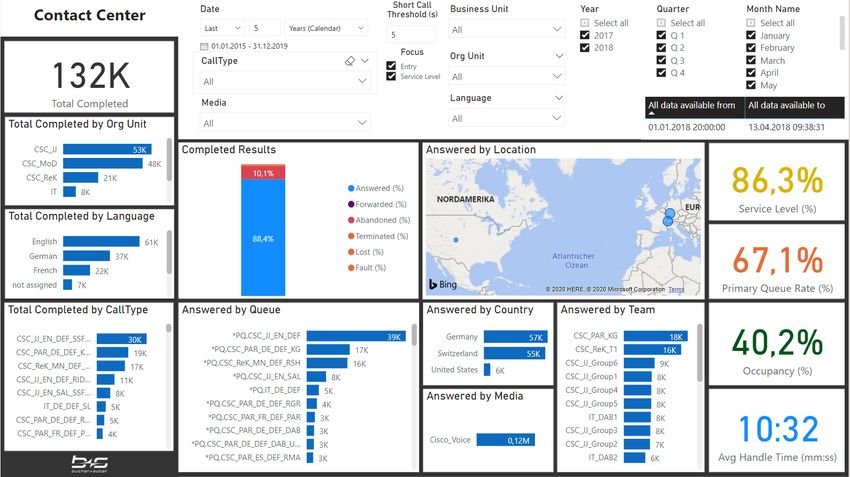
Demo
• Contact Center overview and
filter dimensions
• Insights in service level,
abandonments, recaller,
agent worktime &
performance• It’s quiet some work to build the right data
model and measures and you can do it
easily wrong
Conclusion • But once this is done, it’s just fun to work
with this data and you get quick insights
• That’s why we think about to offer an out-
of-the box analytics solution for the
Contact Center
• ..that could be easily extended with
additional data from any data source to
your BI solutionwww.bucher-suter.com
You can also read