South African Gas Master Plan: Basecase Report (v 01)
←
→
Page content transcription
If your browser does not render page correctly, please read the page content below
South African Gas Master Plan: Basecase Report (v 01)
DEPARTMENT OF MINERAL RESOURCES AND ENERGY

           GAS MASTER PLAN 2022

             BASE CASE REPORT

        STAKEHOLDER CONSULTATION

              September 2021
South African Gas Master Plan: Basecase Report version 01
Revision Control
Rev Date Purpose/Comments Contact Person
NEDLAC Consultation /Gas Master Plan
basecase report.
V02 18.11.2021 AT Audat Signed: Chief Director
(Planning)
Department of Mineral
Resources and Energy
Rev.
1
Document Title Document Classification Status
Base Case Document NEDLAC Consultation Document Final
Page
ii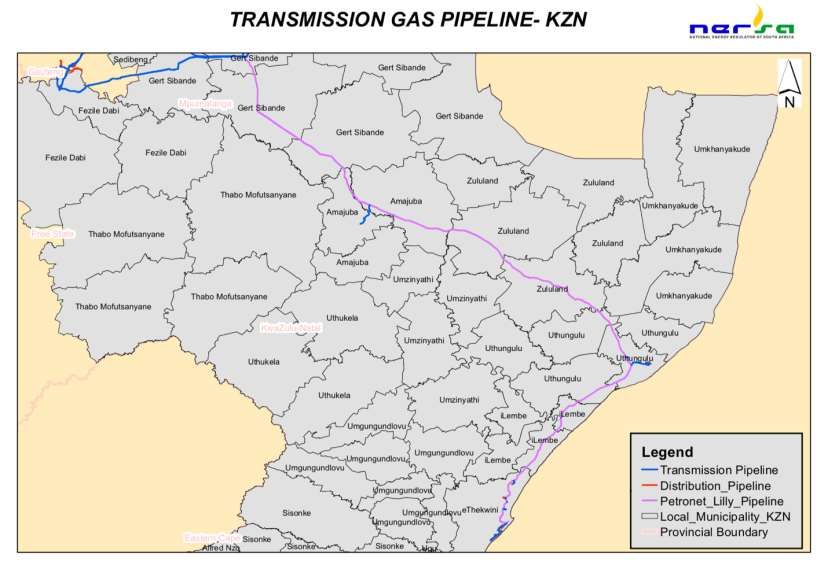
South African Gas Master Plan: Basecase Report version 01
Table of Contents
1. Introduction ....................................................................................... 1
1.1. Background ....................................................................................... 1
1.2. Document Purpose .............................................................................. 1
1.3. Report Limitation ................................................................................ 2
2. Natural Gas as Energy Source ............................................................... 2
3. South African Gas Sector...................................................................... 3
3.1. Upstream Gas Sector ...................................................................... 5
3.2. Midstream Gas Sector ..................................................................... 5
3.3. Downstream Gas Sector .................................................................. 5
3.4. Gas Sector Prices and Tariffs .......................................................... 6
3.4.1. Gas Prices ................................................................................. 7
3.4.2. Gas Tariffs ................................................................................ 7
4. Gas Supply and Production ............................................................. 8
4.1. Domestic Gas Reserves and Resources ........................................... 8
4.1.1. Orange Basin .......................................................................... 10
4.1.2. Bredasdorp Basin .................................................................... 10
4.1.3. Outeniqua Basin ..................................................................... 10
4.1.4. Witwatersrand Basin .............................................................. 11
4.1.5. Durban and Zululand Basins ................................................... 11
4.1.6. Unconventional ....................................................................... 12
4.2. Regional Gas Reserves and Resources .......................................... 13
4.2.1. Angola .................................................................................... 14
4.2.2. Botswana ................................................................................ 14
4.2.3. Mozambique............................................................................ 14
4.2.4. Namibia .................................................................................. 16
4.2.5. Tanzania ................................................................................. 17
Rev.
1
Document Title Document Classification Status
Base Case Document NEDLAC Consultation Document Final
Page
iii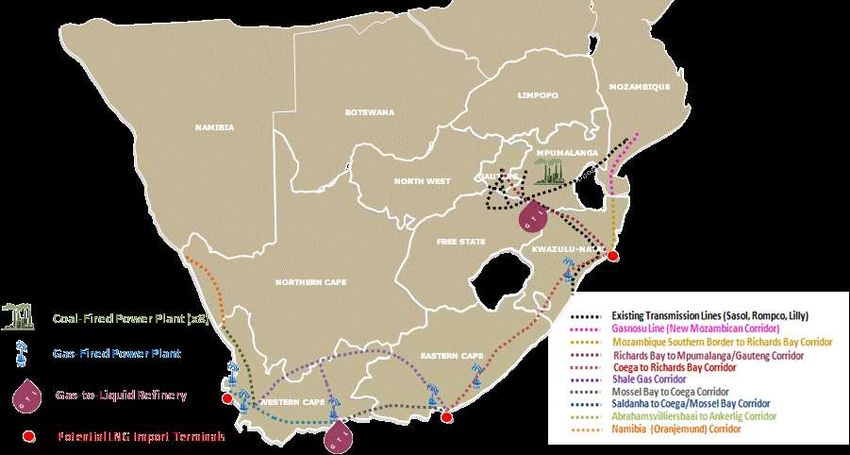
South African Gas Master Plan: Basecase Report version 01
4.2.6. Zimbabwe ............................................................................... 17
4.3. Global Gas Reserves and Resources .............................................. 18
5. Gas Utilisation Options.................................................................. 20
5.1. Power Sector ................................................................................ 21
5.2. Non-Power Sectors ....................................................................... 22
5.2.1. Industrial Sector ..................................................................... 22
5.2.2. Transport Sector ..................................................................... 23
5.2.3. Residential/Commercial Sector .............................................. 24
5.2.4. Petrochemical Sector .............................................................. 24
5.2.5. Export Sector .......................................................................... 24
6. Gas Demand .................................................................................. 25
6.1. Existing Gas Demand .................................................................... 25
6.1.1. Gas Importation...................................................................... 25
6.1.2. Gas Domestic Production ........................................................ 25
6.2. Gas Demand Forecasting .............................................................. 26
6.3. Future Gas Demand from Power Sector ........................................ 27
6.4. Future Gas Demand from Non-Power Sectors ............................... 28
6.4.1. Petroleum Sector .................................................................... 28
6.4.2. Transport Sector ..................................................................... 29
6.4.3. Industrial Sector ..................................................................... 30
7. Gas Infrastructure ........................................................................ 31
7.1. Existing Infrastructure and Short-Term Plans .............................. 31
7.1.1. Transmission Network ............................................................ 31
7.1.2. Distribution Network .............................................................. 32
7.1.3. Reticulation Network .............................................................. 33
8. Regulatory Framework ................................................................. 33
8.1. South Africa Regulatory Overview ................................................ 34
8.1.1. Established Regulatory Framework......................................... 34
8.1.2. Gas Regulator ......................................................................... 35
Rev.
1
Document Title Document Classification Status
Base Case Document NEDLAC Consultation Document Final
Page
iv
South African Gas Master Plan: Basecase Report version 01
8.1.3. Domestic Gas Policies ............................................................. 35
8.1.4. Enablers .................................................................................. 35
8.1.5. Established Bilateral Agreements ........................................... 36
8.1.6. Legislative Gaps, Overlaps and Barriers .................................. 36
9. Gas Economy and Roadmap ......................................................... 37
9.1. National PESTEL Analysis .............................................................. 37
9.1.1. Political Factors ...................................................................... 37
9.1.2. Economic Factors .................................................................... 38
9.1.3. Social Factors ......................................................................... 40
9.1.4. Technological Factors ............................................................. 41
9.1.5. Environmental Factors ............................................................ 41
9.1.6. Legal Factors .......................................................................... 41
9.2. National SWOT Analysis ................................................................ 44
9.3. Gas Balance .................................................................................. 46
9.3.1. Role of Gas in National Development ...................................... 46
9.3.2. Gas Allocation Guiding Principles ............................................ 46
9.4. Gas Economics .............................................................................. 48
9.4.1. Mode of Transport................................................................... 48
9.4.2. Trade Viability ........................................................................ 50
9.4.3. Supply and Demand Scenarios ................................................ 53
9.4.4. Potential Natural Gas Corridors .............................................. 56
9.4.5. Natural Gas Trading Hubs ....................................................... 58
9.4.6. LNG Landed Cost ..................................................................... 58
10. References .................................................................................... 61
Rev.
1
Document Title Document Classification Status
Base Case Document NEDLAC Consultation Document Final
Page
v
South African Gas Master Plan: Basecase Report version 01
Table of Tables
Table 9-1: National Gas Value Chain SWOT Analysis ...................................... 45
Table 9-2: Natural Gas Trade Viability – SADC Countries ............................... 51
Table 9-3: Natural Gas Trade Viability - Non-SADC Countries ........................ 52
List of Figures
Figure 3-1: Gas Value Chain: Natural Gas Business ......................................... 4
Figure 3-2: South African Natural Gas Value Chain .......................................... 4
Figure 3-3: South African Piped-Gas Total Charge Composition ....................... 6
Figure 4-1: Domestic Gas Reserves ................................................................. 9
Figure 4-2: SADC Regional Gas Supply Options ............................................. 13
Figure 4-3: Global Natural Gas Proven Reserve Percentage Distribution ........ 18
Figure 4-4: Global Liquified Natural Gas Exporters Percentage Distribution ... 19
Figure 4-5: Potential LNG Supply Project FIDs in 2019-2023 ......................... 19
Figure 4-6: 2018 Major Natural Gas Trade Movement .................................... 20
Figure 6-1: SSA Natural Gas LEAP Forecast ................................................... 27
Figure 6-2: South Africa's Petroleum Product Resources ............................... 29
Figure 7-1: Main Natural Gas Transmission and Distribution Pipelines........... 31
Figure 9-1: PESTEL Analysis' Dimension ........................................................ 43
Figure 9-2: SWOT Analysis’ Dimensions ........................................................ 44
Figure 9-3: Methods of Moving Natural Gas to Market ................................... 48
Figure 9-4: Natural Gas Transport - Volume vs. Distance............................... 49
Figure 9-5: Power Sector Supply and Demand Map ....................................... 54
Figure 9-7: Potential Natural Gas Corridors ................................................... 57
Figure 9-8: Natural Gas and LNG Spot Price Statistics ................................... 58
Figure 9-9: World LNG Estimated Landed Prices – March 2021 ...................... 59
Appendices
Appendix A : Exploration and Production Activities and Rights Holder
Appendix B : Natural Gas Licensees
Appendix C : Natural Gas Pipeline Infrastructure
Appendix D : Historical Data World LNG Estimated Landed Prices
Rev.
1
Document Title Document Classification Status
Base Case Document NEDLAC Consultation Document Final
Page
vi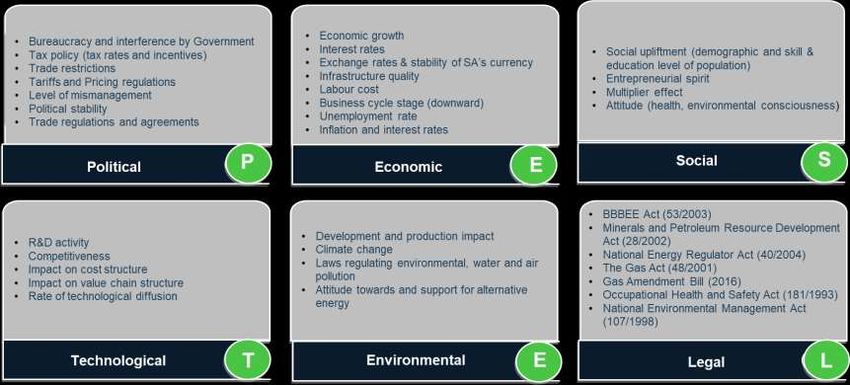
South African Gas Master Plan: Basecase Report version 01
Abbreviations
BOT Build-Operate-Transfer
BOOT Build-Own-Operate-Transfer
CBM Coal Bed Methane
CNG Compressed Natural Gas
CTL Coal-to-Liquid
DNG Delta Natural Gas
E&P Exploration and Production
EC Eastern Cape
ENH Empresa Nacional de Hidrocarbonetos
EPC Engineering, Procurement and Construction
EWURA Energy and Water Utilities Regulatory Authority
FS Free State
FET Further Education and Training
FID Final Investment Decision
FSRU Floating, Storage and Regasification Unit
GDP Gross Domestic Product
Rev.
1
Document Title Document Classification Status
Base Case Document NEDLAC Consultation Document Final
Page
vii
South African Gas Master Plan: Basecase Report version 01
GP Gauteng Province
GTL Gas-to-Liquid
GTW Gas-to-Wire
IEP Integrated Energy Plan
IGUA-SA Industrial Gas Users Association – South
IMO International Maritime Organization
INP Institute of National Petroleum
IOC International Oil Companies
IRP Integrated Resource Plan
KZN KwaZulu-Natal
LNG Liquefied Natural Gas
LEAP Long-range Energy Alternatives Planning
LP Limpopo
LPG Liquefied Petroleum Gas
MP Mpumalanga
MPRDA Mineral and Petroleum Resources Development Act
NDP National Development Plan
NERSA National Energy Regulator of South Africa
Rev.
1
Document Title Document Classification Status
Base Case Document NEDLAC Consultation Document Final
Page
viiiSouth African Gas Master Plan: Basecase Report version 01
NG Natural Gas
NGC Natural Gas Compression
PASA Petroleum Agency SA
PEPDA Petroleum Exploration Development and Production
Agreement
PPA Petroleum Production Agreement
PSA Production Sharing Agreement
PURA Petroleum Upstream Regulatory Authority
RFO Residual Fuel Oil
RMIPPPP Risk Mitigation Independent Power Producer Procurement
Programme
ROMPCO Republic of Mozambique Pipeline Company (joint venture
company between Central Energy Fund (SA Government),
Companhia Mozambicana de Gasoduto S.A (Mozambique
Government) and Sasol Gas Holdings.
SA South Africa
SAB South African Breweries
SABOA South African Bus Operators Association
SADC Southern Africa Development Community
SEA Strategic Environmental Assessment
SEPI Sasol Exploration and Production International
Rev.
1
Document Title Document Classification Status
Base Case Document NEDLAC Consultation Document Final
Page
ixSouth African Gas Master Plan: Basecase Report version 01
SPA Sales and Purchase Agreement
SSA Sub-Saharan Africa
TRT Tshwane Rapid Transit
US United States
VAT Value-Added Tax
WC Western Cape
Rev.
1
Document Title Document Classification Status
Base Case Document NEDLAC Consultation Document Final
Page
xSouth African Gas Master Plan: Basecase Report version 01
Conversion Factors
To convert
Natural Gas & LNG
Billion cubic Billion cubic feet Million tonnes oil Million tonnes Trillion British Million barrels oil
meters NG NG equivalent LNG thermal units equivalent
From Multiply by
1 billion cubic meters
1.000 35.315 0.860 0.735 34.121 5.883
NG
1 billion cubic feet NG 0.028 1.000 0.024 0.021 0.966 0.167
1 million tonnes oil
1.163 41.071 1.000 0.855 39.682 6.842
equivalent
1 million tonnes LNG 1.360 48.028 1.169 1.000 46.405 8.001
1 trillion British
0.029 1.035 0.025 0.022 1.000 0.172
thermal units
1 million barrels oil
0.170 6.003 0.146 0.125 5.800 1.000
equivalent
Rev. 1
Page xiSouth African Gas Master Plan: Basecase Report version 01
1. Introduction
1.1. Background
The National Development Plan (NDP) envisions that by 2030 South Africa will have an energy sector that
promotes economic growth and development through adequate investment in energy infrastructure.
At just 2.6% of the country’s total energy mix, South Africa’s natural gas market is small, but with all its inherent
benefits, it has the potential to completely change the economy by stimulating economic growth and
development, stability, and job creation.
The meaningful addition of natural gas to the country’s energy mix will rejuvenate an overburdened, out-dated
energy infrastructure and reduce cyclical energy shortfalls. Perhaps even more importantly, it will stimulate
the economy by allowing business and industry to lower their energy and operational spend while also creating
significant numbers of new jobs and skills development opportunities.
Considering that nearly 90% of South Africa’s existing natural gas demand is supplied by a single entity,
namely Sasol Gas, the associated economic and employment risks of limited supply options, development
and sourcing of alternative natural gas resources are high. It is imperative to ensure economic and
employment stability within the natural gas sector by introducing more suppliers.
Southern Africa’s gas potential has been revealed by major discoveries that, when developed, widen options
for greater regional energy trade. South Africa’s unconventional gas potential remains to be quantified but
raises the prospect of possible domestic production in the longer term. Globally the natural gas industry has
moved into a supply surplus, favouring a larger role for gas as a clean fossil fuel in many countries’ energy
policies.
A challenge in developing the gas sector is to bring gas demand and supply on stream at the same time and
spread geographically to stimulate broader localized demand through South Africa. Without such localized
gas demand, it is difficult to develop distributed gas supply and without such distributed gas supply it is difficult
to develop localized gas demand. One way of breaking this impasse is to create significant “anchor” gas
demand through the development of a gas-to-power programme. In pursuit of adding generating capacity,
lowering carbon emissions, enhancing energy security and supporting industrial development, South Africa
has taken the first steps in a gas-to-power programme to be executed under the Integrated Resource Plan
2019, aiming to increase the national energy mix natural gas contribution from 2.6% to 15.7% by 2030.
1.2. Document Purpose
The purpose of this document is to establish baseline information for the natural gas sector in South Africa
and to outline the Gas Master Plan roadmap. Such baseline information includes an overview of the gas value
Rev.
II
Document Title Document Classification Status
Base Case Document NEDLAC Consultation Document First Draft
Page 1South African Gas Master Plan: Basecase Report version 01
chain and regulatory framework, hence it is named basecase report. The report will also set the scene for the
Gas Master Plan development process.
The Gas Master Plan document, once developed, will serve as a policy instrument, providing a roadmap for
taking strategic, political and institutional decisions which will guide industry investment planning and
coordinated implementation.
1.3. Report Limitation
At the time of finalizing this report the Department was yet to procure a suitable modelling tool to model the
current gas sector in the country as well as to develop immediate sector expansion scenarios. This work is
current underway and will be published in due course, together with natural gas demand projections.
2. Natural Gas as Energy Source
Natural gas is an abundant and integral part of the world’s energy supply, accounting for nearly 24% of 2018’s
global primary energy consumed (BP Statistical Review of World Energy, 2020). When burned, natural gas is
one of the cleanest and most powerful forms of energy available. Considering that only 2.6% of South Africa’s
primary energy needs are currently sourced from natural gas and Government’s international climate change
and carbon reduction commitment, exploitation of natural gas will play an integral part of South Africa’s future
energy mix diversification.
Natural gas is a fossil fuel naturally occurring as a gaseous mixture of light hydrocarbons in sedimentary rocks.
Though it primarily consists of methane, there are other hydrocarbons that contribute to the makeup of natural
gas and after natural gas is refined, those individual hydrocarbons can be used as various sources of energy.
Natural gas can be contained in a variety of different types of deposits that must be accessed if the natural
gas is to be used. Natural gas has been extracted from conventional natural gas deposits for a long time, while
the unconventional resources are resources that are being extracted using newly developed techniques.
Conventional resources are "pockets" of gas contained within relatively porous rock and are the most easily
mined. Conventional gas has been extracted for many years and is the cheapest to extract, yielding the largest
returns. While newer technologies like hydraulic fracturing have allowed for more expansive access to these
deposits, they can be mined without its use.
Unconventional resources are made up of natural gas resources which are not readily available as
conventional natural gas and have only been explored and extracted as energy resources in the last couple
of decades. These unconventional resources consist of the following proven types of resources:
Rev.
II
Document Title Document Classification Status
Base Case Document NEDLAC Consultation Document First Draft
Page 2South African Gas Master Plan: Basecase Report version 01
• Coal bed methane is natural gas consisting mostly of methane, which is trapped inside coal seams.
This is extracted while the coal is being mined, as diminishing the pressure in the coal seam allows
the gas to flow out of the seam and into a wellbore, where it is extracted.
• Shale gas is natural gas found inside a fine-grained sedimentary rock called shale. Shale is porous,
but it is non-permeable, which means the gas cannot flow through it. Shale gas requires the use of
hydraulic fracturing for extraction.
• Biogenic gas is formed at shallow depths and low temperatures by anaerobic bacterial decomposition
of sedimentary organic matter. Biogenic gas consists almost entirely of methane and is unrelated to
the processes that form oil.
• Landfill gas is a natural by-product of the decomposition of organic material in landfills. When
municipal solid waste is first deposited in a landfill, it undergoes an aerobic decomposition stage and
within one year, methane-producing bacteria begin to decompose the waste and generate methane.
Instead of escaping into the air, landfill gas can be captured, converted and used as a renewable
energy source, generating revenue and creating jobs in the community.
• Biogas is a type of biofuel that is naturally produced from the decomposition of organic waste, such
as municipal wastewater and solid waste, industrial wastewater and agricultural waste. Anaerobic
digestion is a natural form of waste-to-energy that uses the process of fermentation to break down
organic matter. Biogas is known as an environmentally friendly energy source, alleviating the global
waste epidemic and reliance on fossil fuel for energy.
Landfill gas and biogas are not classified as natural gas reserves but can be used as an energy source
for gas, electricity, heat and transportation due to the high content of methane.
3. South African Gas Sector
The gas industry encompasses a range of different activities and processes which jointly contribute to the
transformation of underlying resources into useable end-products valued by industrial and private customers.
The physical workflow architecture for the natural gas business is built around a capital-intensive asset base.
The assets of each of the three principal business segments are held by exploration and production (E&P)
companies (upstream), gas transmission providers (midstream) and local distribution companies
(downstream). Figure 3-1 depicts a typical natural gas business value chain.
Rev.
II
Document Title Document Classification Status
Base Case Document NEDLAC Consultation Document First Draft
Page 3South African Gas Master Plan: Basecase Report version 01
Figure 3-1: Gas Value Chain: Natural Gas Business
The value/business chain is divided into upstream, midstream and downstream components.
The upstream sector of the value chain contains the exploration and production section of gas
fields. The processes and activities involved in the upstream sector are exploration, field
development and production operations. The midstream sector of the value chain is focused on
transportation, processing and storage of natural gas, while the downstream sector involves
distribution of natural gas to the end market. The current South African natural gas value chain
structure, and associated dominant players, is depicted in Figure 3-2.
Figure 3-2: South African Natural Gas Value Chain
Rev.
II
Document Title Document Classification Status
Base Case Document NEDLAC Consultation Document First Draft
Page 4South African Gas Master Plan: Basecase Report version 01
3.1. Upstream Gas Sector
PetroSA, Sasol Exploration and Production International (SEPI) and Tetra4 are the E&P
companies currently involved in the upstream gas business sector.
The national natural gas demand is predominantly met through importation of natural gas from
Sasol’s Pande and Temane gas fields located in Mozambique. PetroSA has an indigenously
produced offshore gas supply to the Gas-to-Liquid (GTL) plant located in Mossel Bay and Tetra4
is supplying natural gas extracted and compressed in Virginia to their customer, Megabus.
PetroSA’s current indigenous offshore gas reserve is estimated to be depleted by 2029, while
Sasol’s Pande and Temane gas supply to South Africa is expected to decline by September 2023
if additional investments to extend the production plateau are not approved (Sasol Limited,
2018) (De Lange, 2019) (Smit, 2019).
3.2. Midstream Gas Sector
PetroSA has a transmission line leading from the FA platform to the GTL refinery in Mossel Bay.
However, PetroSA does not operate as a gas transmission company since its offshore gas
transmission pipeline is dedicated for own use.
Sasol Gas, ROMPCO and Transnet are the only transmission companies functioning within the
midstream gas business sector in South Africa.
There are transmission pipelines distributing natural gas from Mozambique via the ROMPCO
supply line, running from Secunda to Gauteng and finally down to Durban via Transnet’s Lilly
pipeline.
The ROMPCO pipeline allows for third party access along its transmission route, connecting
South Africa to Mozambique. This transmission infrastructure presents a corridor opportunity
for anyone who has secured natural gas in Mozambique and is willing to pay transport charges.
At present, above ground natural gasholder facilities are the only type of natural gas storage in
South Africa. Egoli Gas’ main storage-station is located at Cottesloe, with three larger gasholders
capable of storing around 0.00000001 tcf of natural gas. Secondary smaller storage facilities,
with seven high-pressure gas vessels, are situated at Langlaagte.
3.3. Downstream Gas Sector
South Africa currently has one purpose-built GTL refinery situated in Mossel Bay, with a design
capacity of 45,000 bbl/day. The GTL refinery operation is currently limited to one reformer and
one synthol train mode because of the declining gas reserves.
Rev.
II
Document Title Document Classification Status
Base Case Document NEDLAC Consultation Document First Draft
Page 5South African Gas Master Plan: Basecase Report version 01
The Sasol Secunda and Sasolburg Coal-to-Liquid (CTL) facilities were adapted to accept natural
gas as feedstock. The Sasolburg facility was eventually converted to only operate on natural
gas.
Distribution and trading companies participating in the national downstream gas sector include
Sasol Gas, Spring Lights Gas, Novo Energy and NGV Gas, Virtual Gas Network, Tetra4, Egoli
Gas, Columbus Steel, Phambili Gas, Zemvelo Gas and Iliza Gas.
Sasol Gas has a competitive advantage within the downstream gas business sector, being the
only supplier of gas and thus exhibiting a price advantage over other traders. Appendix B
contains the list of National Energy Regulator of South Africa (NERSA) - approved natural gas
licensees (NERSA, 2021).
3.4. Gas Sector Prices and Tariffs
The Gas Act (Act 48 of 2001) makes a clear distinction between gas prices (charge for a gas
molecule) and gas tariffs (charge for network or gas service). Gas charges in South Africa
comprise of both prices and tariffs. Figure 3-3 illustrates the composition of the total charges
for piped-gas in South Africa.
Figure 3-3: South African Piped-Gas Total Charge Composition
NERSA is guided by piped-gas regulations when monitoring and approving piped-gas trading
margins. The regulations provide that gas prices must enable the licensee to recover all efficient
and prudently incurred investment and operational costs and make a profit commensurate with
Rev.
II
Document Title Document Classification Status
Base Case Document NEDLAC Consultation Document First Draft
Page 6South African Gas Master Plan: Basecase Report version 01
its risk. The methodology to approve maximum prices for piped-gas in South Africa makes
provision for the gas trader to recover the transmission and distribution tariffs.
3.4.1. Gas Prices
Section 21 of the Gas Act (48/2001) provides that NERSA should regulate prices in the event of
inadequate competition as contemplated in Chapters 2 and 3 of the Competition Act ( Act 89 of
1998). Therefore, a competition assessment ought to be conducted before regulation of prices
in terms of the Gas Act (48/2001).
NERSA has developed a new methodology for approving maximum prices for gas in South Africa.
The methodology provides for two approaches, as detailed below.
3.4.1.1 Competitive Benchmarking
The competitive benchmarks used, include the Henry Hub, the Title Transfer Facility (TTF) Platts
and the National Balancing Point (NBP). Gas prices in these trading hubs are largely determined
by the interplay between supply and demand and are therefore suitable benchmark hubs against
which a gas price, that seeks to mimic competition, can be linked.
This is the maximum price of the existing gas and it is the maximum value of gas at the point
of its first entry into the transmission or distribution system.
3.4.1.2 Pass Through of Costs
The pass through of costs will be used by third party traders and importers of Liquified Natural
Gas (LNG). The approach requires a passing through of costs, which include:
• Gas acquisition cost;
• Calculated trading cost;
• Appropriate margin (benchmarked to Japan Korea Marker (JKM) for LNG);
• Shipping and/or regasification costs;
• Transmission tariffs; and
• Distribution tariffs.
3.4.2. Gas Tariffs
A tariff is a charge for the infrastructure services provided for the transmission of gas via pipeline
or storage of gas in various forms, including LNG storage tanks and compressed natural gas
storage facilities. The regulation of tariffs is not subject to an inadequate competition finding.
NERSA’s guidelines for monitoring and approving transmission and storage tariffs allow for:
Rev.
II
Document Title Document Classification Status
Base Case Document NEDLAC Consultation Document First Draft
Page 7South African Gas Master Plan: Basecase Report version 01
• Rate of return regulation;
• Incentive regulation (price and revenue caps);
• Hybrid approaches (rate of return and incentive regulations);
• Profit share or sliding scales; and
• Discounted cash flow model of allowable revenue.
The rate of return and discounted cash flow methodologies are used to encourage entry and
investment, allowing investors to recover costs and make a fair return on investments.
4. Gas Supply and Production
4.1. Domestic Gas Reserves and Resources
Ten countries hold more than two-thirds of the world’s total proven natural gas reserves
according to the latest publications by US EIA, OPEC and BP. Although South Africa does not
currently feature on any of the published proven natural gas reserve lists, the country has the
potential to rank amongst the top 30 countries, provided the initial gas estimates, specifically
unconventional natural gas reserves, hold true (BP Statistical Review of World Energy, 2020)
(EIA, 2019) (OPEC, 2019).
South Africa has several natural gas opportunities for local natural gas production, either from
conventional (onshore/offshore) or unconventional (shale gas/coal bed methane) sources. Refer
to Figure 4-1 for a simplified graphical representation of the domestic gas fields and their
quantified reserve volumes. A map indicating the locations of these reserves and ongoing
exploration activities along with the list of current exploration rights holders are available in
Appendix A (Petroleum Agency SA, 2021). Appendix A provide further details of South Africa’s
gas resources.
Rev.
II
Document Title Document Classification Status
Base Case Document NEDLAC Consultation Document First Draft
Page 8South African Gas Master Plan Consultation Document
Figure 4-1: Domestic Gas Reserves
Rev. II
Page 9
Document Title Document Classification Status
Base Case Document NEDLAC Consultation Document First DraftSouth African Gas Master Plan Consultation Document
4.1.1. Orange Basin
The Orange Basin forms part of the Southwest African Coastal Basin, which lies offshore Namibia
and western South Africa.
Ibhubesi is the most significant play in the South African portion of the Orange Basin to date.
Independently certified gas reserves have been certified at 0.54 tcf (2P), with the best estimate
perspectivity certified to be close to 8 tcf of gas. Ibhubesi Gas Projects were in negotiations with
Eskom for the provision of gas to the existing Ankerlig Power Station, the DMRE Independent
Power Producer procurement program, as well as other major industrial users (SAOGA, 2017).
It is suggested that the Kudu-type play extends southwards into the South African portion of
the Orange Basin, with the play currently being explored by companies with concessions over
the northern and central parts of the Orange Basin.
4.1.2. Bredasdorp Basin
Petro SA has secured nearly 1.39 tcf gas and 0.22 tcf condensate feedstock for the GTL refinery
from the F-A and Satellites, E-M, South Coast Gas and F-O gas fields (Ross, 2019).
Project Ikhwezi forms part of PetroSA’s plan to secure additional reserves to sustain the Mossel
Bay GTL refinery. Project Ikhwezi was expected to yield 0.24 tcf of gas though five wells
(PetroSA, 2016). The production volume recorded from December 2013 until 31 March 2019,
was 0.05 tcf, through three wells from the F-O gas field. The remaining F-O gas field reserve is
estimated at 0.01 tcf (2P) and 0.01 tcf (2P) contingent resources (tailgas). The reserve is
expected to sustain GTL operations until end-2029, but there remain further undeveloped
contingent resources available in the F-O field (De Lange, 2019).
4.1.3. Outeniqua Basin
Total and its partners announced early February 2019 that a significant gas condensate
discovery had been made in Block 11B/12B, 175 km off the southern coast. The Brulpadda
project’s reserve is estimated at approximately 6 tcf of gas and condensate. On 28 October
2020, Total and its partners announced a significant gas condensate discovery on the Luiperd
Prospect, with Project Paddavissie’s gas potential estimated in the range of 3 tcf (2P).
Geophysical estimates have suggested 3 tcf (2P) of the potential gas reserves (Brulpadda and
Luiperd) can be recovered (Broyard, 2021).
The most probable use for the gas would be to serve as feedstock to PetroSA’s GTL plant, due
to proximity to existing infrastructure from the FA platform to Mossel Bay. The Brulpadda or
Paddavissie field could substitute the GTL plant’s current waning gas reserve, preventing the
plant from shutting down and the associated loss of jobs and infrastructure in South Africa.
Rev.
II
Document Title Document Classification Status
Base Case Document NEDLAC Consultation Document First Draft
Page
10South African Gas Master Plan Consultation Document
The current timeline involves studying of the possible development schemes, with the objective,
subject to approval by partners and government, to produce gas by the end of 2025 (Broyard,
2021).
4.1.4. Witwatersrand Basin
The biogenic gas resource probable recoverable volume has been estimated at 0.13 tcf (2P),
with associated helium reserves valued at 0.003 tcf. Tetra4, a subsidiary of Renergen, has
reserved the rights to develop the onshore gas field situated near the town of Virginia, in the
Free State province.
Given the unusual nature of this unconventional play, commercial exploitation of biogenic gas
has become a reality with business opportunities for compressed natural gas (CNG) and liquefied
natural gas (LNG) production, power generation supply and helium for industrial applications.
LNG produced from both Phase 1 and Phase 2 is earmarked for the domestic market. Phase 1
gas supply has already been contracted to Total for its downstream retail arm as trucking fuel
to replace diesel, and is expected to come online in 2021, delivering approximately 2,500 GJ
LNG daily (Renergen, 2021).
4.1.5. Durban and Zululand Basins
The offshore Durban and Zululand Basins became of interest to the oil and gas industry following
large discoveries along the eastern margin of Africa, most notably in Tanzania and Mozambique.
The Petroleum Agency’s gas-in-place prospective evaluation is estimated at 4 tcf (Petroleum
Agency SA, 2012).
Eni South Africa BV (Eni), and Sasol Africa Limited (Sasol) hold an Exploration Right off the East
Coast of South Africa and are in the process of obtaining final approval for conducting an
exploration drilling programme in Block ER236 (12/3/236) to assess the commercial viability of
the hydrocarbon reservoir for future development. The drilling program proposed by Eni is to
drill at least one exploration well within the northern or southern areas of interest in the short
term. If the first exploration well shows a hydrocarbon discovery, up to two exploration drilling
wells at different locations and up to three appraisal wells will follow (ERM, 2018).
In 2019, 47 interested and affected parties filed appeals against the deep-sea exploration drilling
endeavour, which has delayed final approval of the exploration drilling programme. On 17
December 2020, the Minister of Environment, Forestry and Fisheries dismissed 47 appeals
challenging the authorisation to proceed with drilling, which could see a deep-water wildcat spud
off KwaZulu-Natal as early as 2022, provided regulatory approval of the renewal exploration
application is received.
Rev.
II
Document Title Document Classification Status
Base Case Document NEDLAC Consultation Document First Draft
Page
11South African Gas Master Plan Consultation Document
4.1.6. Unconventional
4.1.6.1 Shale Gas
The southern Main Karoo Basin is the most prospective area for shale gas in South Africa.
Exploration right applications have been received from Shell International, Falcon Oil and Gas,
in partnership with Chevron and Bundu Gas. The shale as resource in the Karoo Basin is
unknown, due to the scarcity of relevant geoscientific data, but the preliminary estimate of the
technically recoverable resource is speculated to be 30 tcf (2C) ( Gas Strategies Group, 2017)
(PASA, 2019).
A major investment in infrastructure of this remote and arid region of South Africa will be
required to ensure economic viability. These reserves have not reached commercial extraction,
and their economic viability is still to be confirmed.
4.1.6.2 Coal Bed Methane
There is great interest in the coal bed methane (CBM) potential of South Africa’s Ecca Group
coal deposits in the north-eastern Main Karoo Basin. The most significant exploration work
conducted in the northern Karoo Basin has occurred in Lephalale, Mopane and Ermelo coalfields.
Lephalale Basin is the country’s most promising target for CBM exploration at present. Anglo
Thermal Coal has reported a technically recoverable reserve of 1 tcf, with the Petroleum
Agency’s gas-in-place evaluation estimated at 4 tcf (2C) (PASA, 2019).
Springbok Flats Basin is largely untested, and the Petroleum Agency’s gas-in-place estimation
is in the order of 2 tcf (2C) (PASA, 2019).
Mopane Sub-Basin, in the Soutpansberg Basin, is considered favourable for the occurrence of
CBM, similar to the successfully developed Lephalale Basin. The Petroleum Agency’s gas-in-
place estimation is in the order of 1.2 tcf (2C). The exploration license is held by Sunbird (74%)
and Umbono (26%), with newly drilled data suggesting a resource potential of 1.9 tcf (PASA,
2019).
Tshipise-Pafuri Sub-Basin, in the Soutpansberg Basin, is also considered favourable for the
occurrence of CBM. The Petroleum Agency’s gas-in-place estimation is in the order of 1.6 tcf
(2C) (PASA, 2019).
Tuli Basin is considered favourable for the occurrence of CBM, and the Petroleum Agency’s gas-
in-place estimation is in the order of 1.4 tcf (2C) (PASA, 2019).
Ermelo Coalfields comprises of Amersfoort Gas Project, which is the most promising target for
CBM production, since the area is nearby existing coal-based energy and power generation
Rev.
II
Document Title Document Classification Status
Base Case Document NEDLAC Consultation Document First Draft
Page
12South African Gas Master Plan Consultation Document
infrastructure and within proximity to major industrial, mining and manufacturing areas. Afro
Energy has drilled 21 exploration core holes and prospective resources are estimated to be
approximately 2.4 tcf (2C) of gas-in-place (PASA, 2019).
Highveld Coalfields is considered favourable for the occurrence of CBM and based on the
Petroleum Agency’s evaluation, could potentially host gas-in-place resources in order of 2.5 tcf
(2C) (PASA, 2019).
4.1.6.3 Biogenic Gas
Gas encountered within the coal-bearing Karoo strata in the region is believed to have migrated
from the underlying Witwatersrand Basin, which is biogenic in origin and is thus constantly
replenished. Given the unusual nature of this unconventional biogenic play, the volume of
technically recoverable gas resource has not yet been quantified.
4.2. Regional Gas Reserves and Resources
Four of the largest potential natural gas producing countries in Africa, namely Zimbabwe,
Mozambique, Namibia and Botswana, are neighbouring South Africa. Due to the proximity,
sourcing from these countries would be ideal. South Africa also has the opportunity for regional
supply from Angola and Tanzania. Figure 4-2 presents a graphical illustration of the geographical
locations of the potential South African Development Community (SADC) natural gas supply
countries.
Figure 4-2: SADC Regional Gas Supply Options
Rev.
II
Document Title Document Classification Status
Base Case Document NEDLAC Consultation Document First Draft
Page
13South African Gas Master Plan Consultation Document
4.2.1. Angola
The Angola LNG project, situated in Soyo in the Zaire district, became operational in early 2013.
The project is the result of a partnership between Sonangol, Chevron, BP, ENI and Total, to
collect, process and launch 0.25 tcf of LNG in the global market annually. The facility utilizes
associated gas resources, primarily from shallow-water fields, for LNG production. The facility is
currently restricted to produce below 0.25 tcf per annum and more wells are required to ensure
stable, long-term production rates (MacauHub, 2018).
Angola LNG has signed an offtake multi-year agreement with Vitol and Glencore for the supply
of LNG. Agreements have also been reached with Germany’s RWE to deliver LNG products (ESI
Africa, 2017). According to Oil Review Africa, Angola has been selling all its LNG through
competitive tenders in the global spot market.
4.2.2. Botswana
Botswana discovered CBM reserves in the Lesedi region. The Lesedi CBM project has an
independently certified contingent gas resource of 3.2 tcf. The concessionaire Tlou Energy places
the commercial proven reserves at 0.15 tcf and commercial possible reserves at 0.26 tcf. Tlou
Energy is seeking project finance to build infrastructure to connect the Lesedi Power Project to
the existing electricity grid in Botswana. The infrastructure includes transmission lines, electrical
substations as well as the installation of gas and solar generation assets. FID is expected once
a third-party technical review of the project, as part of the due diligence process, has been
completed. The proposed off-taker of the power generated by Tlou is the Botswana Power
Corporation, with a signed a PPA for the first 2MW of electricity and a pending submission to
secure a PPA for up to 10MW (Tlou Energy Limited, 2021).
4.2.3. Mozambique
Mozambique has the largest gas discoveries among the focus countries. It already produces gas
from its Pande and Temane fields, has discovered large volumes of offshore gas (predominantly
concentrated in the Rovuma basin), and has an unquantified onshore potential (e.g. CBM
prospects in Tete). Combining all the recoverable reserves (onshore, offshore and CBM),
Mozambique could supply as much as 3.9 tcf annually by 2030.
Given Atlantic Basin competition, South Africa may not be the first market of choice for
Mozambique’s LNG. Even if a substantial part of these volumes would be initially reserved for
export through LNG, vast potential remains for regional supply. South Africa is Mozambique’s
Rev.
II
Document Title Document Classification Status
Base Case Document NEDLAC Consultation Document First Draft
Page
14South African Gas Master Plan Consultation Document
neighbour and has an established and deep trading relationship, and significant existing
investment by South Africa into Mozambique (Standard Bank, 2019).
South Africa has purchased natural gas from Mozambique, through Sasol Gas, since 2004. The
project served as a milestone in Southern African energy and infrastructure development,
initiating a much-needed broadening of the energy supply mix in the region and impacting
positively on both the Mozambican and South African economies. The development provided an
anchor offtake to facilitate development of gas fields in Mozambique, which in turn stimulated
the development of South African and Mozambican gas markets.
The Petroleum Production Agreement (PPA) resulted in expansion of South Africa’s industrial
sector, with the existing industrial companies combined economic contribution amounting to
more than R 150 billion per annum, providing employment for over 46,000 South Africans
(IGUA-SA, 2019). The Pande and Temane gas field reserves are declining and the imminent gas
supply shortage could be catastrophic for South Africa’s economy and labour force.
The Production Sharing Agreement (PSA) licence is set to bring about the next wave of
development, supporting the Mozambican Government’s drivers for in-country monetisation,
energy security, further industrialisation and skills development. Sasol approved the FID on the
PSA, with gas earmarked for a 450 MW gas-fired power plant Central Térmica de Temane and
a Liquefied petroleum Gas (LPG) facility in the same time frame. The balance of the gas produced
is anticipated to be exported to South Africa to sustain Sasol’s operations (Sasol, 2021).
The Golfinho project in Mozambique has been provided a loan facility of approximately
1 billion USD by Standard Bank, underwritten by the Export Credit Insurance Corporation of
South Africa and a similar loan facility is expected for the Rovuma LNG project. These
Mozambican projects thus offer significant opportunities for South African industrial players to
ramp up their capacity and supply a wide variety of value-added products into these projects
(Department of Trade and Industry, 2018).
Wood-Mackenzie estimates the total recoverable Rovuma reserves at approximately 120 tcf.
Relatively small offshore reserves were also found at the Njika and Buzi fields, totalling nearly
1.3 tcf of recoverable reserves.
An early development plan is underway for a 2,600 km gas pipeline from the Rovuma Basin in
northern Mozambique to Gauteng, South Africa. A cooperation agreement has been signed
between ENH, Profin Consulting, SacOil and China Petroleum Pipeline Bureau. The consortium’s
next task is to conduct a feasibility study to determine the possible economic benefits for the
project and these results will determine the future steps for the project (Kiganda, 2018).
The Total-operated Mozambique LNG project, consisting of two LNG trains with a total annual
capacity of 13.1 MT, will be Mozambique’s first onshore LNG development. Area 1 contains more
Rev.
II
Document Title Document Classification Status
Base Case Document NEDLAC Consultation Document First Draft
Page
15South African Gas Master Plan Consultation Document
than 60 tcf of gas resources, of which 18 tcf will be developed with the first two train project
which took FID in June 2019. The project was originally expected to come into production by
2024 but following the evolution of the security situation in the north of the Cabo Delgao
Province, Total claimed Force Majeure end of April 2021, which is likely to affect the timeline of
the project (Broyard, 2021).
The partners in the Mozambique Rovuma Venture submitted the development plan to the
government for the first phase of the Rovuma LNG project, which will produce, liquefy, and
market natural gas from the Mamba fields located in the Area 4 block offshore Mozambique. The
plan details the proposed design and construction of two LNG trains which will each produce
0.37 tcf per annum (Offshore Energy Today, 2018). FID was expected by 2019 and production
is anticipated by 2024.
The Coral South project is the first LNG project in Mozambique, led by ENI, to exploit the huge
reserves of Area Four in the Rovuma Basin through the first worldwide ultra-deep floating LNG
plant. Area 4 comprises a total recoverable gas reserve of 58.2 tcf, with 17.6 tcf currently
estimated to be commercially recoverable. The production capacity is 0.17 tcf, for 25 years,
starting 2022.
In addition to these recent offshore discoveries, Mozambique is already producing gas from its
onshore Pande and Temane fields, with the remaining recoverable reserves estimated at
2.3 tcf. Production is also expected to come online from the adjacent Inhassoro PSA, which has
recoverable reserves of 0.4 tcf (100% owned by Sasol). All three fields feed the ROMPCO
pipeline to Secunda.
Mozambique is expected to have unconventional gas potential from its CBM resources in the
Tete region. These reserves are still unquantified and would likely be more economically
challenging to develop compared to the country’s conventional gas reserves.
4.2.4. Namibia
The Kudu gas field, situated offshore southern Namibia, have proven and probable recoverable
reserves estimated at more than 3.3 tcf (Reuters, 2018). Transporting gas by pipeline from the
Kudu gas field in Namibia to the East Coast region has proven to be commercially challenging,
with various studies on the technical and commercial viability proving marginal results. More
importantly, the government of Namibia have indicated a preference to use natural gas for
indigenous requirements rather than for exportation to South Africa. Although Kudu was
discovered in 1974 it has not been developed and if Kudu comes online by 2030, Namibia’s
annual gas supply potential is estimated at approximately 0.04 tcf.
Rev.
II
Document Title Document Classification Status
Base Case Document NEDLAC Consultation Document First Draft
Page
16South African Gas Master Plan Consultation Document
4.2.5. Tanzania
Tanzania’s natural gas reserve is estimated at 57.5 tcf. Currently, the natural gas extracted is
for domestic use rather than exportation.
Tanzania expects a consortium of internal oil companies to start building a long-delayed LNG
project in 2022. Equinor, alongside Royal Dutch Shell, Exxon Mobil and Ophir Energy and
Pavilion Energy, plan to build the onshore LNG plant in the Lindi region. The project will have a
capacity of 0.49 tcf LNG annually. Construction is expected to commence in 2022 and will be
concluded in 2028 (Reuters, 2019).
4.2.6. Zimbabwe
Invictus Energy raised prospects of natural gas in Mzarabani and Msasa, which could result in
Zimbabwe joining countries in the SADC region as leading natural gas producers. The Mzarabani
Prospect’s natural gas reserve was independently estimated at 9.25 tcf by Getech Group Plc,
with the net mean recoverable conventional potential estimated at 6.5 tcf. In addition, the Msasa
Prospect is estimated to contain 1.05 tcf on a total gross mean unrisked basis (Invictus Energy
Limited, 2019) (Oil Review Africa, 2019).
On 26 March 2021, Invictus signed a Petroleum Exploration Development and Production
Agreement (PEPDA) with the Republic of Zimbabwe. The execution of the PEPDA puts in place
the necessary framework to rapidly develop the Cabora Bassa Project on exploration success
and provides a 25-year production licence. Invictus is currently in the second exploration period
and completed capital raise to accelerate the exploration campaign throughout 2021 (Invictus
Energy Ltd, 2021).
South Africa is one of the potential off-takers earmarked for the natural gas reserve, in addition
to Zambia.
CBM reserves were discovered in the Lupane-Lubimbi area a few decades ago, but commercial
exploitation has not taken off. The reserve is estimated at over 0.02 tcf. Exploration and pilot
production have since been conducted and results indicate that the resource can be exploited
commercially (allAfrica, 2019).
The gas fields remain undeveloped and the prospective resource relates to undiscovered
accumulations which have both a risk of discovery and a risk of development.
Rev.
II
Document Title Document Classification Status
Base Case Document NEDLAC Consultation Document First Draft
Page
17South African Gas Master Plan Consultation Document
4.3. Global Gas Reserves and Resources
According to the BP Statistical Review of World Energy, the total global proven natural gas
reserves at the end of 2019 was 7,019 tcf, with the distribution of global reserves shown in
Figure 4-3 (BP, 2020).
Figure 4-5 displays the global potential LNG supply projects, with expected FIDs between 2019
and 2023 (Bloomberg NEF, 2019).
North America
32.3%
South and Central America
1.7%
4.0%
Europe
7.6%
2019 Total CIS
7,019 tcf
8.9% Middle East
7.5% Africa
38.0%
Asia Pacific
Figure 4-3: Global Natural Gas Proven Reserve Percentage Distribution
The highest ranking global natural gas exporters for 2019 are depicted in Figure 4-4 (BP, 2020).
The 2018/19 wave of investment in liquefaction projects delver additional export capacity in
North America, Africa and Russia.
Forecast slower gas demand (average annual growth rate of 1.5% compared to the initial 1.8%)
post-2020 will limit the risk of a tight LNG market over the medium term (IEA, 2020).
Rev.
II
Document Title Document Classification Status
Base Case Document NEDLAC Consultation Document First Draft
Page
18South African Gas Master Plan Consultation Document
6% 10% US
7%
Russia
8%
Qatar
2019 Total
17.1 tcf
Australia
22%
Malaysia
22%
Nigeria
Figure 4-4: Global Liquified Natural Gas Exporters Percentage Distribution
Likely FID in 2019-2020 Arctic LNG-2
Sakhalin-2 Train 3
(19.8MMtpa)
Potential FID* in 2019-2023 (5.4MMtpa)
Far East LNG
Alaska LNG (6.2MMtpa)
(20MMtpa)
Woodfibre LNG Goldboro LNG
(2.1MMtpa) (10MMtpa)
Kitimat (18MMtpa)
Jordan Cove (7.8MMtpa) Nigeria LNG Qatargas
Energia Costa Azul I (3.3MMtpa) Eagle LNG Train 7 Expansion
(1MMtpa) (7.7MMtpa) (~33MMtpa) PNG Train 3,
Energia Costa Azul II (9.1MMtpa) Papua LNG
Mexico Pacific LNG (4MMtpa) Trains 1 & 2
Gulf LNG (8MMtpa)
Sabine Pass T6 (4.5MMtpa) (11.5MMtpa)
Mozambique LNG
Port Arthur (13.5MMtpa) Plaquemines (12.9MMtpa)
Delfin FLNG (13MMtpa) LNG (20MMtpa) Rovuma LNG
Freeport Train 4 (5MMtpa) (15.2MMtpa)
Corpus Christi Stage 3 Calcasieu Pass (10.8MMtpa)
(11.5MMtpa)
Driftwood LNG (Phase 1) (16.5MMtpa) Pluto Train 2 (5MMtpa)
Texas LNG (4MMtpa) Lake Charles (15MMtpa) Australia Backfills:
Rio Grande LNG Magnolia LNG (8MMtpa) NWS, Darwin
(Train 1-3) (13MMtpa)
Cameron Trains 4 & 5 (10MMtpa)
Annova (6.9MMtpa) U.S. Gulf Coast
Figure 4-5: Potential LNG Supply Project FIDs in 2019-2023
The major natural gas trade movements, either through inter-regional pipelines or LNG
industries, are indicated in Figure 4-6 (BP Statistical Review of World Energy, 2020).
North America and Europe are the dominant piped gas markets, while major suppliers, such as
Australia and Nigeria, connect with key Asian markets through the LNG industry.
Rev.
II
Document Title Document Classification Status
Base Case Document NEDLAC Consultation Document First Draft
Page
19You can also read