Space Weather - Impacts, Mitigation and Forecasting
←
→
Page content transcription
If your browser does not render page correctly, please read the page content below
Space Weather – Impacts, Mitigation and Forecasting
                                        Dr. Sten Odenwald

                                  National Institute for Aerospace

Introduction
       Normal, terrestrial weather is a localized phenomenon that plays out within a volume of 4
billion cubic kilometers over scales from meters to thousands of kilometers, and times as
diverse as seconds to days. Whether you use the most humble technology found in primitive
villages in Bangladesh, or the most sophisticated computer technology deployed in Downtown
Manhattan, terrestrial weather can and does have dramatic impacts all across the human
spectrum. During 2011 alone, annual severe weather events cost humanity 2000 lives and
upwards of $37 billion dollars (Berkowitz, 2011). The public reaction to terrestrial weather is
intense, and visceral, with armies of meteorologists reporting daily disturbances around the
globe, and weather forecasting models that are decades-old and have improved in reliability.

       In contrast to terrestrial weather and our methods of mitigating its impact, we have the
arena of space weather, which occurs within a volume spanned by our entire solar system, over
time scales from seconds to weeks and spatial scales from meters to billions of kilometers.
Unlike the impacts caused by terrestrial weather, space weather events on the human scale are
often much more subtle, and change with the particular technology being used. There are, for
example, no known space weather events in the public literature that have directly led to the
loss of human life. The public reaction to space weather events when announced, seldom if
ever reaches the level of urgency of even an approaching, severe thunderstorm. Despite the
fact that, since the 1990s, we have become more sophisticated about communicating to the
public about the potential impacts of severe space weather, these alerts are still only consumed
and taken seriously by a very narrow segment of the population with technology at risk; satellite
owners, power grid operators, airline pilots and the like. The historical record shows that in
virtually all instances, space weather events have only led to nuisance impacts; disrupted radio
communication; occasional short-term blackouts; and occasional satellite losses that were
quickly replaced. Yet, when translated into the 21st Century, these same impacts would have a
significantly larger impact in terms of the numbers of people affected. For instance, the Galaxy 4
satellite outage in 1998 deactivated 40 million pagers in North America for several hours.
Pagers at that time were heavily used by Doctors and patients for emergency surgeries, to
name only one type of direct impact. Numerically, and in terms of function, we are substantially
less tolerant of ‘outages’ today than at any time in the past history of space weather impacts.

       In this chapter, I will review the various technologies and systems that have historically
proven susceptibilities to space weather, why they are susceptible, methods being used to
mitigate these risks, and how one might estimate their social impacts. I hope to demonstrate
that, although we have a firm understanding of why technologies are at risk from basic physics
considerations, we are still a long ways from making the case that extraordinary means need to
be exerted to improve our current levels of reliability. One of the reasons for this is that we have
been living through a relatively moderate period of solar activity spanning the majority of the
Space Age. Without a major ‘Hurricane Katrina’ event in space weather, perhaps akin to the
1859 Superstorm, there is not much public outcry, commercial foresight, or political will, to
significantly improve the current preparedness situation. Moreover, the progress of technology
has been so rapid since the beginning of the Space Age in the late 1950s, that many of the
technologies that were most susceptible to space weather, such as telegraphy, compass
navigation, and short-wave communication, have largely vanished in the 21st Century, to be
replaced by substantially more secure consumer technologies.

1.0 Open-air Radio Communication

       Although telegraphic communication was the dominant victim of solar geomagnetic
activity during the 1800s, by the mid-20th Century, virtually all telegraphic systems had been
replaced by land-lines carrying telephonic communications, or by the rapid rise of short-wave
broadcasting and submarine cables for trans-continental communication (Odenwald, 2010). At
its peak in ca 1989, over 130 million weekly listeners tuned-in to the BBC’s World Service. Once
the Cold War ended, short-wave broadcasting and listening went into decline. As Figure 1
shows, less than 1/3 of the stations on the air in 1970s are still operating. Compared to other
forms of communication (e.g. web-based programming) shortwave is very expensive in terms of
setting up a radio station, or providing operating costs to purchase megawatts of broadcasting
power. [Careless, 2010, 2011]. Nevertheless, by December 2011 an estimated 33% of the
human population had access to the Internet, and its vast network of formal and informal ‘news’
aggregators, including online versions of nearly all of the former shortwave broadcasting
stations.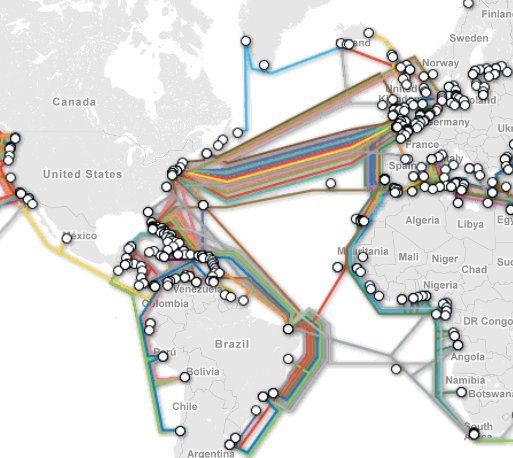
Although shortwave broadcasting is a ghost of its former self, there are still a number of
functions that it continues to serve in the 21st Century. It is a back-up medium for ship to shore
radio, delivering state-supported propaganda to remote audiences, time signals (WWV),
encrypted diplomatic messaging, rebel-controlled, clandestine stations, and the mysterious
‘Numbers Stations’. There also continues to be a die-hard population of amateur radio ‘hams’
who continue to thrill at DXing a dwindling number of remote, low-power stations around the
world when the ionospheric conditions are optimal. Sometimes, these Ham operators serve as
the only communication resource for emergency operations. For example, during Hurricane
Katrina in 2005, over 700 ham operators formed networks with local emergency services, and
were the only medium for rapidly communicating life-saving messages. Despite the lack of
public interest or awareness of the modern shortwave band, its disruption could leave many
critical emergency services completely blind and unresponsive in a crisis.

Insert Figure 1 about here

       Short wave broadcasting played such a key societal role during the first-half of the 20th
 century that millions of people were intimately familiar with its quality, program scheduling,
 and disruptions to this medium. Any disruption was carried as a Front Page story in even the
 most prestigious newspapers such as the New York Times. Although shortwave stations were
 routinely jammed by the then Soviet Union or Germany during World War II, these efforts
 paled in comparison to the havoc wreaked by even a minor solar storm. Known as the
 Dellinger Effect,   a solar flare increases the ionization in the D and F Regions of the
 ionosphere on the dayside of Earth, spanning the full sun-facing hemisphere. This absorbs
 shortwave radiation but causes very low frequency (VLF) waves to be reflected. During the
 four solar cycles that spanned the ‘Short Wave Era’ from 1920 to 1960, there were dozens of
 flares that delivered radio blackouts, which regularly interfered with trans-Atlantic
 communication; a major news and espionage flyway for information between Europe and
 North America:

 July 8, 1941 - Shortwave channels to Europe are affected [New York Times, p. 10]
 September 19, 1941 - Major baseball game disrupted [New York Times, p. 25].
 February 21, 1950 - Sun storm disrupts radio cable service [New York Times, p. 5
 August 20, 1950 - Radio messages about Korean War interrupted. [New York Times, p. 5]
 April 18, 1957 - World radio signals fade [New York Times, p. 25]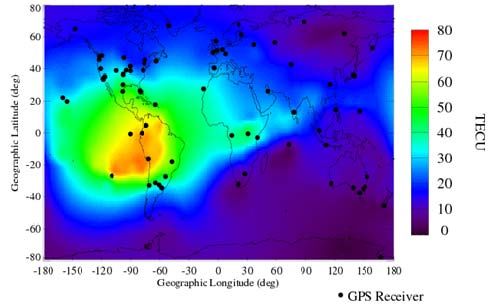
February 11, 1958 - Radio blackout cuts US off from rest of world. [New York Times, p. 62]
Although as we noted before, contemporary public contact with shortwave radio is nearly
zero, today there are some places where SW is still in limited use, and where the public in those
regions would be as conversant with SW fade-outs as the western world was in ca 1940. For
instance, China is expanding its SW broadcasting to remote populations across China who do
not as yet have access to other forms of communications networks. Even today, short wave
outages still make the news:
On August 9, 2011 a major solar flare caused fade-outs in the SW broadcasts of Radio
Netherlands World, but after an hour, broadcasting had returned to its normal clarity. Solar flare
disrupts RNW short wave reception [RNP, 2011]. This was the first major SW blackout in China
since the X7.9-class flare on January 21, 2005, which affected Beijing and surrounding eastern
population centers. [Xinhuanet, 2005]. On February 15, 2011 another large solar flare disrupted
southern Chinese SW broadcasting. The China Meteorological Administration reported an X2.2-
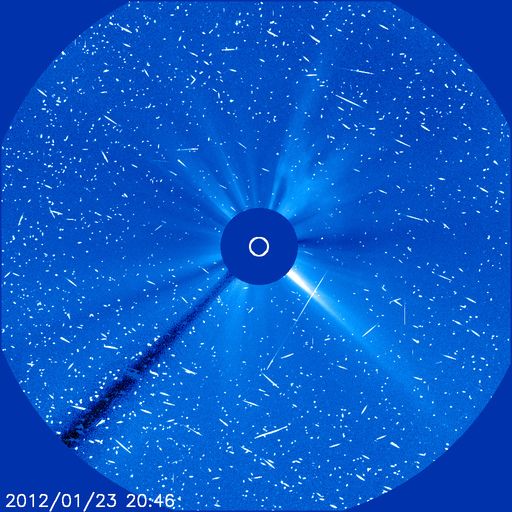
class flare at that time. [Xihuanet, 2011]. The January 23, 2012 M9-class solar flare disrupted
broadcasts on the 6 – 20 meters bands across North America, and severely affected the UHF
and VHF bands for a period of a few hours. [SWA, 2012]
1.1 Submarine Telecommunications Cables
The first copper-insulated, trans-Atlantic cable was deposited on the ocean floor in 1856
between Ireland and New Foundland, but because it was run at voltages that were too high, the
insulation broke down and the cable failed within a few weeks. The first successful cable was
laid in 1865 between Brest, France and Duxbury, Massachusetts and worked successfully for
many years, passing telegraphic signals at a speed of 2 words per minute ( 0.01 bps!). The first
copper-insulated, trans-Atlantic telephone cable was laid in 1956. By 1950, over 750,000 miles
of copper-based undersea cable had been installed between all of the major continents (ICPC,
2009]. This was followed by the first fiber optic cable TAT-8 installed between Europe and
North America in 1988. By 2009, some 500,000 miles of fiber optic cable has been deployed,
and has largely replaced all copper cable traffic due to the much higher bandwidths approaching
several terabytes/sec (See Figure 2).Insert Figure 2 about here
Because signals degrade in strength as they travel through thousands of miles of
copper, devices called repeaters are added to the cable every 50 miles or so, and are powered
by a current flowing through a separate HV power line that parallels the cable from end to end.
Loss of power to a cable can cause immediate loss of signal, so all cables must be continuously
powered through connection to the domestic power grid or back-up generators. These voltages
can exceed 500 kV, and pose an electrocution hazard to fishing boats that accidentally snag
them. Cables are typically broken through fishing accidents, earthquakes and mechanical failure
about 150 times a year, causing a loss of communication capacity that may last from days to
weeks depending on the depth of the required repair (ICPC, 2009). Because the repair site may
only be a meter or so in length, modern repair ships routinely use GPS to reach the proper
location of the identified failed repeater, or cable damage. Also, GPS systems are used in
deploying fiber optic cables along exact, preplanned routes that minimize cable waste.
There is no formal requirement for communications companies to log cable outage
events, especially in a public archive. Consequently, outages only become public knowledge
when they impact public telecommunications activities. For example, on February 25, 2012 the
East African Marine Systems (TEAMS) data cable linking East Africa to the Middle East and
Europe was severed off the coast of Kenya by a ship that illegally dropped anchor in a restricted
area. This cable was already taking the traffic from three other fiber optic cables that had been
damaged only 10 days before. It would take three weeks before this cable could be repaired,
and data and e-commerce traffic restored to Kenya, Uganda, Rwanda, Burundi, Tanzania and
Ethiopia. [Parnell, 2012].
Copper-based submarine cables are deployed in a manner similar to the old-style
telegraph cables, and for this reason are subject to the same space weather impacts, though for
different reasons, and perhaps not the ones you might initially consider. The original telegraphic
systems and submarine cables of the 1800s were single conductors through which one-half of
the battery was connected. The other half of the battery was grounded to the local Earth to
complete the circuit! This works well when the naturally-occurring terrestrial ground current is
stable in time, and over large geographic distances comparable to the telegraph network,
however both of these conditions are badly violated during a geomagnetic storm.During a geomagnetic storm, a strong ionospheric current appears, called the electrojet.
This current generates a secondary magnetic field that penetrates the local ground and induces
additional ground currents to flow called a Geomagnetically-Induced Current or GIC. Any single-
wire telegraph system will immediately detect this GIC, which can be much greater than the
original battery current, hence the frequent reports about mysterious high voltages and
equipment burn out. The older trans-Atlantic cables were not immune from this because they,
too, were patterned after the single-wire telegraph system and so GICs were a corresponding
problem on these systems. For example, the geomagnetic storm that occurred on 2 August
1972 produced a voltage surge of 60 volts on AT&T’s coaxial telephone cables between
Chicago and Nebraska. The magnetic disturbance had a peak rate of change of 2200 nT/min,
observed at the Geological Survey of Canada's Meanook Magnetic Observatory, near
Edmonton, and a rate of change of the magnetic field at the cable location estimated at 700
nT/min. The induced electric field at the cable was calculated to have been 7.4 V/km, exceeding
the 6.5 V/km threshold at which the line would experience a high current shutdown. [Space
Weather Canada, 2011]
One might think that modern-day fiber optic cables are immune from this GIC effect
because they involve a non-conductive optical fiber. High voltage power is supplied to the cable
at each end, with one end being at V+ and the other at V- potential. Just as for telegraph
systems, one side of the HV supply is grounded to Earth, which provides a pathway for GICs.
Repeaters for boosting the signal are connected in series along the cable axis and supplied by a
coaxial power cable. GIC currents can temporarily overload the local power supply, causing
repeaters to temporarily fail, and usually require resetting.
Have any incidents involving fiber optic cables ever been reported? We are mindful of
the old adage that absence of evidence is not the same as evidence of absence. The fact that
there is no impartial way to track outages on modern fiber optic telecommunications cables, and
there are no federal regulations that require this reporting, means that reports are voluntary.
When we search through public documents and find no cases of space weather-related cable
outages, it only means that we cannot choose between two equally likely situations: Either they
do occur and are not reported to save embarrassment, or the public records are unbiased and
so lack of examples indicated lack of an impact. There are, however, some notable examples:“At the time of the March 1989 storm, a new transatlantic telecommunications fiber-optic cable
was in use. It did not experience a disruption, but large induced voltages were observed on the
power supply cables”. [Space Weather Canada, 2011]
1.2 Ground-based computer systems
Solar storms can be a rich source of energetic particles via shock-produced Solar Proton
Events (SPEs), galactic cosmic ray (GCR) enhancements during sunspot minimum, or events
taking place within the magnetosphere during the violent magnetic reconnection events
attending a geomagnetic storm. Although high-energy cosmic rays can penetrate to the ground
and provide about 10% of our natural radiation background, secondary neutrons can be
generated in air showers and penetrate at much higher fluxes to the ground. A number of
monitoring stations, such as the Delaware Neutron Monitor, provide day-to-day measurements
of the GCR secondary neutron background and detect ground-level enhancements (GLEs). At
aviation altitudes, these high-energy neutrons can produce avionics upsets, which are easily
corrected by error detection and correction (EDAC) algorithms or multiply-redundant avionics
systems. On the ground, and ostensibly shielded by a thick atmosphere, computer systems and
chip manufacturing processes have been allegedly affected by solar storm events (Tribble
,2010). Trying to identify even one case where such ‘computer glitches’ were caused by GCR or
space weather events remains problematical. Nevertheless, consumers and governments
expect their computer systems to function reliably (computer virus attacks excepted), so even
manufacturers such as Intel take this issue seriously. US patent 7,309,866, was assigned to
Intel for their invention of "Cosmic ray detectors for integrated circuit chips". [Hannah, 2004]
“Cosmic particles in the form of neutrons or protons can collide randomly with silicon nuclei in
the chip and fragment some of them, producing alpha-particles and other secondary particles,
including the recoiling nucleus…. Cosmic ray induced computer crashes have occurred and are
expected to increase with frequency as devices (for example, transistors) decrease in size in
chips. This problem is projected to become a major limiter of computer reliability in the next
decade.”
Bit-flip errors, in which the contents of a memory cell become switched from a ‘0’ state to
a ‘1’ state or vice versa, are a pernicious form of Single Event Upset (SEU) that continues to
plague ground based computer systems that use high-density ‘VLSI’ memory. The mechanism
is that a high-energy neutron collides with a substrate or gate nucleus, producing a burst ofsecondary charged particles. These electrons and ions drift into a memory cell and increase the
stored charge until a state threshold is achieved, at which point the cell indicates a high-Q state
of ‘1’ rather than a relatively empty, low-Q state of ‘0’; hence the bit-flip error. Extensive testing
and research to identify the origin of these soft-memory errors led to alpha particle emission
from naturally occurring radioisotopes in the solder and substrate materials themselves.
Extensive re-tooling of the fabrication techniques, however, failed to completely eliminate SEUs.
Currently, a system with 1 Gby of RAM can expect one soft-memory error every week, and a 1
terabyte system can experience SEUs every few minutes. Error detection and correction
(EDAC) algorithms cost power and speed, and do not handle multi-bit errors where the parity
does not change. [Tezzaron, 2003]. According to Paul Dodd, manager for the radiation effects
branch at Sandia National Labs, "It could be happening on everyone's PC, but instead
everyone curses Microsoft. Software bugs probably cause a lot of those blue-screen problems,
but you can trace some of them back to radiation effects." [Santarini, 2005].
Although there are no specific, documented examples of ground-based computer
crashes due to specific solar storms, it is legitimate to consider what might be the societal
consequences of space weather-induced computer glitches. If they occur from time to time, it is
instructive to consider the impact that other more prosaic glitches have produced:
March 2, 2012 - Computer glitch hits Brazil’s biggest airline. Brazil’s biggest airline says a
computer glitch took down its check-in system in several airports across the country, causing
long delays [boston.com, 2012]
November 5, 2011 - HSBC systems crash affects millions across UK. HSBC was today hit by a
nationwide systems crash thought to have affected millions of customers. The bank's cash
machines, branches, debit cards, and internet banking services all stopped working at 2.45pm
after a computer glitch. [Paxman, 2011]
1.3 Space-based Computers
The first documented space weather event on a satellite occurred on Telstar-1 launched
in July1963. By November, it had suddenly ceased to operate. By exposing the ground-based
duplicate Telstar to various radiation backgrounds, Bell Telephone Laboratory engineers wereable to trace the problem to the gate of a single transistor in the satellite’s command decoder.
Apparently, excess charge had built up on the gate, and by simply turning the satellite off for a
few seconds, the problem disappeared. By January, 1963 the satellite was back in commercial
operation relaying trans-Atlantic television programs between Europe and North America (Reid,
1963).
During the 1960’s, a number of NASA reports carefully documented the scope and
nature of space weather-induced satellite and spacecraft malfunctions. There was as yet no
significant commercial investment in space, so NASA was free to analyze glitches to its own
satellites and interplanetary spacecraft. Of course military satellites of ever increasing
complexity, cost, and political sensitivity were also deployed, but no unclassified documents
were then, or are now, available to compare space weather impacts across many different
satellite platforms. This leads to an important issue that is crucial to impact assessment and
mitigation. How can we assess risks and prospective economic losses when so much of the
required data is protected through national secrecy regulations and commercial confidentiality?
Even among the ‘public domain’ NASA satellites, data as to the number and severity of ‘glitches’
is usually buried in the ‘housekeeping’ data and rarely makes it out of the daily briefing room
since it is irrelevant to the scientific data-gathering enterprise.
In a perfect world, we would like to have data for all of the 2000+ currently operational
satellites that describes the numbers, dates and types of spacecraft anomalies that they
experienced. From this we would be able to deduce how to mitigate the remaining radiation
effects, identify especially sensitive satellites and quantify their reliability, and to develop
accurate models for forecasting when specific satellites will be most vulnerable. In reality, much
of what we can learn is by ‘reading between the lines’ in news reports, correlating these biased
forms of information against the known space weather events, and hoping that a deterministic
pattern emerges. Even this has been a daunting challenge when adjacent satellites in orbit can
experience the same space weather conditions, but have very different anomalies, thereby
making correlations between space weather conditions and satellite anomalies seem less
certain.
1.3.1 How does it happen?Satellite anomalies can be broadly defined to include any event in which some operating
mode of a satellite differs from an expected or planned condition. In this context, the term
‘anomaly’ is extremely broad, spanning a continuum of severities from trivial satellite state
changes and inconsequential data corruption, to fatal conditions leading to satellite loss. Actual
data from satellite-born sensors shows that these events can be quite numerous. For instance,
SOHO data from a 2 GBy onboard Solid State Recorder typically records > 1000 SEUs/day
(Brecca et al, 2004). Only rarely, however, do SEUs actually lead to satellite conditions requiring
operator attention – a condition commonly termed an anomaly. For SOHO, only ~60 anomalies
during an 8-year period (~ 8 anomalies/satellite/year) have required significant operator
intervention, despite the literally millions of SEU events recorded during this time.
Insert Figure 3 about here
Anomalies need not be fatal to be economically problematical. On January 20, 1994 the
Anik E1 and E2 satellites were severely affected by electrostatic discharges (ESDs). Although
the satellites were not fatally damaged, they required up to $70 million in repair costs and lost
revenue, and accrued $30 million for additional operating costs over their remaining life spans
(Bedingfield, Leach and Alexander, 1996). The Anik satellite problems were apparently the
result of a single ESD event affecting each satellite (Stassinopoulos et al., 1996), suggesting
that large numbers of anomalies are not required to 'take out' a satellite. If anomalies are
frequent enough, however, the odds of a satellite failure must also increase, as will the work
load to satellite operations. According to FUTRON (2003), satellite operators ordinarily spend
up to 40 percent of their time on anomaly-related activities. Ferris (2001) has estimated the cost
of dealing with satellite anomalies as $4,300/event leading to overall operations impacts
approaching $1 million/satellite/year under apparently routine space weather conditions.
Anecdotal reports suggest that during major solar storms, far higher operator activity can occur.
For example, the GOES-7 satellite experienced 36 anomalies on October 20, 1989 during a
single, severe solar storm event (Wilkinson, 1994).
The issue of ‘how bad can it get?’ is an interesting one, especially given our dramatically
increased reliance upon GEO satellite systems since ca 1980 that are economically baselined
on the assumption of 100% reliability during a 10 to 15 year satellite service life span. The ~250
GEO satellites now in operation produce an annual revenue of $80 billion (Ferster, 2005) so anyspace weather impact is potentially costly, and can involve more than one satellite at a time.
Satellite designers use sophisticated tools to assess radiation hazards under ‘worst case’
conditions (e.g. the August 1972 and March ,1991 events) however, recent studies of extreme
space weather conditions suggest that the period since ca 1960 has not been typical of the
historical record of severe storms during the last 500 years (McCracken et al., 2001; Townsend,
2003). Moreover, there is a large discrepancy between models that predict, for example, SEU
events and actual satellite observations of them (e.g. Hoyos, Evans and Daly, 2004). Some
recent studies have attempted to estimate the economic consequences to commercial GEO
satellites for severe solar storm episodes (e.g. Odenwald and Green, 2007), but the studies
were hampered by the lack of detailed knowledge of how the frequencies of satellite anomalies
vary in severity with storm intensity. Consequently, the loss of a satellite during a severe space
weather event could not be modeled realistically, nor its economic impact properly assessed.
Most reported anomalies, broadly defined, are nuisances involving recoverable data
corruption, easily-corrected phantom commands, or 'bit flips' often caught by onboard EDAC
algorithms. These are not the kinds of anomalies that lead to significant economic
consequences for a commercial satellite. Other less frequent anomalies cause sub-system
failures, out-of-spec satellite operations, attitude and telemetry-lock errors and even outright
satellite failures. These are most certainly the kinds of anomalies that have economic
consequences. Some authors have also classified anomalies by satellite orbital location (e.g.
LEO, MEO, GEO), recognizing that each environment has its own physical drivers for anomaly
generation, but more often than not, these classes are aggregated together. Here is one
possible scheme:
Class 1 - Mission-Failure - The satellite ceases operation as a consequence of an
unrecoverable system malfunction. ( e.g. Telstar-401)
Class 2 - Mission interruption - involves a recoverable damage to sub-systems. Only built-in
redundancies, if available, are capable of mitigating some of these problems, where the
satellite's safe mode may be enabled, or a back-up subsystem has to be activated (e.g. Anik-
E1). These may take hours of effort to remedy, at a cost to satellite revenue and operator
overhead charges.Class 3 - Performance decrease - can include spacecraft pointing errors, attitude control
system error, or a brief loss of data or telemetry usually corrected by a manual or automatic
system reset.
Class 4 - Inconsequential - memory bit-flips and switching errors easily corrected using on-
board EDAC software, or simple operator action. (e.g. TDRSS-1 telemetry; cosmic ray
corruption of Hubble Space Telescope data).
One of the earliest, and most detailed, publically available studies of satellite anomalies
and reliability is the work by Hecht and Hecht (1986 : the Hecht Report). The study was based
on 2,593 anomaly reports for 300 satellites launched between ca 1960 and 1984. There were
~350 satellites in operation by ca 1984, so the Hecht Report is relatively complete. This ground-
breaking study analyzed the detailed reports provided by 96 satellite programs. A 'failure' was
defined as "…the loss of operation of any function, part, component or subsystem, whether or
not redundancy allowed the recovery of operation”. Their study identified 213 Class 1 and 192
Class 2 anomalies out of a total collection of 2593 anomalies for a mission failure rate defined
by our Class 1 of about 405/2593 or 1 in 6. No attempt was made to correlate the anomalies
with space weather conditions.
One of the most widely used, recent starting points for anomaly studies is the archive
assembled by Wilkinson and Allen (1997; hereafter NGDC) which identifies most of the 259
satellites by name, or code, along with orbital location and/or altitude information. The date and
type of anomaly is provided for many of the 5,033 events spanning the time period from 1970 to
1997, so that a proper assessment can be attempted of the various category-specific anomaly
rates as a function of date and satellite type. There are 3,640 events that have been tagged
according to type and system impact, including 647 SEU events and 848 ESD events. The
NGDC archive contains 43 commercial GEO satellites included in the archive, accounting for a
total of 480 anomalies spanning 20 years, and also appears to contain about 40% of all
operating satellites during the sample time span, and is relatively complete for our purposes.
The average annual anomaly rate of the GEO satellites was found to be about 3
anomalies/satellite/year, but can rise to twice or three times this rate during enhanced space
weather conditions.Robertson and Stoneking (2005: Goddard) examined 128 severe (Class 1 and 2)
anomalies among 764 satellites. The data were culled from web-based satellite anomaly lists
including the 'Airclaims Space Track' as well as NASA documents and the Aerospace
Corporation 'Space Systems Engineering Database', and only included satellites from the US,
Europe, Japan or Canada. The total number of satellites (military + commercial) operating
during this interval is 827, so the sample contains about 92 % of all possible operational
systems during the 1990-2001 time period. A total of 35 anomalies were Class 1, which led to
what was considered the total loss of the satellites. About one anomaly in four (Class 1 vs Class
1 + 2) is of the severe Class 1. Their calculated anomaly rate was based on the number of
anomalies recorded, divided by the number of satellites launched during a given year. Re-
normalizing their mishap rates to, instead, reflect the annual operating satellites, the average
mishap rate for Classes 1+2 is about 0.019 +/- 0.006 anomalies/sat/year. The inverse of this
rate is 166 which is sometimes called the mean time to failure (MTF). Clearly for commercial
satellites expected to last 10 to 15 years before replacement, a MTF of 166 years is good news!
The correlation between these anomalies and space weather events was not studied.
The extensive studies by Belov et al (2004), and Dorman et al (2004), included satellite
anomaly reports based on 300 satellites and ~6,000 anomalies spanning the time period from
1971 to 1994. The data was drawn from NASA archives, the NGDS archive and unpublished
reports from 49 Kosmos satellites (1971-1997). The term 'anomaly' was never precisely defined,
but since the survey included the NGDC archive without distinction, we can assume that all
Class 1-4 events were grouped together. The sample included 136 satellites in GEO orbits.
They deduced that there were typically 1 to 10 anomalies/satellite/year. Specifically, the LEO
Kosmos satellites experienced 1-7 anomalies/satellite/year, however some Kosmos satellites
(Kosmos 1992 and 2056) reported ~30 anomalies/satellite/year. Their statistical analysis
indicated that anomalies occur during days when specific space weather parameters
(electron/proton fluxes, Dst, Ap, etc) are disturbed. The largest increases coincide with times
when electron and proton fluences are large, and can cause up to 50-times enhancements in
anomalies over quiet-time conditions. There appears to be a threshold of 1,000 pfu (E > 10
Mev) for proton fluxes, below which there are few anomalies reported. The anomalies continue
to remain high for two days after the SPE event.
Koons et al. (1999) published 'The Impact of the Space Environment on Space
Systems', which investigated a sample of 326 anomaly 'records' collected from a diverseassortment of satellites culled from the NGDC 'Satellite Anomaly Manager', Orbital Data
Acquisition Program (ODAP: Aerospace Corp), NASA's Anomaly reports (Bedingfield et al.
1996, and Leach and Alexander, 1997), and the USAF Anomaly Database maintained by the
55th Space Weather Squadron. The specific number of satellites involved was not stated,
however the ODAP archive contains information from 15 USAF and 91 non-Air Force 'programs'
no doubt drawn from LEO, MEO and GEO satellite populations. Although no information was
provided as to the time period spanned by the study, the individual archives extend from 1970 to
1997. The definition of a Record in terms of anomalies can vary enormously. Each record
contained information for one class of anomalies for one 'vehicle'. Anomalies of a similar class
were of the same functional type. Approximately 299 records out of 326 (92%) have causes
diagnosed as 'space environment' but this does not necessarily correlate with a count based on
anomaly frequencies. An example cited is that one record for the MARECS-A satellite included
617 anomalies. About 51/326 records were from commercial satellite systems and programs. In
terms of the distribution of the records with anomaly diagnosis, 162 (= 49%) were associated
with Electrostatic Discharges, 85 (= 26%) with SEUs, and 16 ( =5%) with 'total radiation
damage'. Based on 173 reports of how quickly the anomalies were rectified, the Koons et al
(1999) study indicates that the number of mission failures represents 9/173 reports for a
frequency rate of 1 in 19. The rates for the other classes are: Class 2 (More than 1 week) =
39%; Class 3 (1 hr to 1 week) = 35% and Class 4 (Less than 1 hour) = 20%.
Ferris (2001) analyzed 9,200 satellite operations discrepancy reports from 11 satellites
between 1992-2001. A 'discrepancy' was defined as "...the perception by a satellite operator
that some portion of the space system had failed to operate as desired." The satellites were
selected on the basis of which operators and owners were willing to divulge detailed anomaly
logs for this study, which is a strong bias probably in favor of systems that had low absolute
rates and few critical failures. Only three of the satellites were communications satellites; none
were for civilian commercial use. This, of itself, is a problem since we cannot know to what
extent these satellites are typical, or whether they are pathological. This is often the case when
working with studies in which the satellite identities are not publically revealed. Of the
discrepancies catalogued, only 13% involved the satellites themselves. The vast majority, 48%,
involved issues with the ground segment, and specifically, most were discrepancies generated
by software issues (~61% of total discrepancies). Typical discrepancy rates involving 1,200
events imply ~13 discrepancies/satellite/year. There were, however, higher rates recorded in
1996 involving 160 events for 4 satellites for a rate of 40 discrepancies/satellite/year or aboutone every 9 days. The study was the first one published in the open literature that also provided
an assessment of the cost of rectifying these anomalies. Routine problems that require no more
than 10 minutes to resolve by a team of 8 people cost $800 per event. More significant
problems requiring 3-8 hours and more people cost $4,300 per event. The estimate only
included man-hours and an average of the resolution times for the logged events, and not the
cost of equipment or materials. In the latter case an 'event' may include the replacement of part
of the ground station, processors or other mechanical items.
Cho and Nozaki (2005) investigated the frequency of ESDs on the solar panels of five
LANL satellites between 1993 – 2003. During this period, LANL 1989-046 experienced 6038
ESDs/year while LANL-92A recorded 290 ESDs each year. Although the cumulative lifetime
ESD rates on solar panels can exceed 6,000 events/kW over 15 years, the chances of a
catastrophic satellite failure involving substantial loss of satellite power, remains small, though
not negligible. For example, in 1973, the DSCS-9431 satellite failed as a result of an ESD event.
More recently, the Tempo-2 (1998) and ADEOS-2 (2003) satellites were also similarly lost.
Koons et al (1991, 2000) and Dorman et al (2005) have shown that ESDs appear to be
ultimately responsible for half of all mission failures (e.g. Class 1 anomalies) and correlated with
space weather events.
Wahlund et al (1999) have studied 291 ESD events on the Freja satellite (MEO orbit)
and have found that the number of ESDs increases with increasing Kp. A similar relationship
between increasing Kp and anomaly frequency was found by Fennell et al (2000) for the
SCATHA satellite (near-GEO orbit). These results are consistent with earlier GOES-4 and 5
satellite studies by Farthing et al. (1982) and by Mullen et al. (1986). In addition to Kp, Fennell
et al (2000) and Wrenn, Rogers and Ryden (2002) identified a correlation between 300 keV
electron fluxes and the probability of internal ESDs from the SCATHA satellite. The probability
increases dramatically for electron fluxes in excess of 100,000 pfu. A similar result was found a
number of years earlier by Vampola (1987). At daily total fluences of ~1012 electrons/cm2 the
probability of an ESD occurring on a satellite exponentially reaches 100% (e.g. Baker, 2000).
1.3.2 That Was Then – This is Now.
During the 23rd Sunspot Cycle (1996-2008) there were dozens of satellite malfunctions
and failures noted soon after a major solar storm event, beginning with Telstar-401 (1996) andending with the Japanese research satellite ASCA on October 29, 2003. The current ‘24th’ cycle
has had its own satellite outages and malfunctions of note, with the majority of the solar activity
still several years in the future.
On August 25, 2011 South Africa's $13 million LEO satellite SumbandilaSat failed, and
the explicit cause was stated publically to be 'damage from a recent solar storm', which caused
the satellite's onboard computer to stop responding to commands from the ground station. This
was not, however, the first time this satellite was damaged by radiation. Shortly after its launch
in September 2009, radiation caused a power distribution failure that rendered the Z-axis and
Y-axis wheel permanently inoperable, meaning that the craft tumbles as it orbits and has lost
the ability to capture imagery from the green, blue and xantrophyll spectral bands. The reason
given for the lack of proper radiation hardening was that there was not enough money to do this
properly, and the satellite was built from commercial off-the-shelf (COTS) equipment.
Moreover, SumbandilaSat was intended only as a technology demonstrator. [Martin, 2012]
The case of the Anik F2 'technical anomaly' on October 6, 2011 is a replay of similar
stories during the 23rd cycle. The satellite entered a Safe Mode that caused it to stop
functioning and turn away from Earth. The Boeing satellite was launched in 2004 and was
expected to function for 15 years. The owner of the satellite, Telsat, indicated in public news
articles that they did not believe the problem had to do with the arrival of a CME that reached
Earth early the same morning, but was caused by some other unspecified internal issue with the
satellite itself. It is the first serious anomaly of its kind since the satellite was launched in 2004.
What the news reports failed to mention was that the sun has been relatively quiet for the
majority of this 7 year period. [Mack, 2011]
The temporary outage of Anik F2 caused a number of problems that impacted millions of
people covered by this satellite service. WildBlue satellite ISP in the United States uses Anik F2
to provide broadband services to about a third of its customers. A total of more than 420,000
subscribing households mostly in parts of rural America lost service for several days, along with
ATM service. Canadian Broadcasting Corporation indicated that 39 rural communities, and
7,800 people lost long-distance phone service. The satellite is also used for air traffic control,
causing the grounding of 48 First Air flights, and 1000 passengers, in northern Canada.
Communities in the North West Territories were instructed to activate their emergency responsecommittees, and start using their Iridium phones. [Mack, 2012; CBS News, 2012; Marowits,
2011]
April 5, 2010 - Galaxy 15 experienced an electrostatic discharge that caused a severe
malfunction, rendering the satellite capable of re-transmitting any received signal at full-power,
but not able to receive new commanding [de Shelding, 2011]. Reports cited a space weather
event on April 5 as the probable cause of the electrostatic discharge that was the likely
triggering event, however although Intelsat acknowledged the ESD origin, they categorically
refuted the space weather cause in the April 5 solar event, preferring to declare that the orgin of
the ESD was unknown. A consequence of this type of satellite failure is that Galaxy-15 was
potentially able to interfere with other GEO satellites as it came within 0.5 degrees of their
orbital slots. Thanks to careful, and complex, maneuvering of the satellites to maximize their
distance from this satellite as it entered their orbital slots, AMC-11, Galaxy-13, Galaxy-18,
Galaxy-23 and SatMex-6 and Anik F3 were able to reduce or eliminate interference, and no
impacts to broadcasting were reported or acknowledged. "The fact that you haven't heard about
channels lost or interference is the proof that we have been able to avoid issues operationally,"
said Nick Mitsis, an Intelsat spokesperson. "I don't want to underplay that." [Clark, 2010]. In
January 2011 commanding of the satellite resumed and its ’zombisat’ moniker has been
changed to ‘phoenix’.
1.4 Cellular and Satellite Telephones
Although telephone calls by land lines are among the safest communication technology,
and the most resistant to space weather effects, they have also been in rapid decline thanks to
the wide spread adoption of cellular and mobile phones, especially among the under-30
population. According to an article in The Economist [2009] customers are discontinuing
landline subscriptions at a rate of 700,000 per month, and that by 2025 this technology will have
gone the way of telegraphy. Between 2005 and 2009, the number of households with cell
phone-only subscriptions rose from 7% to 20%. In terms of space weather vulnerability, there is
one important caveat. Without an electrical power grid, conventional land-lines fail, and cell
phones may not be recharged even though the cell towers may have emergency back up power
capability. An example of this vulnerability occurs whenever natural disasters strike and cell
towers are unavailable, or the crushing load of cell traffic renders the local tower networkunusable. Moreover, one does not have to wait for power grid failure to have an impact on cell
phone access during episodes of solar activity.
Insert Figure 4 about here
A seminal paper by Lanzerotti et al. (2005) demonstrates that solar radio bursts, which
occur rather often in an active photosphere, can cause enhanced noise at the frequencies used
by cellphones (900 MHz to 1900 MHz), when the observer’s angle between the cell tower and
the sun is small. This interference effect shows up in the Dropped-Call statistic for east-facing
receivers at sunrise or west-facing receivers at sunset. For a given cell phone and cell tower in
the optimal line-of-sight geometry with respect to the sun on the horizon, dropped calls occur
about once every 3 days during solar maximum, and every 18 days during solar minimum. The
article notes that the detailed, direct, evidence for solar-burst influence on cell phones remains a
proprietary issue not openly available for investigation. The authors note that "solar bursts
exceeding about 1000 sfu (solar flux units, 1 sfu = 10−22 W m−2 Hz−1) can potentially cause
significant interference when the Sun is within the base-station antenna beam, which can
happen for east- or west-facing antennas during sunrise and sunset at certain times of the
year." Because base stations are only vulnerable for about two hours each day during sunrise
and sunset, a typical station might be affected about one day out of 42 for solar maximum, and
one day in 222 during solar minimum.
1.5 GPS-based Systems
Navigation by satellite is not a new technology, and was first introduced by the US Navy
in 1960 with the orbiting of five Transit satellites. This system was replaced by the NAVSTAR-
GPS system in the 1970s. The first commercial use of satellite-based global positioning systems
came less than 1 year after the next generation, 24-satellite 'Block I-GPS' constellation had
been deployed in 1994, when Oldsmobile offered the GuideStar navigation system for its high-
end automobiles. The GPS satellites provided an L1 channel at 1575 MHz capable of 10-meter-
scale precision, that in 1990 was 'selectively degraded' to 100-meter precision. In 1999,
President Clinton ordered that selective availability be turned off, and on May 1, 2000 the
modern era of non-military GPS was ushered-in. Since 2000, the commercial applications ofGPS have enormously expanded to include, not only car navigation aids, but oil extraction, fiber
optic cable deployment, civilian aviation, emergency services, and even expanding public
cellphone services, called apps, to locate nearby stores, restaurants and even parking spaces in
downtown Manhattan! A report by Berg Insight (2011) indicates that GPS-enabled mobile
phones reached 300 million units in 2011, and is expected to reach nearly 1 billion units by
2015.
Although the GPS constellation is stationed in polar orbits that frequently pass through
the van Allen radiation belts in MEO, they are well-shielded and are upgraded every 5-10 years
through replacement satellites such as the Block-II and Block-IIII systems. Although the details
of the frequency of satellite anomalies is highly classified, it can be surmised that a legacy of 40
years of space operations has left the GPS system with a broad assortment of mitigation
strategies for essentially eliminating outages. Nevertheless, there is one aspect of GPS system
operation that cannot be so easily eliminated.
GPS signals must be delivered to ground stations by passage through the ionosphere.
Because radio propagation through an ionized medium causes signal delays, and accurate
timing signals are important in locating a receiver in 3-dimensional space, any changes in
ionospheric electron content along the propagation path will cause position errors in the final
solution. Space weather events, especially X-ray flares, cause increased ionization and
introduce time-dependent propagation delays that can last for many hours until the excess
ionospheric charge is dissipated through recombination. This also causes amplitude and phase
variations called scintillation, which causes GPS receivers to loose lock on a satellite. Since a
minimum of 4 satellites are required to determine a position, excess scintillation can result not
just in a bad position solution, but can cause a loss-of-lock so that not enough satellites are
available for various locations at various times during the event.
When civilian, single-frequency GPS systems using the L1 frequency are used, the
anomalous propagation problem has to be mitigated by reference to a 'GPS Ionospheric
Broadcast Model' and making the appropriate corrections. The resulting accuracy is about 5
meters. But this correction can only work for a limited period of time and so the path-delay
problem is only partially solved. The result is that most civilian GPS systems can be easily
disturbed by solar activity. Dual-frequency GPS systems that operate at L1 (1575 MHz) and L2
(1228 MHz ) can measure the differential propagation of the satellite signal in real-time, and byrelating this to the plasma dispersion equation, calculate the instantaneous total electron
content (TEC) along a path, and then use this to make the requisite on-the-spot timing
correction. In fact, this method can be turned around by using networks of GPS receivers to
actually map out the changing ionospheric structure over many geographic locations. Figure 5
shows one such 'TEC' calculation for April 20, 2012 for 19:00 UT developed by JPL. The black
spots are the GPS receivers in the network. Green indicates a TEC of about 50 x 1016
electrons/meter2 while red indicates 80 x 1016 electrons/meter2. Generally, a TEC of 6 x 10¹⁶
electrons/meter2 corresponds to an uncorrected position error of about 1 meter. The figure
displays potential position errors as high as 13 meters over Chile.
Insert Figure 5 about here
Although the L1 carrier signal can be received without special instrumentation, the L2
timing information is coded and not accessible to non-military receivers. However, by using a
technique called differential GPS, civilian GPS systems now rival, or even exceed, military
precision in those areas where the requisite DGPS ground reference stations are available. If
you are navigating in a large city, DGPS is probably available to you, but if you are 'in the
middle of nowhere' chances are you only have single-frequency GPS to guide you.
We have already discussed this briefly in the context of GPS signal propagation and
ionospheric scintillation. Because many space weather phenomena couple efficiently to the
ionosphere, it is unsurprising that space weather issues have always been foremost in the
discussion of GPS accuracy and reliability even apart from the fact that the GPS satellites
themselves are frequently located in one of the most 'radio-active' regions of the
magnetosphere.
One of the first unclassified studies to quantitatively assess GPS behavior under solar
storm conditions was conducted, inadvertently, by NOAA in 2001. They had set up a network of
70 GPS receivers from Alaska to Florida to test a new weather observation and climate
monitoring system called the GPS-MET Demonstration Network. A major geomagnetic storm
between March 30 and 31 caused significant changes in the GPS formal error, and was
correlated with the published Kp index during the course of the event [NOAA, 2001]. Since
then, a variety of anomalous changes in GPS precision have been definitively traced to, and
found to be correlated with, geomagnetic storms and solar flare events. This also means thatsystems that rely on GPS for high-precision positioning have almost routinely reported
operational upsets of one kind or another. For example [NOAA, 2004]:
October 29, 2003 - the FAA’s GPS-based Wide Area Augmentation System (WAAS) was
severely affected. The ionosphere was so disturbed that the vertical error limit was
exceeded, rendering WAAS unusable. The drillship GSF C.R. Luigs encountered significant
differential GPS (DGPS) interruptions because of solar activity. These interruptions made
the DGPS solutions unreliable. The drillship ended up using its acoustic array at the seabed
as the primary solution for positioning when the DGPS solutions were affected by space
weather.
December 6, 2006 - the largest solar radio burst ever recorded affected GPS receivers
over the entire sunlit side of the Earth. There was a widespread loss of GPS in the
mountain states region, specifically around the four corners region of New Mexico and
Colorado. Several aircraft reported losing lock on GPS. This event was the first of its kind to
be detected on the FAA, WAAS network.
Apart from changes in ionospheric propagation, we have the problem that, if the GPS
signal cannot be detected by the ground station, and the minimum of 4 satellites is not detected,
a position solution will not be available at any accuracy. This situation can arise if the GPS
signal is actively blocked or jammed, or if the natural background radio noise level at the L1 and
L2 frequencies is too high. This can easily happen during radio outbursts that accompany solar
flare events. This happened the day after the December 5, 2006 solar flare, and was intensively
studied by Kintner at Cornell, and presented at the Space Weather Enterprise Forum in
Washington, DC on April 4, 2007 [NOAA, 2007].
1.6 Electrical Power Grids
Although the issue of space weather impacts to the electrical power grid will be covered
more extensively in a future volume, we will review the main points of this vulnerability, provide
concrete examples, and review briefly the impacts and consequences of future large
geomagnetic storms.It has been well known for decades that geomagnetic storms causes changes in the
terrestrial ground current. The most dramatic examples of this effect are in the many reports of
telegraph system failures during the 1800s. So long as a system requires an 'earth ground', its
circuit is vulnerable to the intrusion of geomagnetically-induced currents (GICs). For the electric
power grid, these DC currents do not need to exceed much above 100 amperes in order to do
damage (Odenwald,1999, Kappenmann, 2010 ).
When GICs enter a transformer, the added DC current causes the relationship between
the AC voltage and current to change. It only takes a hundred amperes of GIC current or less to
cause a transformer to overload during one-half of its 60-cycle operation. As the transformer
switches 120 times a second between being saturated and unsaturated, the normal hum of a
transformer becomes a raucous, crackling whine physicists call magnetostriction.
Magnetostriction generates hot spots inside the transformer where temperatures can increase
very rapidly to hundreds of degrees in only a few minutes, and last for many hours at a time.
During the March 1989 storm, a transformer at a nuclear plant in New Jersey was damaged
beyond repair as its insulation gave way after years of cumulative GIC damage. During the 1972
storm, Allegheny Power detected transformer temperature of more than 340 F (171 C). Other
transformers have reached temperatures as high as 750 F (400 C). Insulation damage is a
cumulative process over the course of many GICs, and it is easy to see how cumulative solar
storm and geomagnetic effects were overlooked in the past.
Outright transformer failures are much more frequent in geographic regions where GICs
are common. The Northeastern US with the highest rate of detected geomagnetic activity led
the pack with 60% more failures. Not only that, but the average working lifetimes of transformers
is also shorter in regions with greater geomagnetic storm activity. The rise and fall of these
transformer failures even follows a solar activity pattern of roughly 11 years.
The connection between space weather events and terrestrial electrical systems has
been documented a number of times. Some of these examples are legendary (1989, 2003)
while others are obscure (1903, 1921). Given the great number of geomagnetic storms that
have occurred during the last 100 years, and the infrequency of major power outages, this
suggests that blackouts following a major geomagnetic storm are actually quite rare events.
Consider the following historical cases:November 1, 1903 - The first public mention that electrical power systems could be
disrupted by solar storms appeared in the New York Times, November 2, 1903 "Electric
Phenomena in Parts of Europe". The article described the, by now, usual details of how
communication channels in France were badly affected by the magnetic storm, but the article
then mentions how in Geneva Switzerland, [NYT,1903]
"...All the electrical streetcars were brought to a sudden standstill, and the unexpected
cessation of the electrical current caused consternation at the generating works where all efforts
to discover the cause were fruitless".
May 15, 1921 - The entire signal and switching system of the New York Central Railroad
below 125th street was put out of operation, followed by a fire in the control tower at 57th Street
and Park Avenue. The cause of the outage was later ascribed to a ‘ground current’ that had
invaded the electrical system. Brewster New York, railroad officials formally assigned blame for
a fire destroyed the Central New England Railroad station, to the aurora. [NYT,1921]
August 2, 1972 - The Bureau of Reclamation power station in Watertown, South Dakota
experienced 25,000-volt swings in its power lines. Similar disruptions were reported by
Wisconsin Power and Light, Madison Gas and Electric, and Wisconsin Public Service
Corporation. The calamity from this one storm didn't end in Wisconsin. In Newfoundland,
induced ground currents activated protective relays at the Bowater Power Company. A 230,000-
volt transformer at the British Columbia Hydro and Power Authority actually exploded. The
Manitoba Hydro Company recorded 120-megawatt power drops in a matter of a few minutes in
the power it was supplying to Minnesota.
March 13, 1989 - The Quebec Blackout Storm - Most newspapers that reported this
event considered the spectacular aurora to be the most newsworthy aspect of the storm. Seen
as far south as Florida and Cuba, the vast majority of people in the Northern Hemisphere had
never seen such a spectacle in recent memory. At 2:45 AM on March 13, electrical ground
currents created by the magnetic storm found their way into the power grid of the Hydro-Quebec
Power Authority. Network regulation failed within a few seconds as automatic protective
systems took them off-line one by one. The entire 9,500 megawatt output from Hydro-Quebec's
La Grande Hydroelectric Complex found itself without proper regulation. Power swings tripped
the supply lines from the 2000 megawatt Churchill Falls generation complex, and 18 seconds
later, the entire Quebec power grid collapsed. Six million people were affected as they woke toYou can also read