Spatial trends in the nitrogen budget of the African agro-food system over the past five decades
←
→
Page content transcription
If your browser does not render page correctly, please read the page content below
Environmental Research Letters

LETTER • OPEN ACCESS

Spatial trends in the nitrogen budget of the African agro-food system
over the past five decades
To cite this article: Ahmed S Elrys et al 2019 Environ. Res. Lett. 14 124091

View the article online for updates and enhancements.

                                This content was downloaded from IP address 176.9.8.24 on 29/04/2020 at 10:58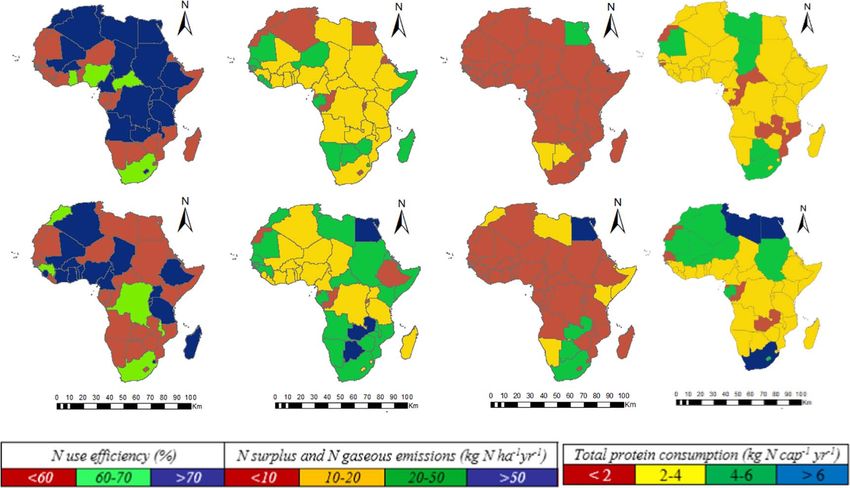
Environ. Res. Lett. 14 (2019) 124091 https://doi.org/10.1088/1748-9326/ab5d9e
LETTER
Spatial trends in the nitrogen budget of the African agro-food system
over the past five decades
OPEN ACCESS
RECEIVED
8 September 2019
Ahmed S Elrys1,2,3, Mohamed K Abdel-Fattah2, Sajjad Raza1,3, Zhujun Chen1,3 and Jianbin Zhou1,3
REVISED 1
26 November 2019
College of Natural Resources and Environment, Northwest A&F University, Yangling, 712100, Shaanxi, People’s Republic of China
2
Soil Science Department, Faculty of Agriculture, Zagazig University, 44511 Zagazig, Egypt
ACCEPTED FOR PUBLICATION 3
Key Laboratory of Plant Nutrition and the Agri-Environment in Northwest China, Ministry of Agriculture, Yangling 712100, Shaanxi,
29 November 2019
People’s Republic of China
PUBLISHED
20 December 2019 E-mail: jbzhou@nwsuaf.edu.cn
Keywords: nitrogen (N) budget, N use efficiency (NUE), N loss, human diet, Africa
Original content from this
work may be used under
the terms of the Creative
Commons Attribution 3.0 Abstract
licence.
Any further distribution of Low nitrogen (N) fertilization is a dominant cause of malnutrition in Africa, but the spatial and
this work must maintain temporal variability of N cycling patterns in Africa remain unclear. This study is the first to perform a
attribution to the
author(s) and the title of detailed analysis of the N cycling patterns of 52 African countries from 1961 to 2016. We calculated the
the work, journal citation
and DOI. N use efficiency (NUE) in crop production, country-specific N fertilization trends, and the impacts of
N fertilization on human protein demand and the environment. Over the past five decades, total N
input to African croplands increased from 20 to 35 kg N ha−1 yr−1, while the application of synthetic
N fertilizers (SNF) increased from 4.0 to 15 kg N ha−1 yr−1. N contributions from animal manure and
biological N fixation remained lower than 10 kg N ha−1 yr−1 and 20 kg N ha−1 yr−1, respectively. The
total N crop production increased from 15 to 22 kg N ha−1 yr−1 from 1961 to 2016. Total N surplus in
Africa increased from 5 to 13 kg N ha−1 yr−1, while estimated gaseous losses increased from 4.0 to
11 kg N ha−1 yr−1. However, NUE declined from 74% to 63% during the past five decades, and
protein consumption increased from 2.99 to 3.78 kg N capita−1 yr−1. These results suggest that Africa
suffers from extremely low N input and that N loss is increasing in agricultural land. We recommend
the implementation of an effective N management strategy incorporating the use of locally available
organic material along with the balanced application of SNF. Such measures will require effective
policy development and cooperation between all stakeholders.
Acronyms and abbreviations currently undernourished (FAO 2017a). Global food
demand has significantly increased over the past 50 years
N Nitrogen
due to rapid population growth and dietary shifts
Mg megagram (1 Mg=106 g) towards meat and dairy consumption (Lassaletta et al
Gg gigagram (1 Gg=109 g) 2016). Africa has the highest proportion of malnour-
SNF synthetic N fertilizer ished people (18% of the population) in the world
ANM animal N manure (Ciceri and Allanore 2019). Low agriculture production
in Africa is a result of poverty, pervasive conflicts, poor
BNF biological N fixation
government performance, unstable climate, land degra-
AND atmospheric N deposition dation, and poor soil fertility (Sasson 2012, FAO 2017b).
NUE N use efficiency Africa’s population is expected to reach 2.5×109 by
2050, which will account for approximately 58% of the
world’s population growth (Worldometers 2018).
1. Introduction Africa imports approximately 40% of its food,
despite its large cropland area and its high proportion
The world is facing a crisis in global food security, as of younger workers (FAOSTAT 2018, Ciceri and Alla-
approximately 8.15×10⁸ people worldwide are nore 2019). Low domestic food production in Africa is
© 2019 The Author(s). Published by IOP Publishing Ltd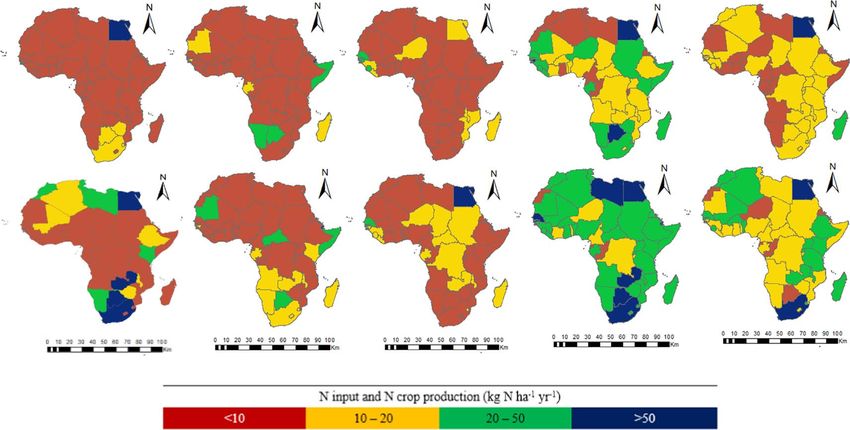
Environ. Res. Lett. 14 (2019) 124091 a result of lower fertilizer application (Li et al 2013). (30.2×10⁶ km2) and population (1.22×10⁹ people) On average, most African countries use
Environ. Res. Lett. 14 (2019) 124091

      Table 1. Agricultural intensification in Africa during 1961–2016 (FAOSTAT 2018).

      Variables                                                                         1961–1965    2011–2016        (%)

      Population                       Population (109)                                   0.31          1.14          268
                                       Rural population %                                  81            60          −25.9

      Agriculture surface (106 ha)     Agricultural area                                  1045          1136         8.71
                                       Arable land                                         157           238         51.6
                                       Cropland                                            173           225         30.1

      Production (kg ha−1 yr−1)        Cereals                                             864          1570         81.7
                                       Citrus fruit                                       6850         10 950        59.9
                                       Coarse grain                                        810          1343         65.8
                                       Fibre crops                                         304           198         −34.9
                                       Fruits                                             5892          8739         48.3
                                       Oil crops (oil equivalent)                          235           166         −29.4
                                       Pulses                                              498           743         49.2
                                       Roots and tubers                                   5846          8529         45.9
                                       Vegetables                                         6637          8583         29.3

      Livestock (106 heads)            Asses                                              10.8          19.7         82.4
                                       Buffaloes                                          1.56          3.86          147
                                       Camels                                             9.37          25.0          167
                                       Cattle                                             128            315          146
                                       Chickens                                           294           1778          505
                                       Goats                                               97            376          288
                                       Horses                                             3.52          6.29         78.7
                                       Pigs                                               6.00          34.0          467
                                       Rabbits and hares                                  2.84          16.0          463
                                       Sheep                                              137            343          150
                                       Turkeys                                            1.34          26.1         1848

      Diet                             Protein supply quantity (g cap−1 d−1)              53.3          69.1         29.6
                                       Animal protein supply quantity (g cap−1 d−1)       10.7          16.1         50.5
                                       Proportion animal protein (%)                       20            23          15.0
                                       Food supply quantity (kg cap−1 d−1)                1.20          2.30         91.7

particularly high increases in the number of turkeys,                input data over the past five decades from the
chickens, goats, cattle, sheep, and buffalo (table 1).               FAOSTAT database (FAOSTAT 2018). Manure appli-
                                                                     cation in Africa is mostly added to cropland and is
                                                                     seldom applied to grasslands (Suttie et al 2005). We
2.1. Nitrogen budget and NUE
                                                                     therefore assumed grassland ANM application to be
We calculated the cultivated area per year for each
                                                                     negligible in this study. The quantity of BNF was
African country over the past 56 years (1961–2016) by
                                                                     calculated based on the yield-based method using the
combining the area of all cropland in each country
                                                                     following equation (Lassaletta et al 2014):
using the FAO database (Elrys et al 2019a). We
calculated the total annual N uptake by crop produc-                                                  Y
                                                                             N Fixed = %Ndfa ´           ´ BGN,              (1)
tion using the annual yield of each crop harvested and                                               NHI
its N content (Lassaletta et al 2014). The total N input
to cropland includes the combined inputs of SNF,                     where % Ndfa is the percentage of N uptake derived from
ANM, AND, and BNF. We used data on SNF                               N fixation, Y is yield (expressed in kg N ha–1 yr–1), NHI is
                                                                     the N harvest index (defined as the ratio of the harvested
consumption during the past five decades from the
                                                                     material to the total above-ground N production), and
IFASTAT (IFA 2018) and FAOSTAT (FAOSTAT 2018)
                                                                     BGN is a multiplicative factor indicating total N2 fixation,
databases. However, the IFA and FAOSTAT data does                    which includes below-ground contributions associated
not distinguish between cropland and grassland, and                  with roots, nodules and rhizo-deposition via exudates
therefore only includes the total amount of agricul-                 and decaying root cells and hyphae. These parameters
tural N used annually for each country. SNF is not                   were collected from Lassaletta et al (2014). We used a
added to grasslands in Africa, and therefore we did not              constant rate of BNF for forage products, rice paddies
subtract the ratio of grassland SNF from the data                    and sugarcane (Herridge et al 2008).
(Heffer et al 2013). AND input was calculated based on                   Following the application of SNF and ANM, we
regional estimates of AND rates on agricultural land                 calculated the loss of N in soils by NH3 volatilization
(Dentener et al 2006) multiplied by the total crop area              using regional emission factors (table 2) reported in
for each country (FAOSTAT 2018). We used ANM                         Bouwman et al (2002). NH3 volatilization emission

                                                        3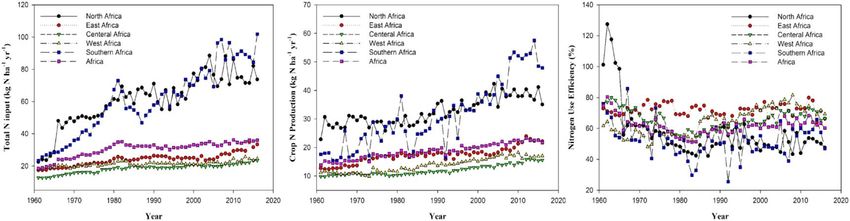
Environ. Res. Lett. 14 (2019) 124091

Table 2. Emissions factors used for the estimation of NH3, NO and     10 kg N ha−1 yr−1 (2011–2016). The highest increase in
N2O emissions.
                                                                      BNF was observed in North Africa from 4.0 kg N ha−1
Gaseous N                                                             (1961–1965) to 16 kg N ha−1 (2011–2016). In contrast,
emissions              Synthetic N     Manure N     Reference         the rate of BNF decreased in western Africa (−12%) and
NH3     Upland             0.19          0.36       Bouwman
                                                                      southern Africa (−48%) (figure 2).
          crops                                       et al (2002)         During 1961–1965, the total N input in Botswana,
        Wetland            0.21          0.33                         Egypt, Guinea-Bissau, Gambia, Mauritius, and Reunion
          rice                                                        was >50 kg N ha−1 yr−1 (figure 2). However, N input in
NO                         1.40          0.13       FAO (2001)        most African countries were moderate to high (figure 2).
N2O                        3.40          4.56       FAO (2001)
                                                                      N input values in Djibouti, Egypt, Libya, Mauritius,
                                                                      Reunion, Seychelles, Senegal, South Africa, and Zambia
                                                                      were categorized as very high in 2011–2016, with total
factors varied with cropland type (upland crops, wet-                 values ranging from 54 kg N ha−1 yr−1 in Senegal to
land rice) and N source (SNF, ANM), which were mul-                   330 kg N ha−1 yr−1 in Egypt. The remaining countries
tiplied by the annual input of SNF and ANM. We also                   were categorized as moderate to high (figure 2). SNF
estimated NO and N2O emissions using the emission
                                                                      input in most African countries was low or moderate dur-
factors (table 2) of developing countries (FAO 2001).
                                                                      ing 1961–1965, but input in South Africa, Botswana, and
The total protein consumption (kg N cap−1 yr−1) was
                                                                      Zimbabwe was categorized as high, and input in Egypt,
calculated using data on the daily intake of protein
                                                                      Mauritius, and Reunion was categorized as very high
(derived from crops, livestock, and fish) per capita
                                                                      (figure 2). During 2011–2016, Egypt, Botswana, Maur-
(FAOSTAT 2018) and its N content (Lassaletta et al
                                                                      itius, South Africa, and Zambia were categorized as very
2014). We calculated the NUE and N surplus using
                                                                      high, while the remaining countries ranged between low
equations (2) and (3), respectively (Raza et al 2018):
                                                                      to high (figure 2). Except for Egypt, whose BNF input was
NUE (%)                                                               categorized as very high, BNF inputs ranged between low
  Total N crop production (N removed from the field)                  to moderate during 1961–2016 in all African countries
=
                    Total N Input                                     (figure 2). Currently, ANM application in most African
´100                                                                  countries is still 70% (figure 5). The NUEs of
2011–2016 (figure 1). Over the past five decades, SNF                   Comoros, the Democratic Republic of the Congo,
showed the highest increase compared to all other N                   Guinea, Malawi, Morocco, and South Africa ranged
inputs from 4.0 kg N ha−1 to 15 kg N ha−1. BNF                        between 60%–70%, while the NUEs in the remaining
increased from 7.0 kg N ha−1 yr−1 (1961–1965) to                      countries were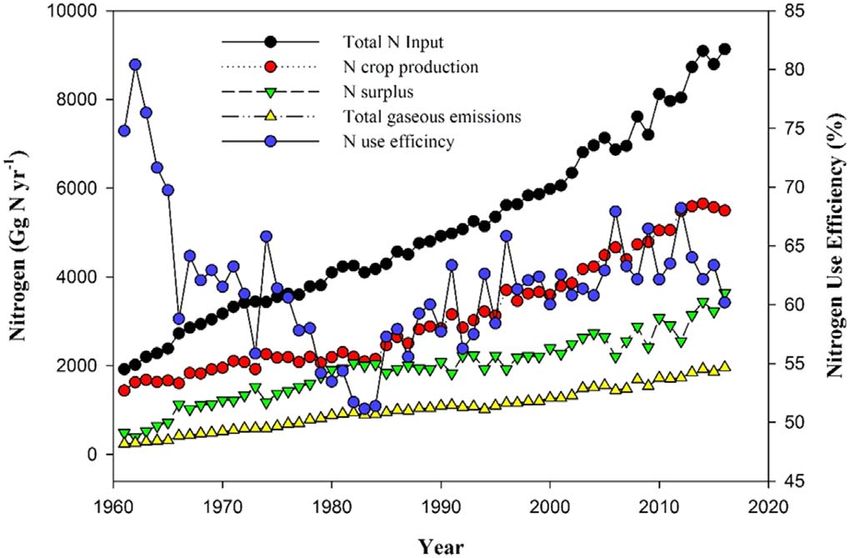
Environ. Res. Lett. 14 (2019) 124091
Figure 1. Historical changes in N input to crops from different sources in croplands of Africa.
Figure 2. Historical changes in the budget of the N input to croplands from different sources and N crop production of African
countries.
3.3. Environmental N loss (figure 3). Estimated gaseous losses in most African
The total N surplus in Africa increased from countries were low in 1961–2016 (figure 2). Gaseous
554 Gg N yr−1 (5 kg N ha−1 yr−1) in 1961–1965 to losses in Namibia, Somalia, Kenya, Libya, and Mor-
3151 Gg N yr−1 (13 kg N ha−1 yr−1) in 2011–2016 occo from 2011 to 2016 were moderate, while losses in
(figure 3). We observed the highest rates of N surplus Botswana, Mauritius, Seychelles, South Africa, and
in South Africa throughout the entire study period. Zambia were high. Egypt alone was categorized as very
N surplus increased significantly in North Africa high with regards to gaseous losses during 2011–2016
from −2.3 kg N ha−1 yr−1 (N mining) in 1961–1965 (figure 2).
to 38 kg N ha−1 yr−1 in 2011–2016 (figure 2). The
highest rates of N surplus were observed in Mauritius 3.4. Human diet
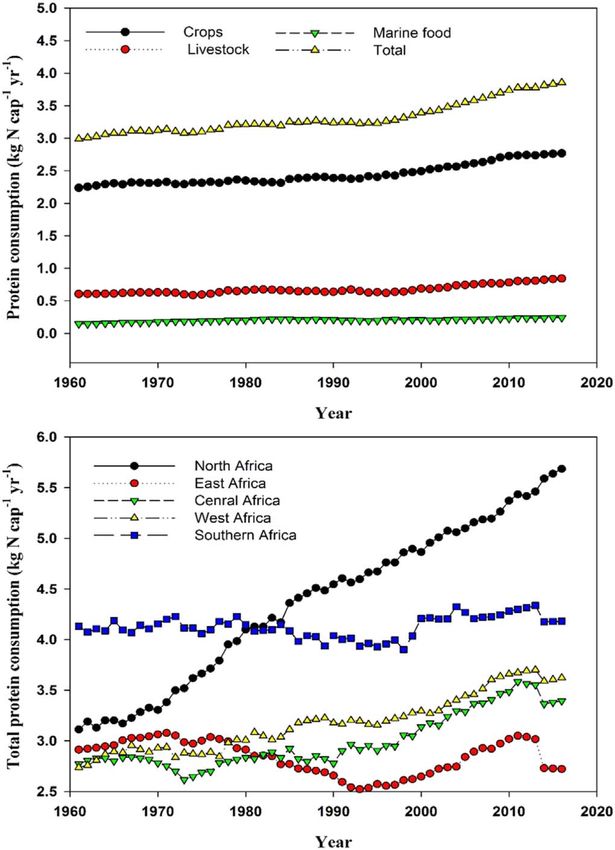
(117 kg N ha−1 yr−1) and Reunion (111 kg N ha−1 yr−1) During the past five decades, protein consumption in
from 1961–1965 and in Egypt (181 kg N ha−1 yr−1), Africa increased from 2.99 to 3.78 kg N cap−1 yr−1,
Botswana (172 kg N ha−1 yr−1), and Mauritius with an increase in the fraction of consumed animal
(156 kg N ha−1 yr−1) in 2011–2016 (figure 3). proteins (including fish) from 25.3% to 27.4%. The
Estimated gaseous losses (NH3–N, N2O–N, highest increase in protein consumption occurred in
NO–N) from African croplands increased from North Africa from 3.1 to 5.7 kg N cap−1 yr−1 (figure 6).
281 Gg N yr−1 (4 kg N ha−1 yr−1) during 1961–1965 to Protein consumption in most African countries was
1823 Gg N yr−1 (11 kg N ha−1 yr−1) during 2011–2016 moderate during 1961–1965 (figure 5). From
5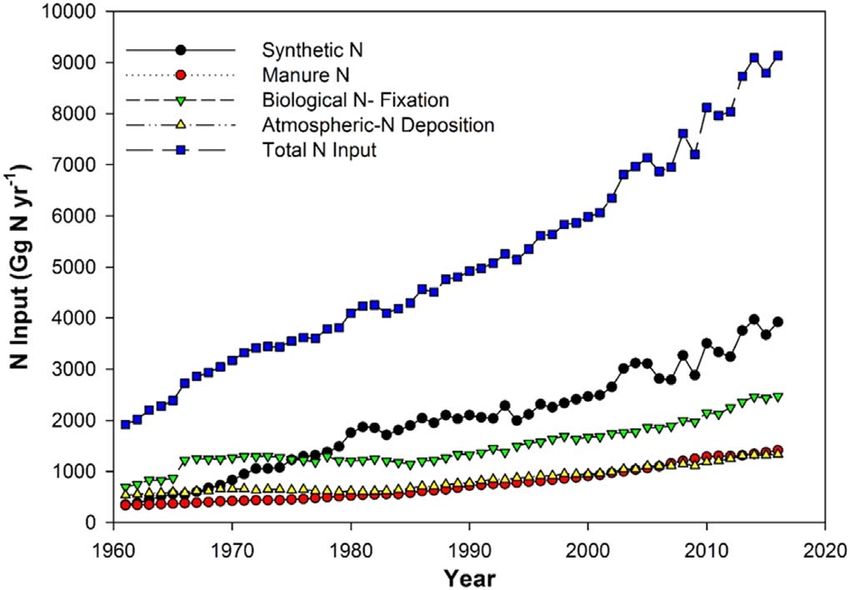
Environ. Res. Lett. 14 (2019) 124091

   Figure 3. Historical changes in the total N input, NUE, N uptake by crops, and N surplus in Africa.

   Figure 4. Historical changes in the total N input, crop N production and N use efficiency in different regions of Africa.

   Figure 5. Historical changes in N use efficiency, N surplus, N gaseous emissions and total protein consumption of African countries.

2011–2016, protein consumption in Egypt, Libya,                          largest absolute increase in animal protein consump-
Tunisia, and South Africa was very high while the                        tion was observed in Angola, Benin, Cabo Verde,
remaining countries were moderate to high. The                           Egypt, Malawi, and Tunisia (figure 6).

                                                          6
Environ. Res. Lett. 14 (2019) 124091
Figure 6. Protein consumption per capita from different food sources in different regions of Africa during 1961–2016.
4. Discussion Ethiopia, Kenya, and Nigeria were free of active ingre-
dients and did not perform their required role (Jefwa
4.1. Status of the N budget and NUE in Africa et al 2014). Animal manure in African agriculture only
Africa is one of the poorest regions on Earth in terms contributes a small percentage of N to the soil due to
of soil fertility, economy, and living standards (Ciceri poor manure management and the application of low
and Allanore 2019). Our results infer low fertilizer quality animal feed (Diogo et al 2013). The lack of
use in African croplands over the past five decades interest from African policy makers and farmers on
(figures 1 and 2). SNF inputs increased by only issues regarding organic N inputs (Ciceri and Alla-
11 kg N ha−1 yr−1 (figure 1). The SNF estimates of this nore 2019) has resulted in poor buying capacity and
study are close to the values estimated by Lassaletta reduced availability of high quality fertilizers.
et al (2014). Reduced availability of SNF to small N crop production only showed a minor increase
farmers in Africa is a result of limited market from 15 to 22 kg N ha−1 yr−1 over the past five decades
opportunities, higher transportation costs, and poor due to low N input in Africa (figure 3). Estimates of
economic conditions for African farmers (Masso et al total crop N production in this study were in the range
2017). Moreover, the results of 369 samples showed of values reported by Lassaletta et al (2014). Poor crop
that urea being sold in the fertilizer market in Uganda yield in Africa is a result of imbalanced nutrient appli-
contained 31% N on average compared to 46% N in cation of predominantly N (90% of applied fertilizers)
the global markets (Bold et al 2015). and limited use of P, K, and micronutrients (Sutton
N inputs from other fertilizer sources such as et al 2013). Furthermore, the observed decrease in
ANM and BNF are also typically low in African agri- NUE in Africa from 74% during 1961–1965 to 63%
culture. Further, organic N fertilizers in Africa are not during 2011–2016 (figure 3) is likely due to failed agro-
always available in sufficient amounts to increase crop nomic practices, such as improper N fertilizer recom-
production (Vanlauwe and Giller 2006), as the appli- mendations and poor yield due to low N fertilizer use
cation of ANM and BNF in most African countries is (Masso et al 2017). As a result, N surplus in Africa
still 22 evaluated rhizobial inoculants in Smaling (1990) estimated N losses from cropland to be
7Environ. Res. Lett. 14 (2019) 124091
31, 68, 112, and 27 kg ha−1 yr−1 in Zimbabwe, the rise of N fertilizer use in these five countries has
Malawi, Kenya and Tanzania, respectively. Further, N inevitably increased N losses and decreased NUE
losses of up to 91 kg N ha−1 has been attributed to (figure 5). N surplus had increased by 342%, 33%,
leaching in Niger (Brouwer and Powell 1998). Esti- 317% and 1203% in Botswana, Mauritius, South
mated gaseous losses increased from 13% to 21% of Africa, and Zambia, respectively, due to the significant
the total N input over the last five decades. N gas emis- decline in NUE (figure 5). Furthermore, fertilizer
sions in Africa is a significant contributor to the global recommendations for particular crops in these coun-
greenhouse gas budget (Thompson et al 2014), and the tries are not updated accordingly (Masso et al 2017).
small increase in the application of SNF and ANM Most farmers in these countries apply excess fertili-
(figure 1) in African agriculture has increased esti- zers, as they believe that higher fertilizer application
mated N gas emissions from 2.3 to 7.7 kg N ha−1 yr−1 results in higher growth (Kassam and Dhehibi 2016).
(figure 3) (Bouwman et al 2013). As a result, N surplus has increased significantly in
N is the main component of amino acids and pro- Egypt from −7.0 kg N ha−1 yr−1 (N mining) to
teins (Masso et al 2017), and thus lower agricultural N 181 kg N ha−1 yr−1 during the last five decades
application leads to lower protein content in crops (Selles (figure 2) due the prominent decline in NUE from
and Zentner 1998). The average African per capita pro- 102% to 45% (figure 4). This decrease can be attrib-
tein consumption (3.78 kg N cap−1 yr−1) is still below uted to excessive N application and a shift from a
the healthy recommendation of 4.0 kg N cap−1 yr−1 dependence on soil N mining to external N input
(figure 6), with 40% the total of protein consumption (Elrys et al 2019a). Further, highest estimated gaseous
contributed from animal sources (1.6 kg N cap−1 yr−1) emissions were recorded in Botswana, Egypt, Maur-
(Billen et al 2015, Lassaletta et al 2016). Under- itius, South Africa, and Zambia reaching 48, 138, 43,
nourishment in Africa (about 18% of the total popula- 25, and 46 kg N ha−1 yr−1, respectively, during
tion) can thus be linked to poor protein content in food 2011–2016. Accelerated N losses from soils in these
(Masso et al 2017). This is particularly prevalent in east- countries are due to high SNF application rates and a
ern Africa (figure 6), where an estimated one-third of the lack of education among farmers (Moawad et al 1984).
population is undernourished (Food Security Informa- The situation in these countries, particularly in Egypt,
tion Network 2018). It is therefore necessary to increase is an example of Africa’s potential future if N fertiliza-
the use of N fertilizers in Africa to improve crop produc- tion rates continue to rise.
tion, grain quality, and malnutrition. However, total N inputs in most African countries
are still less than 50 kg N ha−1 yr−1 (figure 2), while
SNF, ANM, and BNF inputs have not exceeded
4.2. Spatial trends of the N budget and NUE in Africa 20 kg N ha−1 yr−1. This observed reduction in N
The degree of agricultural intensification differs sig- application has resulted in low N crop production,
nificantly between African countries. In some coun- ranging from 5.5 kg N ha−1 yr−1 in São Tomé and
tries such as Botswana, Egypt, Mauritius, South Africa, Príncipe to 34 kg N ha−1 yr−1 in Ethiopia during
and Zambia, excessive N fertilizer use has led to large 2011–2016. Farmers cannot afford to buy high-quality
N surpluses (figures 2 and 5) and subsequent environ- fertilizers, as the gross domestic products per capita of
mental problems (Lassaletta et al 2014). In contrast, most African countries are some of the lowest in the
most other African countries use insufficient amounts world (Shiferaw et al 2014). In addition, subsidies
of N fertilizer, which leads to soil N depletion towards fertilizer use are rare due to poor economic
(Lassaletta et al 2016). We observed high SNF inputs in conditions (Masso et al 2017). In most African coun-
Botswana, Egypt, Mauritius, South Africa, and Zam- tries, the significant decline in the quantity and quality
bia, ranging from 63 kg N ha−1 yr−1 in Zambia to of N input (figures 1 and 2) has led to N depletion and
241 kg N ha−1 yr−1 in Egypt (figure 2). Farmers are land degradation (Masso et al 2017). Depleted soil fer-
typically wealthier in these countries, and N fertilizers tility has resulted in reduced crop yields in Africa at a
are generally more affordable due to government rate of 1.0 Mg ha−1 yr−1 since the 1960s (Masso et al
subsidies (Ciceri and Allanore 2019). High N applica- 2017). N mining was prevalent in Algeria, Egypt, Mor-
tion in these countries are predominantly due to occo, Tunisia, Burundi, Rwanda, and Lesotho during
increasing cropland area, low soil fertility, and the high 1961–1965, and is still prevalent in Burundi, Ethiopia,
N demand of cereals (Masso et al 2017, Elrys et al and Rwanda. Currently, NUEs in Algeria, Tanzania,
2019a). In particular, 37% of the total SNF use in Uganda, Cameroon, Benin, and Togo are >90%
Africa occurs in Egypt (Elrys et al 2019a). (figure 4). These countries will therefore likely suffer
We only observed high N crop production in from N depletion in the near future if N application
Egypt and South Africa, despite the high SNF applica- rates remain low. Soil N depletion in Africa from over-
tion rates in the five countries. Low production in grazing and/or leaching, removal of crop residues
Botswana, Mauritius, and Zambia can be attributed to from fields, volatilization, and erosion has been found
the sharp decrease in NUE (6.5%, 14%, and 39%, to exceed N input through SNF, AND, BNF, and ANM
respectively) caused by poor soil fertility and failed (Kiboi et al 2019). Soil mining is also the cheapest
agricultural practices (Chianu et al 2012). Moreover, source of fertilizer in Africa (Masso et al 2017).
8Environ. Res. Lett. 14 (2019) 124091
Further, there are no incentives for farmers to care for developing countries, such as China, India, Pakistan,
and protect agricultural land, as farmers do not own Bangladesh, and Sri Lanka (IFA 2018). However, this
land in Africa due to land tenure agreements (Henao considerable shift in the N budget has negatively
and Baanante 2006). impacted the environment, despite the resulting
Most African countries suffer from poor agri- increases in grain yield (Elrys et al 2019a). There is thus
cultural production potential, and N losses therefore an urgent need to improve management practices to
still occur due to inefficient N use, despite the high minimize harmful environmental impacts from exces-
availability of N for plant uptake (Masso et al 2017). sive fertilizer application (Raza et al 2018). Several
NUE has noticeably reduced in most African countries developing countries also excessively apply SNF
over the past five decades (figures 3 and 5). Only 10%– though there has been recent improvement. Fertilizer
20% of the N applied through fertilizers is assimilated use in developed countries peaked in 1980 (Edmonds
or recovered in crops under farming practices in et al 2009). For instance, the excessive use of SNF dur-
Africa (Chianu et al 2012). This ineffective use of ferti- ing 1970–1980 in the United Kingdom resulted in ser-
lizers discourages poorer farmers from investing in ious environmental problems such nitrous oxide
quality fertilizers (Woomer et al 2008). The increase in (N2O) emission, eutrophication and soil acidification
SNF application from 3.01 to 7.40 kg N ha−1 yr−1 in (EPA 2017), and drastic changes in agricultural poli-
countries with relatively low SNF inputs (i.e. most Afri- cies after 1980 resulted in higher cereal yields and
can countries) led to an increase in N surplus from 7.96 improved nutrient management—particularly for N
to 12.9 kg N ha−1 yr−1. In response, estimated gaseous (EPA 2017).
emissions increased from 2.74 to 6.33 kg N ha−1 yr−1. The world suffers from high rates of N losses from
On less responsive soils where other constraints are lim- croplands (Lassaletta et al 2014), with the Middle East,
iting, fertilizer application alone results in low NUE and Europe, the USA, India, China, and Central America
crop yields due to the absence of other corrective mea- experiencing N losses at a rate of ∼50 kg N ha–1 yr–1.
sures (Zingore et al 2007). For example, figure 3 shows a On average, N losses remain below 25 kg N ha–1 yr–1 in
sudden decrease in NUE during 1981–1985, followed by most of Africa, Australia, and the former Soviet Union
an increase thereafter. This abrupt change in NUE is due countries (Lassaletta et al 2014). Huge environmental
to the increase in SNF rates adopted by several African N losses from excessive N use in a number of develop-
countries in response to external or government sub- ing countries (e.g. China, Pakistan, Egypt) (Li et al
sidies (Masso et al 2017). However, these subsidies were 2017, Raza et al 2018, Elrys et al 2019a) have resulted in
short-lived due to the poor economy and political soil acidification (Guo et al 2010), water pollution, and
instability in these countries, resulting in a reduction in increased N2O emissions to the atmosphere (Lassa-
SNF application (Chianu et al 2012). In addition, imbal- letta et al 2014). Furthermore, NUE declined from
anced fertilization was rife during this period, as farmers 65%, 58%, and 71% in the 1960s to present-day values
had insufficient experience of fertilizer use (Elrys et al of 25%, 23%, and 44% in China, Pakistan, and Egypt,
2019a). Therefore, low NUE remains a significant agri- respectively (Zhang et al 2015, Raza et al 2018, Elrys
cultural challenge for Africa, particularly under et al 2019a). Therefore, high N losses should be con-
increased N fertilizer application in future. sidered in Africa if SNF application becomes high in
future.
4.3. Global comparisons
A large gap exists between the crop yields of Africa and 4.4. Implications and practical recommendations
rest of the world. Africa’s agricultural land yields only We observed significant changes in the N cycle of a
24% of its potential, while best farming practices from number of African countries during the last five
around the world produces up to three times as much decades, but there was no significant change in the
(AU and NEPAD/NPCA 2006). Grain yields in Africa total African N budget (figure 7). However, it is
average approximately a third of those in East Asia. necessary to increase soil N input and promote NUE
This can be attributed to differences in soil quality and in African agriculture to improve crop production and
low fertilizer application in Africa (Lassaletta et al minimize impacts on human health and the environ-
2014). The global SNF consumption increased from ment (Yuan and Peng 2017, Elrys et al 2019a). Such
9603 to 76 716 Gg N yr−1 over the last five decades progress requires effective management practices at all
(IFA 2018). Of the total 67 113 Gg N yr−1 increase in levels.
SNF consumption between 1961 and 2016, 59%
occurred in Asia, 25.5% in the Americas, 15% in 4.4.1. Increasing N input
Europe, 3.8% in Africa, and 2.5% in Oceania It is widely agreed that increasing SNF input can
(IFA 2018). Further, Africa accounted for only 3.7% of improve agricultural production. However, a number
the world’s SNF consumption in 2016 (IFA 2018). of countries have suffered environmental degradation
In contrast to most African countries, a significant in response to high SNF application. It is therefore
increase in N fertilizer application occurred in other necessary to implement alternative solutions that are
9Environ. Res. Lett. 14 (2019) 124091
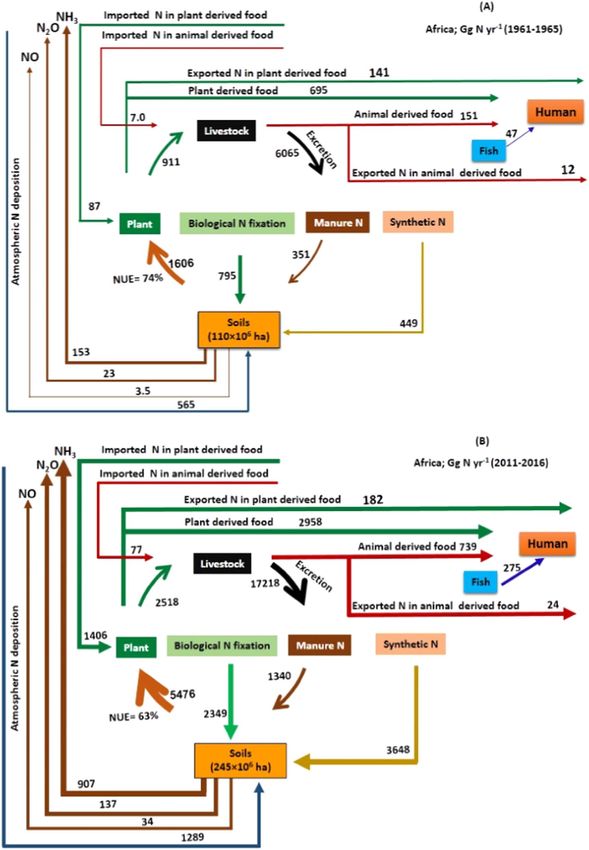
Figure 7. Major changes in N flux in the African agro-food system during the past five decades.
cheap, sustainable, and environmentally friendly— to Africa, the primary advantages of organic N
such as no-till or zero-till farming—to increase fertilizers (even of low quality) over SNFs are their
organic matter, conserve soil and nutrients, and local availability and reduced cost (Masso et al 2017).
promote plant growth (Chianu et al 2012). SNF and Moreover, the cultivation of high-protein N-fixing
organic N inputs (e.g. ANM, BNF, crop residues) play legumes such as pigeon pea, grass pea and soya beans
complementary roles in agroecosystems. With regards can add 412, 80 and 59 kg N ha−1, respectively, to the
10Environ. Res. Lett. 14 (2019) 124091
soil in one season, and are thus considered suitable established for a specific production environment to
green alternatives for growth under African conditions set upper levels of sustainable production. This was
(Maskey et al 2001). Legumes can either be planted done recently by Sela et al (2019) where they calculated
next to grain crops or alternated between seasons regional N surplus targets for different production
(Maskey et al 2001). environments in the US Midwest—accounting for the
Regardless, Africa cannot solve its soil problems different soil types, climate and yield potential in each
without the use of SNF; fertilizer subsidies are there- environment. Farmers can then use these targets to
fore necessary in Africa. An effective N management improve their N management. Perhaps in the future,
strategy should be implemented, which incorporates realistic state-specific N surplus targets could be calcu-
locally available organic material along with the judi- lated for African states, and can aid in increasing pro-
cious and balanced use of SNF (Masso et al 2017). ductivity in a more sustainable way. Our study is a
Increasing the application of SNF will not improve good first step towards understanding N surplus
yields unless effective agronomic practices are fol- trends for African countries.
lowed, such as growing high-yielding crop varieties
that are well-adapted to local conditions and recycling 4.4.3. Designing and strengthening policies
of available organic matter (Roobroeck et al 2015). African governments need to build strong institu-
Further, fertilizer recommendations should be revised tions to create an environment in which small-
to account for balanced crop nutrition (Masso et al holders can intensify their production systems
2017). The balanced use of fertilizers should be incor- (Camara and Heinemann 2006). This can be done
porated into soil fertility management strategies, through the adoption, implementation, and enforce-
including organic applications to complement synth- ment of policies regarding access to output markets,
etic fertilizer use.
land tenure, water, input supplies, and physical and
human capital (Richards et al 2016). For example,
4.4.2. Reducing N loss
when farmers’ ownership of agricultural land is
A number of modern fertilizer techniques have been
made clear and guaranteed through property rights
used to reduce N loss and increase NUE in Africa,
with competitive prices for agricultural land, farmers
including the use of controlled fertilizers, nitrification
will become sensitive to the loss of the productive
inhibitors, and water-soluble fertilizers in irrigation
capacity of the land (Henao and Baanante 2006).
water (Elrys et al 2019a, 2019b). Further, the principles
Governments can reduce fertilizer costs while pro-
of effective use of N input should be adopted, which
moting the expansion of private-sector fertilizer
includes using the appropriate source of N fertilizer
supply networks by organizing the consolidation of
that is applied at the appropriate rate, at the appro-
important fertilizer orders (regional procurement to
priate time, and at the appropriate place (Yuan and
capture economies of scale) and by investing in
Peng 2017). In China, three strategies are widely
transportation infrastructure (Camara and Heine-
applied in agriculture to enhance the NUE of irrigated
mann 2006). In addition, government needs to
rice: (1) real-time N management, (2) three-control
coordinate their policies on organic N input man-
technology (controlling N fertilizer, controlling
agement. It is necessary to organize sensitization
unproductive tillers, controlling pests), and (3) site-
programs to inform policy makers and other actors
specific N management (Yuan and Peng 2017).
of the benefits of organic N input management,
Furthermore, as variability in NUE exists between
giving them a better chance to create a favourable
different crops genotypes, selective breeding of part-
environment for adoption of these practices, com-
icular crop varieties with improved NUE can help to
minimize the need for SNF application (Yu et al 2015). bined with adequate control and enforcement of
Such technologies are necessary for the sustainable such policies (Ndambi et al 2019). Therefore, such
development of African agriculture, particularly if the policies would set fertilizer consumption, produc-
use of SNF becomes more prevalent. tion, and marketing in the wider context of agricul-
Farmers and policy makers need a simple but tural production systems and poverty reduction.
robust indicator to demonstrate progress toward
reducing N losses. McLellan et al (2018) suggested that 4.5. Sources of uncertainty
the N surplus indicator can be used to track the sus- The establishment of long-term agricultural budgets
tainability of a production environment. N surplus is a incorporates several generalizations and presumptions
robust measure of N losses that is easily to calculate (Lassaletta et al 2014). These presumptions are accom-
and its temporal and spatial change over time can be panied by unavoidable uncertainties and restrictions. N
tracked (McLellan et al 2018) as done in our study. N transformation within the soil as well as its uptake by
surplus provides farmers with a means of demonstrat- crops is a complex process, which depends on several
ing to an increasingly concerned public that they are factors and varies greatly even within the same locality.
succeeding in reducing N losses while also improving Unlike developed countries, Africa lack literatures and
the overall sustainability of their farming operation specialized systems which regularly monitor changes in
(McLellan et al 2018). N surplus targets can be N losses. Consequently, we had to rely on some factors
11Environ. Res. Lett. 14 (2019) 124091
for calculation of N budget for whole Africa. For contribution of SNF and a synchronous decrease in the
example, using of specified factors for crops N uptake, contribution of BNF during 2011–2016. Over the last five
AND and BNF as well as emission factors for gaseous decades, NUE in Africa decreased from 74% to 63% and
losses, could be a source of uncertainties in our estimated N surplus increased from 25% to 37% of the total N
results. The estimation of N uptake by crops was based input. Gaseous emissions of N were 13% of the total N
on fixed global nutrient contents (Lassaletta et al 2014). input during 1961–1965, and increased to 21% during
However, N consumption by crops can vary locally 2011–2016. The low use of N in soil results in crops with
according to their genetic potential, management prac- low in protein. African average per capita protein
tices and local environmental conditions (Lassaletta et al consumption is still below the healthy recommendation
2014), but taking these variations into account is (4.0 kg N cap−1 yr−1). Our findings suggest that Africa
unfortunately unaffordable at these time and spatial still faces the challenge of low N in food production,
scales. This study estimated the gaseous N losses follow- excessive N loss in the environment, and a lack of effective
ing territorial emission factors (FAO 2001, Bouwman policies and awareness. To address these issues, African
et al 2002), which are relatively dated and may produce governments must adopt effective N management strate-
intermediate values for developing countries. Our Afri- gies that incorporate locally available organic material and
can estimates of N gaseous emissions (10 kg N ha−1 yr−1 promote the judicious use of SNF. Modern fertilizer
in 2014) are consistent with estimates by Galy-Lacaux techniques (controlled release fertilizers, nitrification
and Delon (2014) (7–11 kg N ha−1 yr−1 in 2014). inhibitors, etc) have been shown to decrease N losses and
However, a lot of uncertainties still remain, as N gaseous increase NUE. African governments must also adopt new
losses are highly variable even within the same field. and effective policies to reduce fertilizer prices and
There is need to establish long-term experimentations in increase their availability in the market. In addition,
different regions of Africa to accurately estimate N government should coordinate their policies with regards
transformation within the soil at a gradient of N to organic input management.
fertilization levels. This will provide basis for accurate
regional modelling of N budget and its losses. Acknowledgments
Also, the AND input was calculated based on regio-
nal estimates of AND rates on agricultural lands multi- This work was supported by the National Key R&D
plied by the total crop area for each country. Accurate Program of China (2017YFD0200106), the National
estimation of AND in Africa require establishment of Natural Science Foundation of China (41671295), and
AND monitoring sites in different regions of Africa. Our the 111 Project (No. B12007).
estimation of BNF on the basis of legumes area could also
bring differences in the final result (Lassaletta et al 2014).
For example, soybean yield varies widely in different Data availability statements
regions of Africa, therefore, BNF estimation based on its
area could produce inaccurate results. Using a specific Any data that support the findings of this study are
regional value of Ndfa instead of a fixed value for each included within the article.
country can also bring uncertainties. Moreover, due to
the lack of data, we did not consider N losses in the form
of NO− 3 –N leaching from African soils or N inputs by
References
irrigation in the N budget. Although there could be some Akudugu M A, Guo E and Dadzie S K 2012 Adoption of modern
differences in the data used in this study, anyhow it still agricultural production technologies by farm households in
provides comprehensive evaluation of African N budget. Ghana: what factors influence their decisions? J. Biol., Agric.
Healthcare 2 1–13
Further analysis and more experimental research would ARD 2009 Awakening Africa’s Sleeping Giant: Prospects for
be still necessary for reducing uncertainties. Finally, our Commercial Agriculture in the Guinea Savannah Zone and
estimates of N inputs are comparable with estimates Beyond ed M Morris, H P Binswanger-Mkhize and D Byerlee
from other sources. Thus, the results of this study reliably (Washington, DC: World Bank Publications)
AU, NEPAD/NPCA 2006 The Abuja Declaration on Fertilizers for an
highlight the issue of low N fertilization in most African African Green Revolution: Status of Implementation at Regional
countries, and we suggest effective measures to manage and National Levels (Addis Ababa and Midrand: Policy Brief
Africa’s N budget in a way that supports crop production African Union and NEPAD Planning and Coordinating Agency)
and environmental protection. Beck H E, Zimmermann N E, McVicar T R, Vergopolan N, Berg A and
Wood E F 2018 Present and future Köppen-Geiger climate
classification maps at 1 km resolution Sci. Data 5 180214
Billen G, Lassaletta L and Garnier J 2015 A vast range of
5. Conclusions opportunities for feeding the world in 2050: trade-off
between diet, N contamination and international trade
African total N input and total N crop production Environ. Res. Lett. 10 025001
increased from 20 and 15 kg N ha−1 during 1961–1965 to Bold T, Kaizzi K C, Svensson J and Yanagizawa-Drott D 2015 Low
Quality, Low Returns, Low Adoption: Evidence from the Market
35 and 22 kg N ha−1 during 2011–2016, respectively. for Fertilizers and Hybrid Seed in Uganda Policy Brief
BNF was the dominant source of N input to croplands International Growth Centre London Working Paper Series
during 1961–1965. We observed an increase in the RWP15-033 HKS Faculty Research
12Environ. Res. Lett. 14 (2019) 124091
Bouwman A F, Boumans L J M and Batjes N H 2002 Emissions of Report International Fertilizer Industry Association (IFA)
N2O and NO from fertilized fields: summary of available Paris, France
measurement data Glob. Biogeochem. Cycle 16 6-1–13 Henao J and Baanante C 2006 Agricultural Production and Soil
Bouwman L, Goldewijk K K, Van Der Hoek K W, Beusen A H W, Nutrient Mining in Africa Implications for Resource
Van Vuuren D P, Willems J, Rufino M C and Stehfest E 2013 Conservation and Policy Development Report International
Exploring global changes in nitrogen and phosphorus cycles Center for Soil Fertility and Agricultural Development
in agriculture induced by livestock production over the Herridge D F, Peoples M B and Boddey R M 2008 Global inputs of
1900–2050 period Proc. Natl Acad. Sci. 110 20882–7 biological nitrogen fixation in agricultural systems Plant Soil
Brouwer J and Powell J M 1998 Increasing nutrient use efficiency in 311 1–18
West-African agriculture: the impact of micro-topography Hickman J E, Tully K L, Groffman P M, Diru W and Palm C A 2015
on nutrient leaching from cattle and sheep manure Agric. A potential tipping point in tropical agriculture: avoiding
Ecosyst. Environ. 71 229–39 rapid increases in nitrous oxide fluxes from agricultural
Camara O and Heinemann E 2006 Overview of the Fertilizer intensification in Kenya J. Geophys. Res. Biogeosci. 120 938–51
Situation in Africa: Background Paper Prepared for the African IFA 2018 Nitrogen statistics from 1961–2015 IFADATA Statistics
Fertilizer Summit June 9-13, Abuja, Nigeria International (ifadata.fertilizer.org/ucSearch.aspx)
Fertilizer Development Center (IFDC) and International Jefwa J M et al 2014 Do commercial biological and chemical
Fund for Agricultural Development (IFAD) products increase crop yields and economic returns under
Chianu J N, Chianu J N and Mairura F 2012 Mineral fertilizers in the smallholder farmers’ conditions? Challenges and
farming systems of sub-Saharan Africa: a review Agron. Opportunities for Agricultural Intensification of Humid
Sustain. Dev. 32 545–56 Highland Systems of Sub-Saharan Africa ed B Vanlauwe et al
Ciceri D and Allanore A 2019 Local fertilizers to achieve food self- (Cham: Springer International Publishing) pp 81–96
sufficiency in Africa Sci. Total Environ. 648 669–80 Jones A et al 2013 Soil Atlas of Africa European Commission
Dentener F et al 2006 Nitrogen and sulfur deposition on regional (Luxembourg: Publications Office of the European Union)
and global scales: a multimodel evaluation Glob. Biogeochem. p 176
Cycles 20 GB4003 Kassam S N and Dhehibi B 2016 Mechanization to Drive A Process for
Dewitte O et al 2013 Harmonisation of the soil map of Africa at the Fertilizer Subsidy Reform in Egypt ERF Policy Brief No.
continental scale Geoderma 211–212 138–53 22 ERF
Diogo R V C, Schlecht E, Buerkert A, Rufino M C and van Wijk M T Kiboi M N, Ngetich F K and Mugendi D N 2019 Nitrogen budgets
2013 Increasing nutrient use efficiency through improved and flows in African smallholder farming systems AIMS
feeding and manure management in urban and peri-urban Agric. Food 4 429–46
livestock units of a West African city: a scenario analysis Agric. Lassaletta L, Billen G, Garnier J, Bouwman L, Velazquez E,
Syst. 114 64–72 Mueller N D and Gerber J S 2016 Nitrogen use in the global
Edmonds D E et al 2009 Cereal nitrogen use efficiency in Sub food system: past trends and future trajectories of agronomic
Saharan Africa J. Plant Nutri. 32 2107–22 performance, pollution, trade, and dietary demand Environ.
Elrys A S, Raza S, Abdo A I, Liu Z, Chen Z and Zhou J 2019a Res. Lett. 11 095007
Budgeting nitrogen flows and the food nitrogen footprint of Lassaletta L, Billen G, Grizzetti B, Anglade J and Garnier J 2014 50
Egypt during the past half century: challenges and year trends in nitrogen use efficiency of world cropping
opportunities Environ. Int. 130 104895 systems: the relationship between yield and nitrogen input to
Elrys A S, Desoky E-S M, Abo El-Maati M F, Elnahal A S, Abdo A I, cropland Environ. Res. Lett. 9 105011
Raza S and Zhou J 2019b Can secondary metabolites Li Q Q, Cui X Q, Liu X J, Roelcke M, Pasda G, Zerulla W,
extracted from Moringa seeds suppress ammonia oxidizers to Wissemeier A H, Chen X P, Goulding K and Zhang F S 2017 A
increase nitrogen use efficiency and reduce nitrate new urease-inhibiting formulation decreases ammonia
contamination in potato tubers? Ecotoxicol. Environ. Saf. 185 volatilization and improves maize nitrogen utilization in
109689 North China Plain Sci. Rep. 7 43853
EPA 2017 Inventory of US Greenhouse Gas Emissions and Sinks: Li X, Tang L, Xu X, Qi G and Wang H 2013 What can Africa learn
1990–2000 (Washington, DC: Office of Atmospheric from China’s experience in agricultural development? IDS
Programs US) Bull. 44 4
FAO 1993 Soil Tillage in Africa: Needs and Challenges (FAO SOILS Maskey S, Bhattarai S, Peoples M and Herridge D 2001 On-farm
BULLETIN) p 69 measurements of nitrogen fixation by winter and summer
FAO 2001 Global Estimates of Gaseous Emissions of NH3, NO and legumes in the Hill and Terai regions of Nepal Field Crops Res.
N2O from Agricultural Land (Rome: Food and Agriculture 70 209–21
Organization of the United Nations) Masso C, Baijukya F, Ebanyat P, Bouaziz S, Wendt J, Bekunda M and
FAO 2017a The State of Food Security and Nutrition in the World Vanlauwe B 2017 Dilemma of nitrogen management for future
2017. Building Resilience for Peace and Food Security food security in sub-Saharan Africa—a review Soil Res. 6 425
(Rome: FAO) McLellan E, Cassman K G, Woodbury P, Sela S, Tonitto C, Eagle A,
FAO 2017b Africa Regional Overview of Food Security and Nutrition. Marjerison R and van Es H M 2018 The nitrogen balancing
The Challenges of Building Resilience to Shocks and Stresses act: tracking the environmental performance of food
(Accra: FAO) production BioScience 68 194–203
FAOSTAT 2018 Statistics Division (Rome: Food and Agriculture Moawad H, Mahmoud S A Z, Badr El-Din S M S, Gamal R F and
Organization of the United Nations) (www.fao.org/faostat/ Enany M H 1984 Transformations and effects of urea
en/#data) derivatives in soil Z. Pflanzenernaehr. Bodenk. 147 785–92
Food Security Information Network 2018 Global Report on Food Ndambi O A, Pelster D E, Owino J O, de Buisonjé F and Vellinga T
Crises, 2018 World Food Programme, Rome 2019 Manure management practices and policies in sub-
Galy-Lacaux C and Delon C 2014 Nitrogen emission and deposition Saharan Africa: implications on manure quality as a fertilizer
budget in West and Central Africa Environ. Res. Lett. 9 125002 Front. Sustain. Food Syst. 3 29
Guo J H, Liu X J, Zhang Y, Shen J L, Han W X, Zhang W F, Nkonya E, Place F, Pender J, Mwanjololo M, Okhimamhe A, Kato E,
Christie P, Goulding K W, Vitousek P M and Zhang F S 2010 Crespo S, Ndjeunga J and Traore S 2011 Climate risk
Significant acidification in major Chinese croplands Science management through sustainable land management in sub-
327 1008–10 Saharan Africa IFPRI Discussion Paper (Washington DC)
Heffer P, Gruère A and Roberts T 2013 Assessment of Fertilizer Use by (https://doi.org/10.1007/978-3-319-61194-5_19)
Crop at the Global Level International Fertilizer Association Raza S, Zhou J, Aziz T, Afzal M R, Ahmed M, Javaid S and Chen Z
(IFA) and International Plant Nutrition Institute (IPNI) 2018 Piling up reactive nitrogen and declining nitrogen use
13Environ. Res. Lett. 14 (2019) 124091
efficiency in Pakistan: a challenge not challenged (1961–2013) Overview of Nutrient Management Centre for Ecology and
Environ. Res. Lett. 13 034012 Hydrology )
Richards M, van Ittersum M, Mamo T, Stirling C, Vanlauwe B and Thompson R L et al 2014 Nitrous oxide emissions 1999 to 2009 from
Zougmoré R 2016 Fertilizers and low emission development a global atmospheric inversion Atmos. Chem. Phys. 14
in sub-Saharan Africa CCAFS Policy Brief no. 11 Copenhagen, 1801–17
Denmark: CGIAR Research Program on Climate Change, Toenniessen G, Adesina A and DeVries J 2008 Building an alliance
Agriculture and Food Security (CCAFS) for a green revolution in Africa Ann. N Y Acad Sci. 1136
Roobroeck D, van Asten P, Jama B, Harawa R and Vanlauwe B 2015 233–42
Integrated Soil Fertility Management: Contributions of Vanlauwe B and Giller K 2006 Popular myths around soil fertility
Framework and Practices to Climate-Smart Agriculture management in sub-Saharan Africa Agric. Ecosyst. Environ.
Climate-Smart Agriculture Practice Brief (Copenhagen, 116 34–46
Denmark: CGIAR Research Program on Climate Change, van Ittersum M K et al 2016 Can sub-Saharan Africa feed itself? Proc.
Agriculture and Food Security (CCAFS)) Natl Acad. Sci. 113 14964–9
Sasson A 2012 Food security for Africa: an urgent global challenge Woomer P L, Bokanga M A and Odhiambo G D 2008 Striga
Agric. Food Secur. 1 2 management and the African Farmer Outlook Agric. 37
Sela S, Woodbury P B, Marjerison R and van Es H M 2019 Towards 245–310
applying N balance as a sustainability indicator for the US Worldatlas 2018 Geography website that aids students, teachers,
Corn Belt: realistic achievable targets, spatio-temporal travelers and parents with their geography, map and travel
variability and policy implications Environ. Res. Lett. 14 064015 questions 100 - 7405 Transcanadienne St. Laurent Quebec
Selles F and Zentner R P 1998 Nitrogen Management for Yield and Canada H4T1Z2 (www.worldatlas.com)
Protein in Wheat in the Brown Soil Zone (Swift Current: Worldometers 2018 Population (www.worldometers.info/)
Agriculture and Agri-Food Canada) (Accessed date: 3 September 2019)
Shiferaw B, Tesfaye K, Kassie M, Abate T, Prasanna B M and Menkir A Yu P, Li X, White P J and Li C 2015 A large and deep root system
2014 Managing vulnerability to drought and enhancing underlies high nitrogen-use efficiency in maize production
livelihood resilience in sub-Saharan Africa: technological, PLoS One 10 e0126293
institutional and policy options Weather Clim. Extremes 3 67–79 Yuan S and Peng S 2017 Exploring the trends in nitrogen input and
Stoorvogel J J and Smaling E M A 1990 Assessment of soil nutrient nitrogen use efficiency for agricultural sustainability
depletion in sub-Saharan Africa, 1983–2000 Rep. 28 Win and Sustainability 9 1905
Staring Centre Wageningen 137 Zhang X, Davidson E A, Mauzerall D L, Searchinger T D,
Suttie J M, Reynolds S G and Batello C 2005 Grasslands of the Worlds Dumas P and Shen Y 2015 Managing nitrogen for sustainable
(Plant Production and Protection Series No. 3) ed A Palmer development Nature 528 51
et al (Rome: Food and Agriculture Organization of the United Zingore S, Murwira H K, Delve R J and Giller K E 2007 Influence of
Nations) nutrient management strategies on variability of soil fertility,
Sutton M A et al 2013 Our Nutrient World: the Challenge to Produce crop yields and nutrient balances on smallholder farms in
More Food and Energy with Less Pollution (Edinburgh: Global Zimbabwe Agric. Ecosyst. Environ. 119 112–26
14You can also read