New Insights into Country of Origin Labeling (COOL): The Effects of Nationalism, Patriotism, and Xenophobia
←
→
Page content transcription
If your browser does not render page correctly, please read the page content below
Marketing Science Institute Working Paper Series 2021
Report No. 21-125

New Insights into Country of Origin Labeling (COOL): The Effects of
Nationalism, Patriotism, and Xenophobia

Anne T. Byrne, Amir Heiman, David R. Just

“New Insights into Country of Origin Labeling (COOL): The Effects of Nationalism, Patriotism, and Xenophobia”
© 2021

Anne T. Byrne, Amir Heiman, David R. Just

MSI Working Papers are Distributed for the benefit of MSI corporate and academic members and the general
public. Reports are not to be reproduced or published in any form or by any means, electronic or mechanical,
without written permission.
New Insights into Country of Origin Labeling (COOL): The Effects of Nationalism,

 Patriotism, and Xenophobia

 Anne T. Byrne, Amir Heiman, David R. Just

 Anne T. Byrne, Cornell University, USA atb83@cornell.edu
 Amir Heiman, The Hebrew University of Jerusalem, Israel amir.heiman@mail.huji.ac.il
 David R. Just, Cornell University, USA drj3@cornell.edu

Date of submission: December 18, 2020
Acknowledgements: The authors acknowledge the funding support from the Binational
Agricultural Research and Development Fund (BARD) under the Project US-4880-16. The
views expressed here are those of the authors and do not necessarily represent the view of
BARD.

 1

Marketing Science Institute Working Paper Series
Introduction

 Country of Origin Labels (COOL) are required on many food products in the U.S. and

E.U. primarily as a means of addressing demands for food safety and traceability. Shoppers

may use COOL to inform product quality expectations. In addition to such expectations, the

labels may trigger positive or negative emotional responses. For example, a shopper may hold

some animosity or goodwill toward a specific country of origin. Such feelings may have root

in general feelings of patriotism, nationalism, xenophobia, or simply a desire to purchase

domestically when given the choice (a sentiment we deem “economic patriotism”). All of

these sentiments, whether driven by quality signaling or emotion, can influence the

consumer’s willingness to pay for a product. In this sense, COOL creates a unique and

differentiated brand for each importing country. Hence, products from different countries will

not be valued equally by the consumer. Rather product valuation may be influenced by the

political or cultural relationship between the home country and the country of origin. In this

regard, it may be that negative feelings toward a particular country could have a pronounced

effect on consumer willingness to pay.

 COOL requirements were put in place to ensure product safety, improve transparency,

and to support demand for domestic products (Brester, Marsh, and Atwood 2004). The 2002

U.S. Farm Bill included regulations on COOL for a variety of products, including fish, meat,

fruits and vegetables (C. Carter, Krissoff, and Zwane 2006). Many products have used their

country of origin to distinguish their products from others in the market. For example, French

wine sells at a premium over wine from other countries. Such country-based branding has

taken on greater importance over the past 20 years as a response to labeling requirements.

However, these requirements are general and apply equally to important trading partners as

well as historical foes. We hypothesize that COOL have differing impacts on product demand

 2

Marketing Science Institute Working Paper Series
by country of origin, with winners determined not just by product quality, but also by general

consumer sentiment for the country of origin.

 COOL regulations have been controversial, with many groups claiming that the costs

of COOL are prohibitive. COOL imposes costs both on producers who must trace their product

inputs, but also on regulators who must verify origins (C. A. Carter and Zwane 2003). While

proponents argue that COOL benefits domestic producers by increasing demand for home

country goods, Carter (2014) points out that regulations would not be necessary if consumers’

willingness to pay for information on country of origin justified the costs. Without strong

regulations and concerted efforts to promote COOL, labeling does not appear to be profitable

for producers (C. Carter, Krissoff, and Zwane 2006). These critics of COOL, however, tend to

consider only domestic products against generically foreign goods. In fact, consumer

willingness to pay for imported goods may depend substantially on the importing country. If

consumers demand a large enough discount to purchase goods from a leading competitor

nation, COOL could preclude competition, leading to a substantial benefit for domestic

producers.

 COOL has had major impacts on agricultural markets. This is especially true in meat

marketing. Early evidence from the literature demonstrates a relatively high price premium

for select U.S. products. For example, Loureiro et al. (2003) found that consumers were willing

to pay an average of $184 annually for a COOL program that would allow them to identify the

origins of beef products. This is a particular concern in the market for meat given food safety

issues such as BSE (Lusk et al. 2006). However, pressure from US trading partners to fight

COOL regulations has led to a partial repeal of COOL requirements in 2015. Requirements

were relaxed on beef and pork to avoid retaliatory tariffs from Canada and Mexico

(Countryman and Bonanno 2019). More recently, two US Senators introduced legislation in

 3

Marketing Science Institute Working Paper Series
late 2019 to “close a loophole” that currently allows beef products which originated abroad

to be labeled a “Product of the U.S.A.” (Shaffer 2019). Such pressure from both sides hints at

the substantial market effects around the globe when consumers’ can discern country of

origin.

 Given COOL’s impact on the global economy, detractors have attacked not just the

economic efficiency, but the spirit of COOL policies. Some regard COOL regulations as overly

protectionist, especially those with interests in import markets that would compete with

domestic products (C. A. Carter and Zwane 2003). These concerns clearly have heterogeneous

impacts on different countries. However, the literature tends to focus on willingness to pay

for domestic products relative to imports from an unspecified country of origin. In addition

to price premiums, some of the literature has examined attitudes towards products. For

example, Lewis and Grebitus (2016) find that ethnocentric shoppers were more likely to

support “Buy American” products and generally more supportive of COOL. Given the

geopolitical nature of COOL, it’s necessary to understand within the particular geopolitical

context the shopper faces. Rather than generically imported goods, shoppers compare

products to competitor products from specific countries of interest, taking into account

attitudes towards those specific countries.

 This study examines COOL policies and consumer attitudes in the context of produce

shopping using an online survey of 10,049 respondents. We look at consumers’ willingness to

pay for grapes from a variety of countries to compare COOL along different geopolitical

relationships. Furthermore, we investigate socio-demographic characteristics, and couch our

analysis in consumers’ displays of the following sentiments: patriotism, nationalism,

xenophobia, and economic patriotism. Countries selected represent a diversity of geopolitical

relationships to the U.S. We ask about products from Canada and Mexico, two major trading

 4

Marketing Science Institute Working Paper Series
partners for the U.S., Israel and the Palestinian Authority, nations about which many have

strong political views, the United Kingdom, a historical ally, and Russia, a historical foe that

has become a recent focal point. These countries were selected to get a variety of countries

about which attitudes and willingness to pay may differ. We examine the importance of socio-

demographics and the four sentiments in determining willingness to pay for grapes from

these countries. We find that not only are these sentiments important, but that consumers’

willingness to pay differ by country of origin and do so in some cases along religious and

political lines. These findings make an important contribution to the ongoing debate over

COOL in the U.S., where many products are required to bear a country of origin label. The

remaining sections of this paper are as follows: the Conceptual Foundations section lays out

the marketing framework and selection of countries on interest, the Methods section

describes the survey design and empirical approach for analyzing metrics for the four

attitudes, the Results section identifies the role of the four sentiments and differences among

the countries of interest, and the Conclusion provides final comments and policy implications

Conceptual Foundations

 COOL is often a way to signal quality, which we expect is true in our analysis. But as a

practice, it goes far beyond mere quality signals. Part of the motivation for COOL regulations

is for consumers to be able to track where their food has come from; thus, COOL fits within a

broader literature on traceability, which refers to the ability to identify food along its supply

chain. Traceability has a broad set of goals, well laid out by Smith et al. (2005). In addition to

the goals that are specific to meat production (e.g. herd surveillance), they note that

traceability may be useful to producers for compliance of foreign and domestic labeling

requirements, to facilitate value-based and value-added marketing, for quality control, and

 5

Marketing Science Institute Working Paper Series
to minimize the impact of product recalls. For consumers who demand traceability when

purchasing, it may serve to signal food quality and food safety. These are of course two of the

goals of the COOL regulations currently in place in the U.S.

 Other forms of traceability labels are protected geographic indicators (PGI’s), which

are a form of intellectual property that requires the name of a geographic place only be used

on products produced there, and protected designations of origin (PDO’s). A classic example

of a PGI is French Champagne, which must be produced in the Champagne region of France

to bear the label calling it Champagne. PGI’s require commitment and coordination from

producers to ensure that their brand is protected and kept profitable for them (Skilton and

Wu 2013). Consumers have demonstrated a willingness to pay a premium for products with

PDO labels (Aprile, Caputo, and Nayga 2012), suggesting that there are geographic indicators

that will yield higher willingness to pay from consumers and that foreign products are not

always seen as inferior to domestic. However, research has found that with COOL, consumers

have a preference for products from their own country with a noticeable demand among

American shoppers for products labeled as being produced in the U.S.A. (Ehmke, Lusk, and

Tyner 2008; Berry et al. 2015; Kong and Rao 2019). This suggests that while general

traceability may be important, COOL may not substitute for more well-established indicators

like PGI’s or PDO’s that are associated with reputations of superior quality resulting from

specific regional conditions. Furthermore, simple country of origin labels versus PGI’s or PDO’s

reference the countries, and not specific regions which may be known for producing quality

goods. Thus, a COOL label may not be able to establish the kind of branding that is possible

with more regionalized indicators. When presented with a country, and not a region, a

shopper may be more inclined to defer to geopolitical relationships and his or her attitudes

 6

Marketing Science Institute Working Paper Series
that inform evaluation of such relationships. Feelings of nationalism, patriotism, xenophobia,

and economic patriotism may thus play a role.

 Indeed, this research posits that the four sentiments investigated- patriotism,

nationalism, xenophobia, and economic patriotism- can shed light on how COOL enters in

willingness to pay and how that differs across countries. We define patriotism as the love of

one’s own country, nationalism as the belief in one’s country’s superiority to other countries,

xenophobia as the belief in the inferiority of certain other groups, and economic patriotism

as the belief that purchasing domestic products is important. While these concepts are

related, they are distinct. Indeed, nationalism and patriotism have been found to be

correlated with negative attitudes toward outside groups (Blank and Schmidt 2003). Finally,

we anticipate that sentiments towards some of the countries of interest will be associated

with “bad events”- war, rivalry, immigration and labor debates- and that such events will have

a particularly negative impact on consumer perceptions (Baumeister et al. 2001). To that end,

what is deemed “bad” may depend on the individual’s identity, including religious or political

affiliation.

Label Behavior Framework

 Because COOL takes the form of labels, it’s important to also understand consumer

responses in the broader framework of perceptions and behaviors regarding food labels. A

label may communicate information (Pirog and Larson 2007), signal quality (Lusk et al. 2006),

act as a brand (Traegear and Gorton 2005), or more than one of the above. We assume in this

context that the country of origin acts as a brand and is thus assessed as such (Kotler and

Gertner 2002). There are several ways to model the consumer’s assessment of the product

with regards to brand interaction, including a brand signaling model (Erdem and Swait 1989),

 7

Marketing Science Institute Working Paper Series
brands as a way of identifying self-concept (Escalas and Bettman 2005), or through a

psychological Attachment-Aversion (AA) Relationship model (Schmitt 2013). All of these

model approaches offer insights that can be applied here, in combination with what is already

known about consumer attitudes towards traceability and consumer interactions with food

labels.

 We adapt the framework from Grunert and Wills (2007) developed for consumer

responses to nutrition information on food labels, which maps out the types of effects that

are possible and may be of interest. The possible effects are shown through the flowchart

model. We inform this with the cognitive processes laid out by Obermiller (1989), who noted

that shoppers’ interactions with the label is likely first a cognitive inferential evaluation based

on quality after which an affective response is triggered based on pre-existing attitudes such

as the four we’ve identified. Our framework, which maps the behavioral path of the shopper,

is described in Figure 1. It begins with the search which occurs when the shopper enters the

store and looks at the products on display. The search results in exposure to two types of

products: domestic and foreign. Perceptions of each are informed by pre-existing attitudes

towards the country “brands” that are presented. For the domestic product, patriotism,

nationalism, and economic patriotism are important in how the shopper regards their own

country as a brand. For the foreign product, xenophobia and nationalism are important in

how the shopper regards the foreign country as a brand. Nationalism is included in both

because nationalistic shoppers use the home country as a point of comparison when

establishing feelings of superiority over other countries.

 8

Marketing Science Institute Working Paper Series
Figure 1: Framework for Understanding Shopper Behavior Regarding COOL

Utility framework

 We motivate our empirical work with a theoretical model of consumer utility. We

assume the arguments of the consumer’s utility function are the good of interest ( " ), where

 represents the COO, the consumer’s expenditure on other goods ( ), self norms and beliefs

( " ), and social feedback ( " ). While the good of interest and consumer’s expenditure are

self-explanatory, the self norms ( " ) and social feedback ( " ) may not be so obvious. We

define self-norms to be a measure of the extent to which an individual behaves in a way that

contributes to his or her values in terms of patriotism, nationalism, xenophobia, and

economic patriotism. In addition to self-norms, a person may also be concerned with the

extent to which his or her behavior aligns with the values of the group. This notion is what we

refer to as social feedback. " and " are numerical variables that assume the value −1 if

is perceived to be rejected by the group norm or self mindset, and 1 if represents a desirable

 9

Marketing Science Institute Working Paper Series
COO in the eyes of the social group or self. These terms also appear in an interaction term,

with coefficient , because there is an expected relationship between self and group norms.

Finally, assuming that the price of other goods, , is 1, the expenditure on other goods is

represented by − " " . Note that the individual is deciding between goods that are

functionally identical (and are thus perfect substitutes) though they come from different

countries. The individual’s utility function for consumption of good " is thus given by

 ( , | , ) = 3 (∑" " ) + 6 ( − ∑" " " ) + ∑"{ " ( " ) " + " ( " ) " + (1)

 ; " ( " ), " ( " )
invoke guilt or punishment for deviation from in-group standards lead us to believe that religious group norms are expected to serve as stronger motives than patriotism or nationalism that are themselves the outcome of many variables such as political affiliation. To that end, in a similar manner to religion, political views may affect food choices (Chambers et al., 2007). Such influence may be the direct or indirect result of correlations with patriotism and nationalism. To investigate the value and make predictions about behaviors, let us suppose that there are two products, identical in quality and varying only in COO. Let = 1 be local produce and = 2 be imported product from a location about which either the individual or their social group has negative emotions (but not both). Because the goods are functionally equivalent, we will presume that purchases of goods 1 and 2 are mutually exclusive, and thus one would purchase the good that yields the highest maximized utility. Thus, we can implicitly define willingness to pay for good 2, , as the price that makes the consumer indifferent between purchasing the two goods, or 3 ( D∗ ) + 6 ( − D D∗ ) + D D∗ + D D∗ + ( D , D ) D∗ (2) = 3 ( F∗ ) + 6 ( − F∗ ) + D F∗ + F F∗ + ( F , F ) F∗ To motivate our empirical work, we wish to investigate the role of group norms in determining WTP for the imported produce holding the price of the domestic produce constant. The magnitude of depends on the level of conformity with the group’s norms; conservative people tend to be more obedient to norms (Frimer et al., 2014) and conservatism is closely associated with religiosity and right wing support (Duriez, 2003). We can totally differentiate (2) with respect to and (the weight of social influence) to find (via the envelope theorem) 11 Marketing Science Institute Working Paper Series
 [ D D∗ − F F∗ ] [1 + J ( D , D ) D D∗ − J ( F , F ) F F∗ ] (3)
 =−
 6K ( − ∙ F∗ ) F∗

The denominator of (3) is clearly positive. If there is no conflict between self and social norms,

or if the individual is compliant, then increasing the weight of social pressure will lead the

individual to alter their willingness to pay for the imported good to conform. If there is

conflict, the case may be much more nuanced. If F ≤ 0, and D , D , F > 0, then

 J ( D , D ) will be positive, while the sign of J ( F , F ) will be indeterminate. In this

case, the buyer caves to the group norm not to purchase from the outside COO (e.g.

animosity, xenophobia or nationalism are present) by decreasing their willingness to pay as

the weight of outside social pressure increases if J ( F , F ) is not negative enough to

overwhelm the other terms. Alternatively, if both social pressure and self-norms value the

good positively, increasing social pressure will increase willingness to pay for the imported

good. Economic patriotism can be represented in this format where D > 0 > F , but may be

mimicked if social influence is perceived as D > 0 > F .

 We next investigate the role of self-norms and beliefs, as captured by the coefficient

 . Certainly, self-norms and beliefs may be related to group norms. We think that self-norms

may manifest in an individual’s sense of obligation to one’s country or as animosity felt

towards a different COO. Such norms may reveal xenophobic beliefs towards the other or

nationalism towards one’s own country. We evaluate the role of in the same manner as we

did for , finding

 [ D D∗ − F F∗ ] [1 + N ( D , D ) D D∗ − N ( F , F ) F F∗ ] (4)
 =−
 6K ( − ∙ F∗ ) F∗

As with external pressure, increasing the weight of self-norms will lead the individual to adjust

their willingness to pay for the foreign good in order to comply with their self-norms in the

absence of conflict between their self-norm and social norm. Conflicts between self and social

 12

Marketing Science Institute Working Paper Series
group could lead to much more nuanced behavior—even self suppression in favor of the

group.

 This framework allows us to see how adherence to self-norms and group norms would

represent sentiments of nationalism, patriotism, xenophobia, and economic patriotism and

how such sentiments impact the premium or discount expect for a foreign or domestic

product. We can further populate it with specific values for " and " to determine the

expected change in WTP.

Countries of interest

 We select six countries to provide points of comparison with domestically (U.S.)

produced grapes. Canada is selected because it is a major trading partner with the United

States, with trade totaling an estimated $718.5 billion in 2018 (“Canada | United States Trade

Representative” 2018). American consumers can thus be assumed be quite familiar with

Canadian products. In terms of diplomatic relations, the United States and Canada have

enjoyed an amicable relationship. We do not expect many of our respondents to harbor

strong hostile attitudes towards Canada the way one would harbor hostile attitudes towards

an adversary in a major conflict.

 We also include another major trading partner from North America: Mexico. While

Mexico also enjoys high trade totals with the United States, the relationship between Mexico

and the United States may be viewed as more tenuous due to controversies over immigration

and migration at the U.S. southern border, which is shared with Mexico. This is further

exacerbated by stories of drug and gang violence in Mexico which have been featured in U.S.

media. To that end, there are Americans who have demonstrated negative sentiments

 13

Marketing Science Institute Working Paper Series
towards Mexico, including xenophobia, which we expect may impact their willingness to pay

for fruit from Mexico when compared to that which is domestically produced.

 The United Kingdom is included because the U.S. and the U.K. are close allies. We

expect there would be little animosity expressed towards the U.K. To that end, we do not

expect heavy discounts expected for products from the U.K. as a result of animosity or high

rankings of the four sentiments of interest. Rather, we expect discounts expected from U.K.

products would reflect distance, and possible attitudes towards the carbon footprint of the

product. In this way, the combination of the U.K. and Canada give us a baseline for countries

where we expect low reporting of negative attitudes. However, the distance in geographic

distance may matter to shoppers considering the environmental impact of the purchase.

 Israel and the Palestinian Authority are included for individual analysis and to compare

to one another. These are nations that have been in conflict for many years and whose conflict

has captured global attention. We expect many American consumers will know of the conflict

and have opinions of the nations as a result. Their stance on the Israeli-Palestinian conflict

may even factor into their willingness to pay for grapes from the two regions as the conflict

intertwined with the two nations’ brands. We do not expect the difference between the two

would be driven by geography or environmental concerns, but rather that any difference

detected could be mapped back to the four sentiments of interest as well as religion

affiliation.

 Finally, Russia is included as it has been a historical foe of the United States and we

anticipate it may be a country that elicits strong feelings of nationalism among American

consumers. Furthermore, at the time of data collection, the U.S. was dealing with the so-

called “Russia probe” and investigations into Russian meddling in the 2016 election. To that

 14

Marketing Science Institute Working Paper Series
end, anti-Russia sentiment may have been stronger than usual which may impact both

willingness to pay.

Product of Interest: Grapes

 We use grapes as the product of interest. While many meat products have been the

topic of debate in COOL regulations, there is evidence that COOL labeling of meat is also

bound up with concerns about food safety (Loureiro and Umberger 2007). We wanted to

minimize concerns about food safety among consumers for this study so that such results

would not need to be disentangled from our main findings. Grapes are grown in all countries

of interest and thus make a suitable product for this study.

Methods

Experimental Design

 This study is completed using an online survey. A field experiment, especially with

altered prices would not be feasible for the research questions laid out for this study because

it would require adjustment of prices which would not be possible in a true shopping context

(Just and Byrne 2019), but a high powered online experiment is sufficient to answer the

questions of interest. The survey was disseminated using Qualtrics survey services to a

general population sample in February 2019. The respondents’ socio-demographic

characteristics are described in Table 1. Notably, this sample skews female and lower income.

However, women are more frequently responsible for food shopping, so we are not

concerned about the gender breakdown. Furthermore, we expect price sensitivities to be

most pronounced among low income and resource constrained shoppers, so we are not

 15

Marketing Science Institute Working Paper Series
concerned with the income breakdown either. Respondents come from across the United

States, with all 50 states represented proportionally to their population.

 Table 1: Socio-demographic characteristics of sample (N = 10,049)
 %
 Gender
 Female 58
 Male 42
 Race
 American Indian or Alaska Native 0.8
 Asian 6.0
 Black or African American 8.2
 Native Hawaiian or Pacific Islander 0.3
 White (including Hispanic) 81.5
 Other 3.2
 Marital Status
 Married 50.6
 Divorced 12.6
 Never Married 32.1
 Widowed 4.7
 Education
 Some high school or less 1.6
 High school diploma 14.9
 Some college 30.9
 Bachelor’s degree 32.6
 Graduate degree 20.0
 Income
 $14,999 or less 28.7
 $15,000 - $29,999 11.9
 $30,000 - $49,999 13.9
 $50,000 - $74,999 16.1
 $75,000 - $89,999 7.9
 $90,000 - $109,999 6.6
 $110,000 - $149,999 7.4
 $150,000 or more 7.5

 The survey asks a series of questions pertaining to the consumer’s willingness to

purchase grapes from the country of interest. They are assured that the quality is identical

between the foreign and domestic grapes. Below is an example of the question asked when

the country of interest is Canada:

 16

Marketing Science Institute Working Paper Series
“If the price of red seedless grapes produced in the US is $2/lb, select the

 maximum price at which you would be willing to buy red seedless grapes

 produced in Canada (if you are not willing to purchase at any price, select

 zero).”

 Respondents were also asked, “Please describe your emotional feelings regarding the

following countries:” followed by the countries listed. They were asked to indicate on a 7-

point Likert scale from “1- dislike very much” to “7- like very much.” These questions provide

country-specific attitudes which are examined alongside general sentiments of patriotism,

nationalism, xenophobia, and economic patriotism.

 To elicit sentiments of patriotism, nationalism, xenophobia, and economic patriotism,

we asked respondents, “how strongly you do agree with the following statements?” followed

by the set of statements presented in Table 2 with a 5-point Likert scale ranging from “1 –

totally disagree” to “5 – totally agree.” For analysis, we take the average Likert skill for each

category so that they are all normalized to a five-point scale where 1 is weakest

demonstration of the sentiment (patriotism, nationalism, xenophobia, economic patriotism)

and 5 is the strongest.

 17

Marketing Science Institute Working Paper Series
Table 2: Statements Corresponding to Sentiments of Interest (5-point scale)
 Patriotism
 I love my country.
 It is important to serve my country.
 I am proud to be an American.
 Patriots are the ones who have made this country great.
 Nationalism
 In view of America’s moral and material superiority, it is only right that we should
 have the biggest say in deciding United Nations policy.
 Foreign nations have done some very fine things, but it take America to do things in
 a big way.
 This country must continue to lead the “Free World.”
 We should do anything necessary to increase the power of our country, even if it
 means war.
 Xenophobia
 Some groups of people are simply not the equals of others.
 In getting what you want, it is sometimes necessary to use force against other
 groups.
 It is OK if some groups have more of a chance in life than others.
 To get ahead in life, it is sometimes necessary to step on other groups.
 If certain groups stayed in their place, we would have fewer problems.
 Economic Patriotism
 Consumption of local produce helps the US economy.
 -Local produce is fresher and have more quality than foreign produce.

Empirical Strategy

 We construct ratings for the sentiments of interest based on respondents’ Likert scale

ratings of the statements shown in Table 2. We construct a linear regression model for

individual = 1, … , who is identifies her willingness to pay for grapes from several different

country ,

 VW = + ⋅ V + ⋅ V + ⋅ W + VW (5)

where, VW is the individual’s willingness to pay for grapes from country ; V

is individual ’s rating for patriotism, nationalism, economic patriotism or xenophobia

(sentiment of interest); V is a vector of characteristics for individual that

are uncorrelated with country . These include age, gender, race, political view, income, state

 18

Marketing Science Institute Working Paper Series
of residence (i.e. state fixed effects), urban environment (i.e. urban, suburban or rural place

of residence); and W is a vector of country fixed effects.

 We additionally test for the interaction between sentiment of interest and country

because we think the effect of the sentiment of interest may differ by country. This

specification is as follows,

 VW = + ⋅ V + ⋅ V + ⋅ W (6)

 + ⋅ W ⋅ V + VW

Equations (5) and (6) are estimated using OLS. Additional statistical analysis is conducted on

subgroups in order to determine the importance of certain socio-demographic characteristics

and the explain analysis of the main results.

Results

 We first conduct an analysis of the relationship between our four sentiments:

nationalism, patriotism, xenophobia, and economic patriotism. We average the five-point

Likert scale values of the questions pertaining to each sentiment. We find that out of a

possible score of 5, the median respondent has a patriotism score of 4.5, indicating a high

degree of patriotism in our sample pool. We find the same, a median score of 4.5, for

respondents’ ratings of economic patriotism. We find these two sentiments to have a

correlation coefficient of 0.452, which indicates that while they are correlated they are not

highly correlated and there are respondents who are patriotic without demonstrating great

economic patriotism and vice versa.

 We find significantly lower numbers for nationalism, with a median score for these

questions of 3.0. This suggests that nationalism is less common than patriotism in our sample

pool. However, we find a correlation coefficient between nationalism and patriotism of 0.540,

 19

Marketing Science Institute Working Paper Series
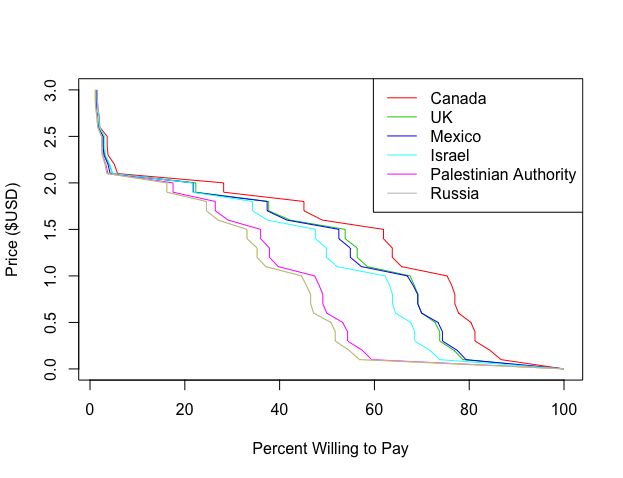
which suggests that nationalism is more highly correlated with patriotism than economic

patriotism. We find even lower scores for xenophobia, with a median score of 2.0.

Furthermore, we find that xenophobia is largely uncorrelated with patriotism with a

correlation coefficient of 0.126. Xenophobia is much more highly correlated with nationalism,

with a correlation coefficient of 0.492. However, it is weakly negatively correlated with

economic patriotism (correlation coefficient of -0.014), indicating that the two sentiments go

in opposite directions. The final pairing is nationalism and economic patriotism, which we find

to be weakly correlated with a correlation coefficient of 0.299. These correlations allow us to

see the extent to which the sentiments we study are related to one another and in what way,

which allows us to better understand the profiles of the respondents we study in later

analyses.

 We next examine differences across the countries used in this study. We find that the

specific country of origin matters in consumers’ willingness to pay (WTP). We plot demand

curves showing the proportion of respondents who selected a given price and display these

curves together for all countries of origin in Figure 2 below. We see that Canada shows the

highest demand curve, indicating that Canada is the country of origin where demand would

most closely match that of demand for American products. Conversely, Russia has the lowest

demand, indicating high discounts expected for Russian grapes.

 20

Marketing Science Institute Working Paper Series
Figure 2: Demand Curves for Grapes by Countries of Origin

 The differing WTP is also captured by the average prices reported, which are displayed

in Table 3. The differences in means with and without the inclusion of zeros are of particular

note for both Russia and the Palestinian Authority, where a high proportion of respondents

selected $0.00, indicating an unwillingness to purchase grapes from these countries.

Table 3: Average WTP for Grapes by Country of Origin (if U.S. Grapes are $2)
 Country Mean WTP Mean WTP Median WTP Median WTP
 (including 0’s) (excluding 0’s) (including 0’s) (excluding
 0’s)
 Canada $1.36 $1.57 $1.50 $1.80
 United Kingdom $1.21 $1.54 $1.50 $1.70
 Mexico $1.20 $1.51 $1.50 $1.70
 Israel $1.11 $1.51 $1.20 $1.60
 Palestinian $0.87 $1.46 $0.60 $1.50
 Authority
 Russia $0.82 $1.44 $0.50 $1.50

 21

Marketing Science Institute Working Paper Series
These initial results serve two purposes. First, they validate our hypothesis that the

countries selected have sufficient differentiation in consumer perceptions. Second, they

highlight key trends that can be explored in more depth. Specifically, we see that the WTP for

grapes from Mexico and the U.K. is nearly identical along the entire supply curve, we see a

distinct discount expected for grapes from the Palestinian Authority when compared to Israel,

and we see a high expected discount for grapes from Russia, with many consumers indicating

an unwillingness to buy them at all. Given the different relationships these countries have

with the United States, we use these results to motivate further analysis in tandem with our

results for metrics associated with xenophobia, nationalism, patriotism, and economic

patriotism.

 We find that Russia and the Palestinian Authority, in particular, have a high proportion

of respondents who were unwilling to purchase grapes from these countries at any price. In

the case of Russia, 4,335 of the 10,049 respondents selected a price of zero. In the case of the

Palestinian Authority, 4,077 of the 10,049 respondents selected a price of zero. We run logit

regressions to understand what types of respondents are driving these results. We find that

for Russia, individuals who are older, have less education (specifically those without a college

degree), and males are driving the proportion of zeros we see in WTP for grapes. In the case

of the Palestinian Authority, we find that individuals who are living in rural environments,

those with lower education (again, those without a college degree), older individuals, and

females were driving the proportion of zeros we see in WTP for grapes.

 We additionally examine the correlations between the four sentiments and attitudes

towards the individual countries to discern the sample’s overall sentiment towards these

countries. This allows us to validate priors laid out in the Conceptual Foundations section. We

 22

Marketing Science Institute Working Paper Series
see a few notable trends emerge. First, nationalism and xenophobia are negatively correlated

with almost every country; this is expected since both sentiments include an evaluation of the

other country or group and a conclusion that the home country or group is best. The notable

exceptions to this are Russia in both categories and Israel in the case of nationalism. With

Russia, this may have to do with the politicization of the Russia probe concerning the Trump

administration and public sentiment surrounding it whereby those who are xenophobic are

also sympathetic to Russia due to political circumstance at the time of data collection. In the

case of Israel, this is likely due to the close relationship shared between the U.S. and Israel

and the notion that they are American allies in the “war on terror” fought in the Middle East.

We see that for patriotism and economic patriotism, more attitudes towards countries are

positively correlated and are most so for the U.S.’s largest trading partner, Canada, and its

historically closest ally, the U.K. Attitudes towards the Palestinian Authority are negatively

correlated with all four sentiments of interest, which may reflect attitudes towards this

formally unrecognized nation. Finally, attitudes towards Mexico are negatively correlated

with all four sentiments suggesting feelings of patriotism and nationalism are in conflict with

positive attitudes towards Mexico, xenophobia is associated with Mexico, and the economic

patriotism that is positively associated with the U.S.’s other neighbor, Canada, is not

associated with Mexico.

Table 4: Correlations Between Sentiments and Attitudes Towards Countries of Interest
 Patriotism Nationalism Xenophobia Economic
 Patriotism
 Canada 0.0371 -0.0950 -0.1620 0.1127
 United Kingdom 0.0867 -0.0664 -0.1480 0.0965
 Mexico -0.0739 -0.1426 -0.1378 -0.0698
 Israel 0.2343 0.1517 -0.0453 0.1032
 Palestinian -0.1519 -0.1600 -0.0467 -0.1318
 Authority
 Russia -0.0127 0.0309 0.1187 -0.1002

 23

Marketing Science Institute Working Paper Series
Impact of Patriotism, Nationalism, Xenophobia and Economic Patriotism on WTP

 We find that all four sentiments of interest- patriotism, nationalism, economic

patriotism, and xenophobia- correspond with decreased willingness to pay. The results from

equation (1) are displayed in Table 5. The metrics for patriotism, nationalism, economic

patriotism and xenophobia are 1-5 rankings where 1 represents the lowest level of that metric

based on a series of questions and 5 represents the highest level. The coefficients represent

the change in WTP resulting from a 1-point increase in the sentiment of interest. For example,

A shift from a nationalism rating of 3 to a nationalism rating of 4 corresponds with an $0.09

reduction in willingness to pay for imported grapes when domestic grapes are $2.00. Thus,

the difference between the willingness to pay of a person with a 1 rating and the willingness

to pay of a person with a 5 rating for nationalism is $0.36.

Table 5: Regression results with no interaction (Eq. 1)
Estimated coefficients for controls (age, gender, race, income, political view, and urban or rural)
are omitted, Canada is excluded to avoid perfect collinearity of countries, standard errors are
displayed below.
 Patriotism Nationalism Economic Xenophobia
 Patriotism
Intercept 1.7429639*** 1.7934663*** 1.9246537*** 1.6380327***
 (0.0548543) (0.0536144) (0.0552799) (0.0533800)
Attitude of -0.0641321*** -0.0884953*** -0.1089691*** -0.0456027***
Interest (0.0043965) (0.0036564) (0.0046771) (0.0034459)
Israel -0.2523734*** -0.2523734*** -0.2523734*** -0.2523734***
 (0.0117035) (0.0116675) (0.0116717) (0.0117072)
Mexico -0.1638870*** -0.1638870*** -0.1638870*** -0.1638870***
 (0.0117035) (0.0116675) (0.0116717) (0.0117072)
Palestinian -0.4975619*** -0.4975619*** -0.4975619*** -0.4975619***
Authority (0.0117035) (0.0116675) (0.0116717) (0.0117072)
Russia -0.547686*** -0.5476863*** -0.5476863*** -0.5476863***
 (0.0117035) (0.0116675) (0.0116717) (0.0117072)
UK -0.1560852*** -0.1560852*** -0.1560852*** -0.1560852***
 (0.0117035) (0.0116675) (0.0116717) (0.0117072)
R-Squared 0.09568 0.1012 0.1006 0.09512

 24

Marketing Science Institute Working Paper Series
We include an additional specification where we interact each country with the

sentiment of interest (patriotism, nationalism, economic patriotism, or xenophobia) as

described in equation (2), with results displayed in Table 6. Generally, we see that for

patriotism, nationalism, and xenophobia, the significant explanatory variables are the metrics

of interest and the country fixed effects, but not the interaction terms, while the significant

explanatory variables for economic patriotism are the metric of interest and the interaction

terms. This suggests that for those who have high levels or economic patriotism, the country

of origin is secondary to their economic patriotism; they simply prefer domestic products. For

the other three metrics, the significance of the interaction term suggests that these metrics

are more (or less) important for some countries of origin than for others. For example, the

interaction term for patriotism and Palestinian Authority is highly significant and negative

while the interaction term for patriotism and Israel is highly significant and positive. This

suggests that for patriotic individuals, a discount is expected for products from the Palestinian

Authority while a premium is accepted when purchasing grapes from Israel as compared to

other foreign countries of origin. Similarly, the interaction coefficients for Russia and the U.K.

with the nationalism metric are positive and significant, suggesting that nationalistic

individuals are more willing to pay a slight premium for grapes from these countries when

compared to grapes from the other countries listed.

 25

Marketing Science Institute Working Paper Series
Table 6: Regression results with interaction (Eq. 2)
Estimated coefficients for controls (age, gender, race, income, political view, and urban or rural) are
omitted, Canada is excluded to avoid perfect collinearity of countries, standard errors are displayed
below.
 Patriotism Nationalism Economic Xenophobia
 Patriotism
Intercept 1.7192903*** 1.9046965*** 1.6381455*** 1.7452223***
 (0.0656593) (0.0584053) (0.0695156) (0.0555342)
Sentiment of Interest -0.0584719*** -0.1241430*** -0.0423798*** -0.0953688***
 (0.0096931) (0.0083130) (0.0108644) (0.0080019)
Israel -0.4870913*** -0.5211869*** -0.0189360 -0.3730754***
 (0.0571922) (0.0379323) (0.0664063) (0.0267908)
Mexico -0.0691875 -0.1341525*** 0.0774972 -0.1896923***
 (0.0571922) (0.0379323) (0.0664063) (0.0267908)
Palestinian Authority -0.2585686*** -0.5519503*** 0.0367751 -0.6297625***
 (0.0571922) (0.0379323) (0.0664063) (0.0267908)
Russia -0.4681748*** -0.8267366*** -0.0718959 -0.8228830***
 (0.0571922) (0.0379323) (0.0664063) (0.0267908)
UK -0.1925301*** -0.2509486*** 0.0780151 -0.2453184***
 (0.0571922) (0.0379323) (0.0664063) (0.0267908)
Sentiment*Israel 0.0561190*** 0.0861510*** -0.0542547*** 0.0560397***
 (0.0133851) (0.0115687) (0.0151940) (0.0111915)
Sentiment*Mexico -0.0226418~ -0.0095295 -0.0561017*** 0.0119810
 (0.0133851) (0.0115687) (0.0151940) (0.0111915)
Sentiment*Palestinian -0.0571412*** 0.0174307 -0.1241888*** 0.0613782***
Authority (0.0133851) (0.0115687) (0.0151940) (0.0111915)
Sentiment*Russia -0.0190105 0.0894317*** -0.1105816*** 0.1277687***
 (0.0133851) (0.0115687) (0.0151940) (0.0111915)
Sentiment*UK 0.0087137 0.0304024** -0.0544088*** 0.0414293***
 (0.0133851) (0.0115687) (0.0151940) (0.0111915)
R-Squared 0.09689 0.1033 0.1019 0.09757
Significance codes:0 0.001 0.01 0.05 0.01 < > 1

 The four sentiments toward local and foreign agricultural products are related to

religion identity and political support. It has been shown (ref) that right wing supporters tend

to be more nationalists and patriotic relative to liberal and supporter of the left wing.

Affiliation to a certain religion defines who you are, who is your social reference group, what

is your moral attitude and in certain cases who are your enemies (e.g., Buddhists and Muslims

in China, Jews and Muslims in the Middle East ). In the next section, we start our analysis by

 26

Marketing Science Institute Working Paper Series
comparing the revealed attitude toward Israel and the Palestinian Authority of American Jews

and Muslims.

Role of Religion

 We examine differences between Jewish and Muslim respondents with a particular

eye towards their willingness to pay for products from the middle east countries. We find that

for American Jews and Muslims, religion plays an important role in willingness to pay. Jewish

respondents willing to pay a much higher price than Muslim respondents for grapes from

Israel. We see this trend flipped in the case of the Palestinian Authority as well as in the case

of Russia, where Muslim respondents are willing to pay far more than Jewish respondents.

Differences in the Means Between Jewish and Muslim Respondents
 Country Mean for Jewish Mean for Muslim t-statistic
 Respondents Respondents (p-value)
 Canada $1.396 $1.318 0.8336
 (0.4056)
 UK $1.312 $1.370 -0.5567
 (0.5784)
 Mexico $1.196 $1.324 -1.3207
 (0.1881)
 Israel $1.418 $1.061 3.3909***
 (
the WTP for grapes from Mexico is strongly dependent on political affiliation, as evidenced in

the demand curves shown in Figure 3 where those who identify as “strong conservative” or

“weak conservative” demonstrate a significantly lower willingness to pay than those who

identify as “strong liberal” or “weak liberal.”

Figure 3: Demand Curves for Mexican Grapes by Political Affiliation

Conclusion

 Country of origin labeling (COOL) is an important manner in which information is

communicated about products in a food retail environment. While a large literature has

explored the effects of COOL on prices and found that it has minor direct effects on the

premium of local produce and the discount of imported produce that consumers expect, the

 28

Marketing Science Institute Working Paper Series
positive relationship between such premiums and discounts to geo-political relationships has

received little academic attention. This paper explores the role of latent sentiments on

willingness to pay (WTP) for produce from a variety of countries when the COOL is present.

We examine the role of patriotism, nationalism, xenophobia, and a sentiment we label as

“economic patriotism” which refers to an individual’s desire to patronize his or her own

country’s goods. While most previous studies have examined COOL in a context where

domestic is compared to foreign, we take things a step further and examine specific countries

in an effort to parse out sentiments about foreign goods among US consumers. Specifically,

we look at key trading partners, Mexico and Canada, a traditional ally, the UK, a traditional

foe, Russia, and two nations about which we anticipate consumers would have political

opinions, Israel and the Palestinian Authority.

 We first examine the relationship between the four sentiments of interest, then turn

to a comparison of the sentiments with general attitudes towards the countries selected for

the study. We find that general sentiments are most negative towards Russia and the

Palestinian Authority, which translates to lower WTP for grapes from these countries. We

further find that political ideology and religion play key roles in both attitudes towards certain

countries and corresponding WTP.

 The results detailed in this paper prove to be tremendously important in considering

how international relations and latent sentiments may play a role in determining how much

can be charged for imported goods. For example, we find that across political ideologies, our

sample of US consumers was unwilling to pay high prices for grapes from Russia. In fact,

almost half of our respondents reported that they would not be willing to pay any price for

such grapes and reported that their WTP was zero for them. This demonstrates a

consequence of deteriorated relations with Russia which have been experienced in the US for

 29

Marketing Science Institute Working Paper Series
decades. It suggests that even if Russian produce was imported at competitive prices, it may

be difficult for it to find a market in the US given American consumers’ reported WTP.

 More generally, these results suggest that latent sentiments of patriotism,

nationalism, xenophobia, and economic patriotism play a crucial role in determining what

American consumers are willing to pay for imported produce. Thus, such sentiments may

work against open trade, leading to higher prices for consumers and greater demand for

domestic products. This leads to important considerations for trade policy whereby national

attitudes and sentiments must be considered when exploring from where imported goods

should come if they are going to do well on the US market.

 The COVID-19 outbreak and its devastating effect on economy, employment and

imports have changes consumers’ attitude toward globalization and localism. The fading of

the “one village” view of the world may have a positive effect on consumers’ willingness to

support local production of produce and increase the discount consumer require for imports

from countries that were not supportive enough during the current crises.

Works Cited

Akerlof, George A. 1980. “A Theory of Social Custom, of Which Unemployment May Be One

 Consequence.” The Quarterly Journal of Economics 94 (4): 749–75.

Aprile, Maria Carmela, Vincenzina Caputo, and Rodolfo M. Nayga. 2012. “Consumers’

 Valuation of Food Quality Labels: The Case of the European Geographic Indication and

 Organic Farming Labels.” International Journal of Consumer Studies 36 (2): 158–65.

 https://doi.org/10.1111/j.1470-6431.2011.01092.x.

Baumeister, Roy F., Ellen Bratslavsky, Catrin Finkenauer, and Kathleen D. Vohs. 2001. “Bad Is

 Stronger Than Good.” Review of General Psychology 5 (4): 323–70.

 30

Marketing Science Institute Working Paper Series
https://doi.org/10.1037/1089-2680.5.4.323.

Berry, Christopher, Amaradri Mukherjee, Scot Burton, and Elizabeth Howlett. 2015. “A COOL

 Effect: The Direct and Indirect Impact of Country-of-Origin Disclosures on Purchase

 Intentions for Retail Food Products.” Journal of Retailing 91 (3): 533–42.

 https://doi.org/10.1016/j.jretai.2015.04.004.

Blank, Thomas, and Peter Schmidt. 2003. “National Identity in a United Germany: Nationalism

 or Patriotism? An Empirical Test With Representative Data.” Political Psychology 24 (2):

 289–312. https://doi.org/10.1111/0162-895x.00329.

Brester, Gary W., John M. Marsh, and Joseph A. Atwood. 2004. “Distributional Impacts of

 Country-of-Origin Labeling in the U.S. Meat Industry.” Journal of Agricultural and

 Resource Economics 29 (2): 206–27.

“Canada | United States Trade Representative.” 2018. United States Trade Representative.

 2018. https://doi.org/2018.

Carter, Colin A. 2014. “Some Trade Implications of the 2014 Agricultural Act.” Choices 29 (3):

 1–4.

Carter, Colin A, and Alix Peterson Zwane. 2003. “Not So Cool? Economic Implications of

 Mandatory Country-of-Origin Labeling.” University of California Giannini Foundation

 Agricultural and Resource Economics Update, 5–7.

Carter, Colin, Barry Krissoff, and Alix Peterson Zwane. 2006. “Can Country-of-Origin Labeling

 Succeed as a Marketing Tool for Produce? Lessons from Three Case Studies.” Canadian

 Journal of Agricultural Economics 54 (4): 513–30. https://doi.org/10.1111/j.1744-

 7976.2006.00064.x.

Chambers, Stephanie, Alexandra Lobb, Laurie Butler, Kate Harvey, and W. Bruce Traill. 2007.

 “Local, National and Imported Foods: A Qualitative Study.” Appetite 49 (1): 208–13.

 31

Marketing Science Institute Working Paper Series
https://doi.org/10.1016/j.appet.2007.02.003.

Countryman, Amanda M, and Alessandro Bonanno. 2019. “A COOL Tale: Economic Effects of

 the U.S. Mandatory Country of Origin Labeling Repeal.” Applied Economic Perspectives

 and Policy 0 (0): 1–23. https://doi.org/10.1093/aepp/ppz016.

Duriez, Bart. 2003. “Religiosity and Conservatism Revisited: Relating a New Religiosity

 Measure to the Two Main Conservative Political Ideologies.” Psychological Reports 92:

 533–39.

Ehmke, Mariah D., Jayson L. Lusk, and Wallace Tyner. 2008. “Measuring the Relative

 Importance of Preferences for Country of Origin in China, France, Niger, and the United

 States.” Agricultural Economics 38 (3): 277–85. https://doi.org/10.1111/j.1574-

 0862.2008.00299.x.

Erdem and Swait. 1989. “Brand Equity As a Signaling Phenomenon.Pdf.”

Escalas, Jennifer Edson, and James R. Bettman. 2005. “Self-Construal, Reference Groups, and

 Brand Meaning.” Journal of Consumer Research 32 (3): 378–89.

 https://doi.org/10.1086/497549.

Frimer, Jeremy A., Danielle Gaucher, and Nicola K. Schaefer. 2014. “Political Conservatives’

 Affinity for Obedience to Authority Is Loyal, Not Blind.” Personality and Social Psychology

 Bulletin 40 (9): 1205–14. https://doi.org/10.1177/0146167214538672.

Grunert, Klaus G., and Josephine M. Wills. 2007. “A Review of European Research on

 Consumer Response to Nutrition Information on Food Labels.” Journal of Public Health

 15 (5): 385–99. https://doi.org/10.1007/s10389-007-0101-9.

Heiman, Amir, Ben Gordon, and David Zilberman. 2019. “Food Beliefs and Food Supply Chains:

 The Impact of Religion and Religiosity in Israel.” Food Policy 83 (June 2017): 363–69.

 https://doi.org/10.1016/j.foodpol.2017.07.007.

 32

Marketing Science Institute Working Paper Series
Just, David R, and Anne T Byrne. 2019. “Evidence-Based Policy and Food Consumer Behaviour:

 How Empirical Challenges Shape the Evidence.” European Review of Agricultural

 Economics 47 (April 2019): 348–70. https://doi.org/10.1093/erae/jbz010.

Kong, Xinyao, and Anita Rao. 2019. “Does Country-of-Origin Marketing Matter?” Working

 Paper. https://doi.org/10.2139/ssrn.3468543.

Kotler, Philip, and David Gertner. 2002. “Country as Brand, Product, and beyond: A Place

 Marketing and Brand Management Perspective.” Journal of Brand Management 9 (4):

 249–61.

Lewis, Karen E., and Carola Grebitus. 2016. “Why U.S. Consumers Support Country of Origin

 Labeling: Examining the Impact of Ethnocentrism and Food Safety.” Journal of

 International Food and Agribusiness Marketing 28 (3): 254–70.

 https://doi.org/10.1080/08974438.2015.1110548.

Loureiro, Maria L., and Wendy J. Umberger. 2007. “A Choice Experiment Model for Beef: What

 US Consumer Responses Tell Us about Relative Preferences for Food Safety, Country-of-

 Origin Labeling and Traceability.” Food Policy 32 (4): 496–514.

 https://doi.org/10.1016/j.foodpol.2006.11.006.

Loureiro, Maria L, Wendy J Umberger, Source Journal, Resource Economics, No August, Maria

 L Loureiro, and Wendy J Umberger. 2003. “Estimating Consumer Willingness to Pay for

 Country-of-Origin Labeling Linked References Are Available on JSTOR for This Article :

 Estimating Consumer Willingness to Pay for Country-of-Origin Labeling” 28 (2): 287–301.

Lusk, Jayson L., Jason Brown, Tyler Mark, Idlir Proseku, Rachel Thompson, and Jody Welsh.

 2006. “Consumer Behavior, Public Policy, and Country-of-Origin Labeling.” Review of

 Agricultural Economics 28 (2): 284–92. https://doi.org/10.1111/j.1467-

 9353.2006.00288.x.

 33

Marketing Science Institute Working Paper Series
You can also read