Spatio-Temporal Dynamics of National Characteristic Towns in China Using Nighttime Light Data
←
→
Page content transcription
If your browser does not render page correctly, please read the page content below
remote sensing
Article
Spatio-Temporal Dynamics of National Characteristic Towns in
China Using Nighttime Light Data
Haipeng Song                 and Tingting He *

                                          School of Public Affairs, Zhejiang University, Hangzhou 310058, China; shp0808@zju.edu.cn
                                          * Correspondence: tthe@zju.edu.cn

                                          Abstract: Characteristic towns have emerged along with China’s economic and social development.
                                          As a new model of small-town development, they have played an essential role in promoting
                                          industrial transformation and upgrade, improving the living environment, and promoting regional
                                          innovation and development. Accurate identification of the expansion characteristics of National
                                          Characteristic Towns (NCTs) is vital for optimizing the spatial layout of characteristic towns and
                                          adjusting the policies of characteristic towns. This study used a dataset on nighttime light to identify
                                          expanding NCTs and measure their expansion from 2000 to 2020. In total, 233 expanding NCTs
                                          were identified, accounting for 58.25% of the NCTs in China. The areas with the most significant
                                          intensity of expansion are primarily located in the East, South, and North economic regions. The
                                          critical period of NCTs expansion primarily occurred in the periods 2008–2011 and 2011–2014. Our
                                          results show that NCTs are highly consistent with the spatial distribution of urban agglomerations,
                                          and the development of NCTs is inherently related to the development of urban agglomerations in
                                          the region. The implementation of NCT policies has significantly promoted the development of NCTs
                                          in the Central and Western economic regions, which face challenging development issues and differ
                                          from those in the Eastern region. The method proposed in this study can effectively identify the ‘hot

                                   spots’ of expanding NCTs and the critical periods of their expansion.
Citation: Song, H.; He, T.
Spatio-Temporal Dynamics of               Keywords: nighttime lights; national characteristic town; urbanization; China
National Characteristic Towns in
China Using Nighttime Light Data.
Remote Sens. 2022, 14, 598. https://
doi.org/10.3390/rs14030598                1. Introduction
Academic Editors: Ahmed Mustafa                 Urbanization is a global socio-economic and geographical phenomenon, especially for
and Andreas Rienow                        Asia, Africa, and Latin America, characterized by lagging development and predominantly
                                          rural population [1,2]. The main manifestations of urbanization are urban expansion and
Received: 11 December 2021
                                          migration of people from rural to urban areas [3,4]. Compared to large cities, small towns
Accepted: 24 January 2022
                                          lack economic efficiency with social–economic development and suffer from economic
Published: 26 January 2022
                                          decline and population loss, resulting in a spatial form of inequality [5–10]. As a bridge con-
Publisher’s Note: MDPI stays neutral      necting the city and the village, small towns have caused widespread attention, especially
with regard to jurisdictional claims in   in China [11–14].
published maps and institutional affil-         As a new model of small-town development, characteristic towns emerge with China’s
iations.                                  economic and social development and play a significant role in promoting industrial trans-
                                          formation and upgrading, improving the living environment, and promoting regional
                                          innovation and development. It has a critical multi-dimensional agglomeration of popula-
                                          tion, industry, and culture. In 2015, Zhejiang province was the first to promote construction
Copyright: © 2022 by the authors.
                                          in characteristic towns [15,16]. After learning from the experience of Zhejiang province
Licensee MDPI, Basel, Switzerland.
This article is an open access article
                                          and considering the uneven development of different regions, the Ministry of Housing
distributed under the terms and
                                          and Urban-Rural Development, the National Development and Reform Commission, and
conditions of the Creative Commons
                                          the Ministry of Finance issued a joint notice on the development of National Character-
Attribution (CC BY) license (https://     istic Towns (NCTs). There were 403 NCTs recognized by the Ministry of Housing and
creativecommons.org/licenses/by/          Urban-Rural Development. Given the number of NCTs at the provincial and county levels
4.0/).

Remote Sens. 2022, 14, 598. https://doi.org/10.3390/rs14030598                                        https://www.mdpi.com/journal/remotesensing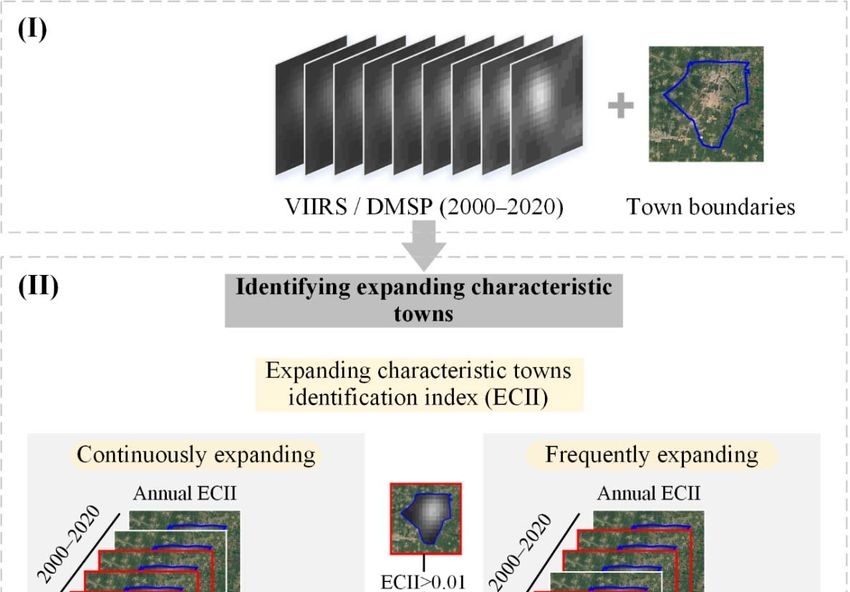
Remote Sens. 2022, 14, 598                                                                                           2 of 17

                             established by local governments, the number of NCTs planned for construction is more
                             than 1000 [17].
                                   Characteristic towns have attracted the attention of many scholars in recent years.
                             Four aspects of NCT research have been recognized. First, the connotation research of
                             NCTs [18,19]. NCTs are not a single platform for industrial gathering, but a form of spatial
                             organization of emerging industries that integrate innovation, production, sales, and
                             services of characteristic industries [20,21]. Second, the functions of NCTs were examined.
                             NCTs are an important carrier and development mode of urbanization [22]. The third point
                             is the construction and development path of the NCTs. It includes construction principles,
                             cultural construction, industrial transformation, and other dimensions [23–26]. Fourth, the
                             spatial structure of NCTs was discussed. Current research generally states that NCTs are
                             developing rapidly [27,28]. However, previous research has failed to use reliable data and
                             methods to reflect the status of NCT development [15,25,27].
                                   Are characteristic towns expanding? This paper attempts to explain and elaborate on
                             this question. This study introduced a new method that uses long-time series calibration
                             integral DMSP/OLS and NPP/VIIRSNL data to identify expanding NCTs and measure
                             their expansion. The objectives of this study are to answer several scientific questions.
                             First, what were the spatiotemporal patterns of NCT expansion? Furthermore, what
                             were the spatiotemporal patterns of NCT expansion intensity and the expansion ratio
                             during the study periods? Finally, has the expected goal of expansion been achieved after
                             implementation of NCT policies? This study provides assistance for optimizing the spatial
                             layout of characteristic towns and guiding the adjustment of NCT policies in China.

                             2. Materials and Methodology
                             2.1. Study Area
                                   The two main types of characteristic towns include Zhejiang and NCTs in China. Zhe-
                             jiang characteristic towns are not traditional administrative towns, but integrate industry,
                             community culture, and tourism. NCTs are organized towns with traditional administra-
                             tive divisions, including distinctive industries, specific populations, and economic scales.
                             In essence, they are an extension of the small-town concept. Small towns refer to communi-
                             ties of a specific size inhabited by people mainly engaged in non-agricultural production
                             activities that differ from large and medium-sized cities and villages. They include state-
                             approved institutional towns and relatively developed rural market towns that have not
                             yet been established.
                                   The main difference between the two versions of characteristic towns is that NCTs fo-
                             cus on organic towns, while Zhejiang characteristic towns focus on industrial development.
                             NCTs have originated from small town development strategies. They are the product of
                             a particular phase of urbanization development. NCTs are proposed from the top down
                             based on the administrative boundaries of organized towns and around their functional
                             positioning [29].
                                   This study focuses on NCTs in mainland China. There are two reasons for this. As
                             a typical representative of small towns, NCTs are the most urbanized small towns (see
                             Table S1 in Supplementary Materials). Second, NCTs are a relatively independent policy
                             target. Identifying the characteristics of NCT expansion is helpful in evaluating the effects
                             of NCTs policy implementation in China.
                                   The NCTs include the first batch of 127 towns in October 2016 [30] and the second
                             batch of 276 towns in August 2017 [31]. The list of NCTs is taken from the official website of
                             the Ministry of Housing and Urban-Rural Development in China. For this study, 400 NCTs
                             were selected to be the focus of research in this article. Three NCTs were not used because
                             of lack of relevant geographic information. Based on the previous studies [32,33], eight
                             economic regions of China were used in this study (Figure 1). Zhejiang province has the
                             highest number of NCTs (23), followed by Jiangsu province and Shandong province, each
                             with 22 NCTs.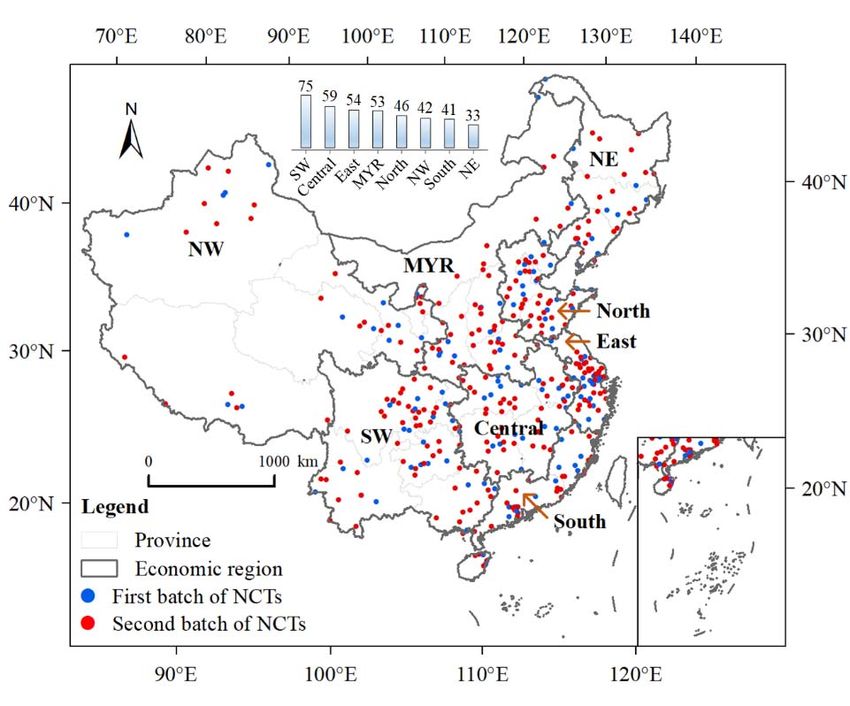
Remote
Remote Sens.Sens.
2022,2022,
14, 14,
598x FOR PEER REVIEW 3 of 19 3 of 17
Figure Spatialdistribution
Figure 1. Spatial distributionof of NCTs
NCTs in China.
in China.
2.2.
2.2. Data Sources
Data Sources
Presently,
Presently, two twotypes
types of data
of data are used
are used to analyze
to analyze dynamic dynamic information
information about charac‐about char-
acteristic
teristic towns. The first type of data refers to social and economic statistics based on ad‐based on
towns. The first type of data refers to social and economic statistics
administrative
ministrative units. units.
TheThe second
second is remote
is remote sensingsensing datamedium
data with with medium resolution
resolution providedprovided
by
by Landsat ThematicPlotter
Landsat Thematic Plotter images
images [34].[34].
ThereThere has always
has always been an been an objective
objective problemproblem
in in
the research
the research of ofcharacteristic
characteristic towns,
towns,i.e.,i.e.,
the the
imperfect mechanism
imperfect mechanismof township statisticsstatistics
of township
leads to
leads to aa lack
lackofofresearch
research data,
data, which
which hinders the development
hinders the development of quantitative researchresearch
of quantitative
such as model evaluation and quantitative measurement
such as model evaluation and quantitative measurement [35]. [35].
Nighttime lights
Nighttime lightsacross
acrossthetheEarth’s
Earth’s surface
surface provide
provide a distinctive
a distinctiveandandeffective per‐ perspec-
effective
spective for observing human activities [36–39]. Remotely sensed nighttime lights have
tive for observing human activities [36–39]. Remotely sensed nighttime lights have been
been shown to correlate with socioeconomic parameters such as population [40–42], eco‐
shown to correlate with socioeconomic parameters such as population [40–42], economic ac-
nomic activity [43], poverty [44,45], and urbanization dynamics [46]. Remote sensing and
tivity [43],light
nighttime poverty
data [44,45], and urbanization
are beneficial dynamics [46].
for their fast acquisition Remote sensing
and updating, and nighttime
strong anti‐in‐
light data are beneficial for their fast acquisition and updating, strong
terference ability, high resolution, lack of light overflow, and intuitive reflection of spatial anti-interference abil-
ity, high resolution,
development patternslack
[47].of light overflow, and intuitive reflection of spatial development
patterns [47]. and NPP/VIIRS data show significant differences in sensor parameters,
DMSP/OLS
DMSP/OLS
spatial resolution, andandspectral
NPP/VIIRS response data show
mode significant
between differences
different in sensor
years, so they cannotparameters,
be
used directly
spatial for comparative
resolution, and spectralanalysis. Therefore,
response mode this study requires
between the systematic
different cor‐ cannot
years, so they
rection
be usedand integration
directly of DMSP/OLSanalysis.
for comparative and NPP/VIIRS NL data
Therefore, thisfrom
study2000requires
to 2020. In
theturn,
systematic
the integration of nighttime light data correction includes
correction and integration of DMSP/OLS and NPP/VIIRS NL data from 2000 DMSP/OLS nighttime light data
to 2020. In
correction,
turn, NPP/VIIRS
the integration nighttime light
of nighttime light data
data correction
correction,includes
DMSP/OLS and NPP/VIIRS
DMSP/OLS nighttime light
nighttime light data integration (Table 1). This study adopted a dataset corrected by Chen
data correction, NPP/VIIRS nighttime light data correction, DMSP/OLS and NPP/VIIRS
[48]. This dataset provides long‐term stable nighttime light data and is recorded as a dig‐
nighttime light data integration (Table 1). This study adopted a dataset corrected by
ital number (DN).
Chen [48]. This dataset provides long-term stable nighttime light data and is recorded as a
digital number (DN).
Table 1. Description of data used in this study.
Data Data Description Time Range Data Source
Annual nighttime stable light data from Version 4 https://dataverse.harvard.edu/dataset.xhtml?
DMSP/
DMSP/OLS Nighttime Light Time Series datasets 2000–2020 persistentId=doi:10.7910/DVN/YGIVCD (accessed on
OLS
Monthly nighttime light data from Version 1 VIIRS 20 October 2021)
NPP/VIIRS
Day/Night Band Nighttime Light datasets
Shape file of county, provincial, and national level
Boundaries 2019 National Catalogue Service for Geographic
regions
Information (https://www.webmap.cn/commres.do?
method=result100W) (accessed on 20 October 2021)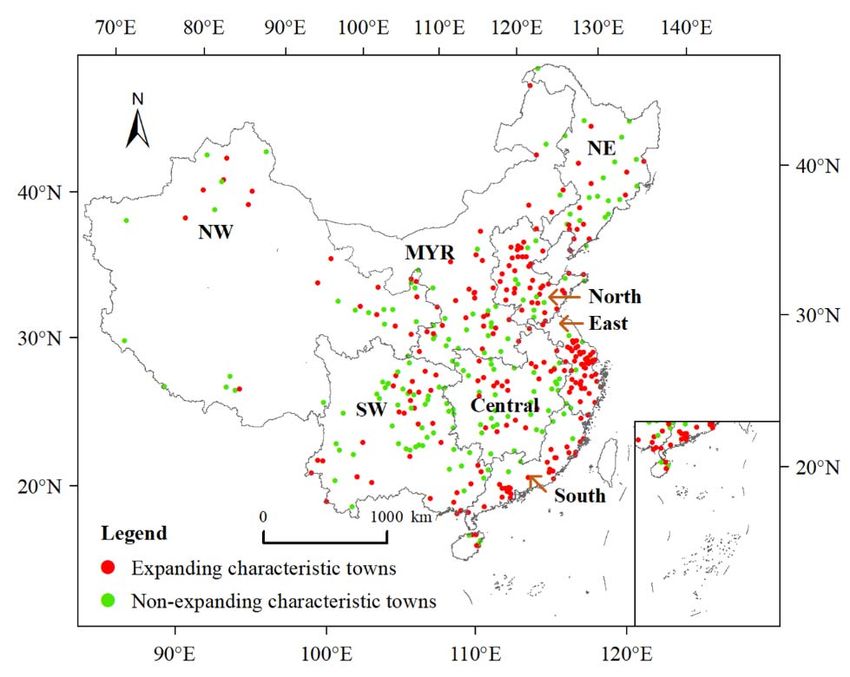
Remote Sens. 2022, 14, 598                                                                                                    4 of 17

                                2.3. Overview Methods
                                            Figure 2 shows the main steps in this study. First, we identified the expansion of
                                       NCTs throughout the study period and focused on the expansion of each town every three
                                       consecutive years by proposing an Expanding NCTs Identification Index (ECII) (Section 2.4).
                                       This paper used adjusted and integrated nighttime lights datasets from 2000 to 2020. Then,
                                       to further quantify the degree of expansion of characteristic towns, we measured the
                                       expansion of NCTs, as well as analyzed their expansion patterns in China. For this, we
    Remote Sens. 2022, 14, x FOR PEER REVIEW                                                                       5 of 19
                                       used two indices named the Characteristic towns Expansion Intensity Index (CEII)    and the
                                       Characteristic towns Expansion Ratio Index (CERI) (Section 2.5).

                                 Figure 2. Procedures for quantification of expanding NCTs using nighttime light data.
                                Figure 2. Procedures for quantification of expanding NCTs using nighttime light data.
                                 2.4. Identification
                                2.4.  Identification ofofExpanding
                                                          ExpandingCharacteristic Towns
                                                                     Characteristic  Towns
                                       Population loss
                                       Population   lossand
                                                         andeconomic
                                                              economicrecession are the
                                                                          recession  aretwo
                                                                                         themost
                                                                                             two commonly    used indicators
                                                                                                  most commonly      used indicators
                                 to identify expanding cities [49]. Thus, the basic assumption is that changes in nighttime
                                to identify expanding cities [49]. Thus, the basic assumption is that changes in nighttime
                                 lights reflect changes in population and economy. Based on previous studies on long‐term
                                 nighttime light data, we defined an expanding characteristic town as one with a substan‐
                                 tial amount of light brightness that is constantly growing. There are two criteria for these
                                 towns: annual growth of over 0.01 for more than three consecutive years or more than half
                                 of the study period. We decided to use these criteria for the following reasons. First, with
                                 regard to research [44], it seems reasonable to set 0.01 as the threshold. Second, due to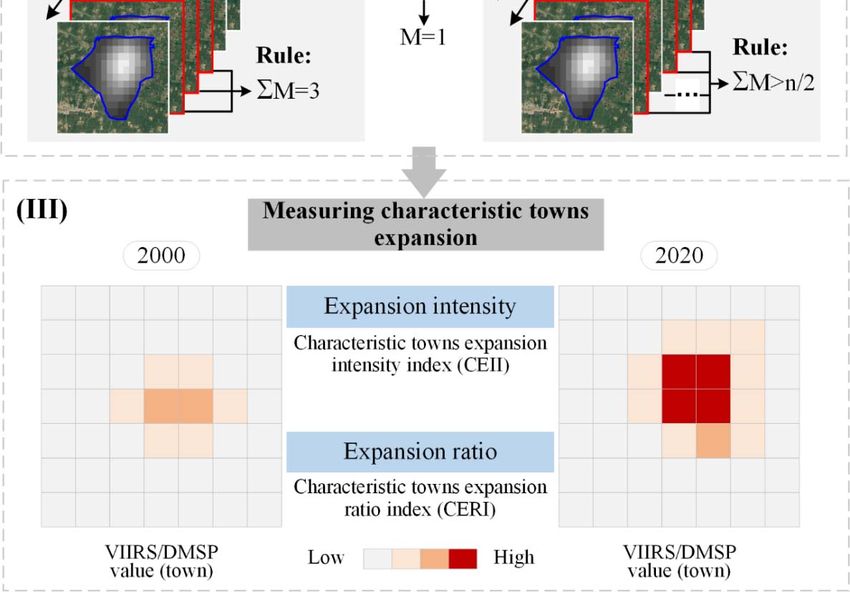
Remote Sens. 2022, 14, 598 5 of 17
lights reflect changes in population and economy. Based on previous studies on long-term
nighttime light data, we defined an expanding characteristic town as one with a substantial
amount of light brightness that is constantly growing. There are two criteria for these towns:
annual growth of over 0.01 for more than three consecutive years or more than half of the
study period. We decided to use these criteria for the following reasons. First, with regard
to research [44], it seems reasonable to set 0.01 as the threshold. Second, due to accidental
errors, it is necessary to perform analyses on DN ranging from 0 to 63 years by year in
order to exclude occasional expansion of NCTs. Third, based on a previous study [50],
we set continuous growth over more than three consecutive years as the standard for the
continuously expanding characteristic towns and over one-third of the study period for
frequently expanding characteristic towns.
To comprehensively understand expanding characteristic towns, we proposed to
expand the Characteristic Towns Identification Index (ECII), which is calculated from year
to year based on Total Digital Numbers (TDN) from 2000 to 2020. This approach helps to
ensure reliable results. Equation (1) applies to nighttime lights data from 2000 to 2020:
TDNt+1 (c) − TDNt (c)
ECI I(t,t+1) (c) = (1)
TDNt (c)
where ECI I(t,t+1) (c) is the ECII of the NCTs cth from the tth year to (t + 1)th year; and
TDNt+1 (c) and TDNt (c) are the TDN values of the characteristic towns cth in (t + 1)th
year and tth year, respectively.
Based on the previously mentioned definition of expanding characteristic towns, we
set three years as the study period. We identified expanding characteristic towns covering
21 years (2000–2020) as well as every three-years between 2000 and 2020, respectively.
During the study period, we examined each characteristic town year by year to
identify whether the characteristic towns were expanding between two adjacent years
using Equation (2) as follows:
1, i f ECI I(t,t+1) (c) > 0.01
M(t,t+1) (c) = (2)
0, i f ECI I(t,t+1) (c) ≤ 0.01
where M(t,t+1) (c) is set as 1, and the characteristic town c is expanding in these two years.
Furthermore, we calculated the expansion of characteristic towns on a time scale
of three consecutive years in order to identify the continuously expanding characteristic
towns and during the whole study period in order to identify the frequently expanding
characteristic towns. Then, we used Equation (3) to check whether the characteristic towns
were actually expanding characteristic towns:
1, i f M(t,t+1) (c) = 1&M(t+1,t+2) (c) = 1&M(t+2,t+3) (c) = 1
0, i f M(t,t+1) (c) = 1&M(t+1,t+2) (c) = 1&M(t+2,t+3) (c) 6= 1
x
x
EC (c) = 1, i f ∑ M(t,t+1) (c) > 2
(3)
1
x
x
0, i f ∑ M(t,t+1) (c) ≤
2
1
where EC (c) = 1, the characteristic town c can be regarded as expanding characteristic
towns. M(t,t+1) (c) is built on Equation (2), where t refers to the consecutive year in the
study period. Furthermore, x is the number of one-year units in the study period. When
the calculation is from 2000 to 2020, then x is 21. When it is 2000–2002, 2002–2005, . . . ,
2017–2020, then x is 3. When x is the total number of periods in 1-year units from 2000 to
2020, as the value of x/2 shall be an integer, we set the value of this study as 10 (10.5).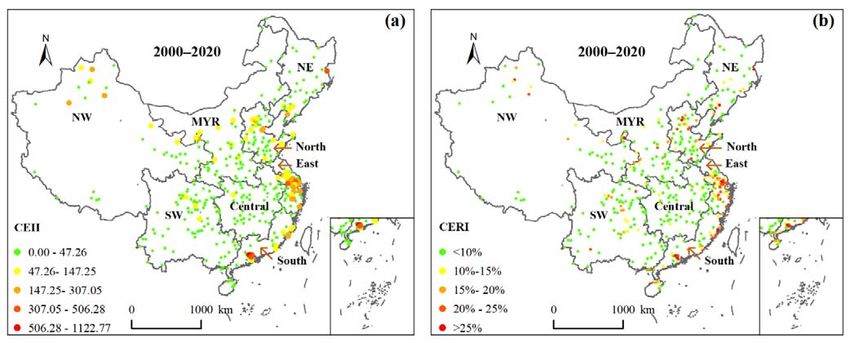
Remote Sens. 2022, 14, 598 6 of 17
2.5. Measuring the Expansion of Characteristic Towns
For nighttime light data, it is common to see non-expanding and expanding pixels
in the same town. Every characteristic town also displays both pixels. In this study, we
mainly focused on expanding pixels. We experimented with values of 0.1, 0.15, 0.2, 0.25,
and 0.3 and finally selected 0.15 as the optimal threshold value. Pixels with a DN increase
of over 0.15 compared to the previous year are defined as expanding pixels, otherwise as
non-expanding pixels. The sum of DN increase in NCTs is defined as the characteristic
town expansion intensity. Meanwhile, the characteristic town expansion ratio defined the
proportion of these expanding pixels to the total number of lit pixels in NCTs.
Initially, we identified a pixel i in characteristic towns as an expanding pixel in cases
where its DN increased by more than 0.15 from t year to (t + 1) year. The Expanding Pixel
Identification Index (EPII) in characteristic towns is calculated as follows:
1, i f DNt+1 (i)− DNt (i) > 0.15
DNt (i )
EPI I(t,t+1) (i ) = (4)
0, i f DNt+1 (i)− DNt (i) ≤ 0.15
DN (i )
t
where if the DN of pixel i in the characteristic towns i increased above 0.15 from t year to
(t + 1) year, then the value of EPI I(t,t+1) (i ) is 1, meaning that pixel i was an expanding
pixel in characteristic towns.
To qualify the expansion intensity of each characteristic town, we proposed the Char-
acteristic Towns Expansion Intensity Index (CEII). In that case, we undertook the annual
calculation of each characteristic town using Equation (5) on nighttime lights data from
2000 to 2020.
CEIIt,(t+1) (n) = ∑ (DN(i,t) (n) − DN(i,t+1) (n)) (5)
CEIIt,(t+1) (n) is the CEI I of the characteristic towns nth from the tth year to the
(t + 1)th year. The DN(i,t) (n) and DN(i,t+1) (n) represent the DN values of the ith expansion
pixel in the characteristic towns nth in the tth year and (t + 1)th year.
We proposed the Characteristic Towns Expansion Ratio Index (CERI) to measure the
characteristic towns’ expansion ratios. Therefore, we calculated the expansion ratio of each
characteristic town with Equation (6) on nighttime lights data from 2000 to 2020.
NEPt+1 (n)
CERIt,t+1 (n) = × 100% (6)
NPt (n)
CERIt,t+1 (n) shows the CERI of characteristic towns nth from the tth year to (t + 1)th
year. NEPt+1 (n) represents the number of expanding pixels of the characteristic towns
from the tth year to the (t + 1)th year in the characteristic towns nth. NPt (n) represents
the total number of lit pixels of the characteristic towns in the tth year.
To understand the patterns of expansion of characteristic towns, we calculated the
average CEII of each characteristic town during 2000–2020:
y
∑1 CEI It,t+1 (n)
MCEI I (n) = (7)
y
where MCEI I (n) is the average CEII of characteristic towns n from 2000 to 2020. CEI It,t+1 (n)
is CEII from t year to (t + 1). For t ∈ [1, 21], y represents the 21 years (2000–2020) in this
study. Moreover, this study includes the CERI averages of each characteristic town from
2000 to 2020, which were calculated using Equation (8) as follows.
y
∑1 CERIt,t+1 (n)
MCERI (n) = (8)
y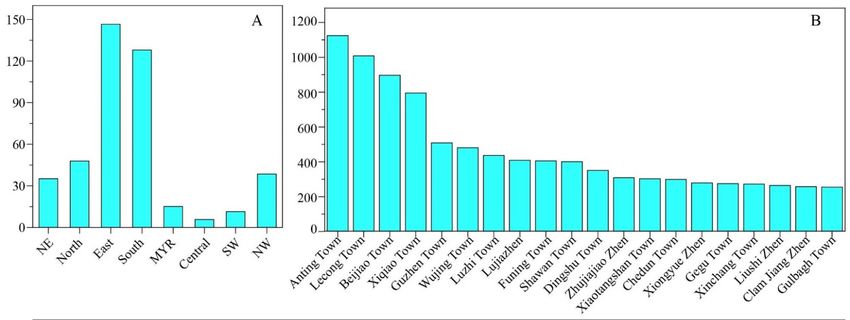
Remote Sens. 2022, 14, 598                                                                                                       7 of 17
Remote Sens. 2022, 14, x FOR PEER REVIEW                                                                                       8 of 19

                                  where MCERI (n) is average CERI of expanding characteristic towns n from 2000 to 2020.
                                 3. Results
                                  CERI    t,t+1 ( n ) is CERI from t year to ( t + 1). For t ∈ [1, 21], y represents the 21 years
                                  (2000–2020)       in this study.
                                 3.1. Spatial Distribution     of Expanding NCTs
                                         For the convenience of subsequent analysis, we classified CEII into five categories (low,
                                         To analyze the spatio‐temporal dynamics of NCTs in China over 21 years, we identi‐
                                  relatively low, moderate, relatively high, and high) using the natural breaks method. This
                                 fied expanding NCTs using nighttime light data from 2000 to 2020. There are 233 expand‐
                                  classification method has the advantage of generating minor variances among categories
                                 ing NCTs, which account for 58.25% of the total of 400 NCTs. Typical characteristics of the
                                  without the influence of artificial factors [51,52]. Meanwhile, we used the natural breaks
                                 spatial agglomeration are mainly distributed in the coastal areas, especially the three ma‐
                                  method to classify CERI into five categories: less than 10%, 10–15%, 15–20%, 20–25%, and
                                 jor urban agglomerations in the eastern zones (Figure 3).
                                  more than 25%.
                                         There are 77 expanding NCTs in the first batch of NCTs, or more specifically 19.25%
                                 (the   first batch of NCTs accounted for 31.5%). In total, 156 expanding NCTs are recognized
                                  3. Results
                                 in
                                  3.1.the   second
                                        Spatial        batch of of
                                                  Distribution  NCTs,   or more
                                                                   Expanding NCTsspecifically 39% (the second batch of NCTs ac‐
                                 counted for 68.5%).
                                         To analyze the spatio-temporal dynamics of NCTs in China over 21 years, we identified
                                         Regarding the types of expanding NCTs, there are 204 continuous expanding NCTs
                                  expanding NCTs using nighttime light data from 2000 to 2020. There are 233 expanding
                                 and 149 frequently expanding NCTs. They are located in the East, South, and North eco‐
                                  NCTs, which account for 58.25% of the total of 400 NCTs. Typical characteristics of the
                                 nomic regions and make up more than 50% of continuously expanding and frequently
                                  spatial agglomeration are mainly distributed in the coastal areas, especially the three major
                                 expanding        NCTs (see details in Table S2 in Supplementary Materials).
                                  urban agglomerations in the eastern zones (Figure 3).

                                 Figure 3.
                                 Figure     Spatialdistribution
                                        3. Spatial distributionof
                                                                ofexpanding
                                                                  expanding NCTs
                                                                            NCTs in
                                                                                 in China.
                                                                                    China.

                                        There
                                       At  the are 77of
                                                level  expanding
                                                         economicNCTs     in the
                                                                    regions,     first batch
                                                                              regional         of NCTs,
                                                                                          differences  inor more
                                                                                                          the      specifically
                                                                                                              spatial           19.25%
                                                                                                                       distribution  of
                                  (the first batch of  NCTs  accounted  for  31.5%).  In total, 156 expanding   NCTs
                                 national expanding NCTs are evident. Expanding NCTs are mainly located in the East    are  recognized
                                  in the
                                 (48),   second
                                       North      batch
                                               (35), andof NCTs,
                                                          South   or more regions
                                                                economic    specifically
                                                                                     (33).39%  (the second
                                                                                           Expanding    NCTsbatch  of NCTs
                                                                                                               in the        accounted
                                                                                                                      SW account    for
                                  for 68.5%).
                                 20.6%, followed by 15.02% in the MYR and 14.16% in the Central region. The economic
                                 regionsRegarding
                                           of NCTsthe aretypes of expanding
                                                          unevenly             NCTs,
                                                                    distributed,  which there  are 204
                                                                                           shows   thatcontinuous   expanding
                                                                                                        the characteristics      NCTs
                                                                                                                             of spatial
                                  and   149  frequently   expanding   NCTs.    They    are  located  in the East,  South,
                                 distribution are more present in the East, and less frequent in the Central and West re‐   and  North
                                  economic regions and make up more than 50% of continuously expanding and frequently
                                 gions. Among the eight economic regions, the proportional expansion of NCTs is the high‐
                                  expanding NCTs (see details in Table S2 in Supplementary Materials).
                                 est in the leading economic regions such as East (88.889%), South (80.488%), and North
                                        At the level of economic regions, regional differences in the spatial distribution of
                                 (76.087%).
                                  national expanding NCTs are evident. Expanding NCTs are mainly located in the East (48),
                                       Table 2 shows that Zhejiang province, Jiangsu province, Guangdong province, Shan‐
                                  North (35), and South economic regions (33). Expanding NCTs in the SW account for 20.6%,
                                 dong province, and Fujian province ranked among the top five. The number of expanding
                                  followed by 15.02% in the MYR and 14.16% in the Central region. The economic regions of
                                 NCTs in provinces is as follows: 20 in Zhejiang province, 20 in Jiangsu province, 18 in
                                  NCTs are unevenly distributed, which shows that the characteristics of spatial distribution
                                 Guangdong province, 15 in Shandong province, and 11 in Fujian province (Table 2). The
                                  are more present in the East, and less frequent in the Central and West regions. Among the
                                 proportion of expanding NCTs (B) is as follows: 8.584% in Jiangsu province, 8.584% in
                                 Zhejiang province, 7.725% in Guangdong province, 6.438% in Shandong province, and
Remote Sens. 2022, 14, 598 8 of 17
eight economic regions, the proportional expansion of NCTs is the highest in the leading
economic regions such as East (88.889%), South (80.488%), and North (76.087%).
Table 2 shows that Zhejiang province, Jiangsu province, Guangdong province, Shan-
dong province, and Fujian province ranked among the top five. The number of expanding
NCTs in provinces is as follows: 20 in Zhejiang province, 20 in Jiangsu province, 18 in
Guangdong province, 15 in Shandong province, and 11 in Fujian province (Table 2). The
proportion of expanding NCTs (B) is as follows: 8.584% in Jiangsu province, 8.584% in
Zhejiang province, 7.725% in Guangdong province, 6.438% in Shandong province, and
4.721% in Fujian province. The spatial distribution of expanding NCTs shows a decreasing
trend from the East and South economic regions to the Central and NW economic regions.
Table 2. Statistics on the expanding NCTs in China.
Economic Number of Proportion of Expanding NCTs
Region Province Expanding
NCTs A (%) B (%)
Jilin 2 6.061 0.858
Liaoning 8 24.242 3.433
NE
Heilongjiang 4 12.121 1.717
Total 14 42.424 6.009
Beijing 7 15.217 3.004
Tianjin 4 8.696 1.717
North Hebei 9 19.565 3.863
Shandong 15 32.609 6.438
Total 35 76.087 15.021
Shanghai 8 14.815 3.433
Jiangsu 20 37.037 8.584
East
Zhejiang 20 37.037 8.584
Total 48 88.889 20.601
Guangdong 18 43.902 7.725
Hainan 4 9.756 1.717
South Fujian 11 26.829 4.721
Total 33 80.488 14.163
Shanxi 10 18.868 4.292
Shaanxi 5 9.434 2.146
MYR Henan 6 11.321 2.575
Inner Mongolia 8 15.094 3.433
Total 29 54.717 12.446
Anhui 9 15.254 3.863
Jiangxi 3 5.085 1.288
Central Hubei 8 13.559 3.433
Hunan 4 6.780 1.717
Total 24 40.678 10.3
Sichuan 8 10.667 3.433
Guangxi 8 10.667 3.433
Yunnan 7 9.333 3.004
SW
Guizhou 4 5.333 1.717
Chongqing 5 6.667 2.146
Total 32 42.667 13.734
Gansu 5 12.821 2.146
Qinghai 3 7.692 1.288
Ningxia 3 7.692 1.288
NW
Xizang 1 2.564 0.429
Xinjiang 6 15.385 2.575
Total 18 46.154 7.725
Note: A represents the proportion of expanding NCTs in the region in relation to the total number of NCTs in the
region, while B represents the proportion of expanding NCTs in the region in relation to the number of expanding
NCTs in China.
3.2. Temporal Changes in the Number of Expanding NCTs
Over time, the number of expanding NCTs changed from 2000 to 2020. The expansion
trend began with 10 expanding NCTs in the period between 2002 and 2005, rising to 32
between 2005 and 2008, followed by a decline to 30 between 2008 and 2011. Later, there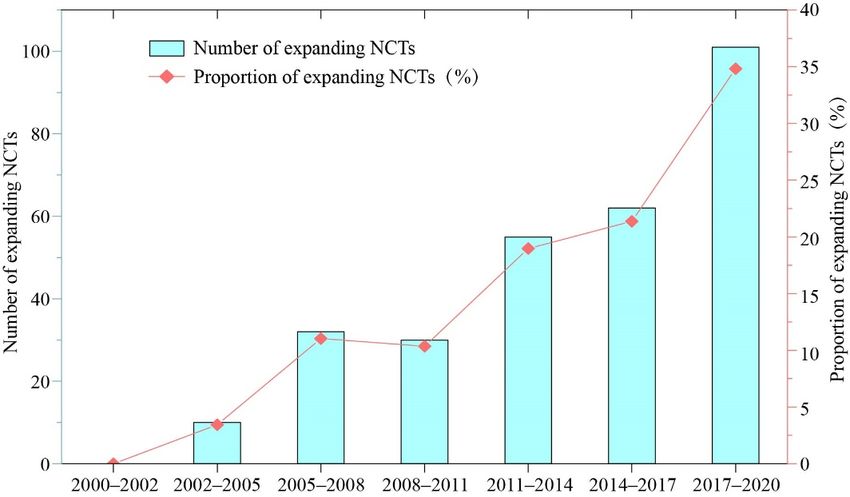
3.2. Temporal Changes in the Number of Expanding NCTs
              Over time, the number of expanding NCTs changed from 2000 to 2020. The expan
     sion trend began with 10 expanding NCTs in the period between 2002 and 2005, rising t
Remote Sens. 2022, 14, 598                                                                                       9 of 17
     32 between 2005 and 2008, followed by a decline to 30 between 2008 and 2011. Later,                                 ther
     was an increase to 55 between 2011 and 2014, followed by a final increase to 101 betwee
     2017 and 2020. In was other    words,
                                an increase    the
                                            to 55    number
                                                  between        of expanding
                                                           2011 and                NCTs
                                                                    2014, followed by a final peaked
                                                                                              increase toduring     two per
                                                                                                          101 between
                           2017 and  2020. In
     ods: 2005–2008 and 2017–2020 (Figure 4). other words, the number of expanding NCTs   peaked   during two  periods:
                            2005–2008 and 2017–2020 (Figure 4).

    Figure 4. Temporal changes     in expanding
                       Figure 4. Temporal            NCTs inNCTs
                                          changes in expanding China.
                                                                 in China.

                                 Figure 4 shows the cyclical change in the increase and decrease in the number of
         Figure 4 shows      the cyclical
                        expanding    NCTs. In the change      in the2002
                                                     period between    increase
                                                                           and 2005,and    decrease
                                                                                      economic            in the
                                                                                                 regions had       number o
                                                                                                             the fastest
                        expansion of NCTs. These are NE, NW, North, and South economic regions, all having
    expanding NCTs. two  In the   period between 2002 and 2005, economic regions had the fastes
                             expanding NCTs. Between 2005 and 2008, the expanding NCTs were primarily con-
    expansion of NCTs.      These
                        centrated     areSouth
                                   in the     NE,(19 NW,     North,
                                                        expanding       and
                                                                    NCTs)   andSouth
                                                                                 East (13economic       regions,
                                                                                          expanding NCTs)           all havin
                                                                                                              economic
                        regions. Later, for the 2008–2011 period, the expanding NCTs were located mainly in the
    two expanding NCTs. Between 2005 and 2008, the expanding NCTs were primarily con
                        South (8 expanding NCTs) and MYR (6 expanding NCTs) economic regions. Compared to
    centrated in the South     (19 expanding
                        the 2005–2008                   NCTs)of and
                                         period, the number             EastNCTs
                                                                   expanding    (13 appears
                                                                                     expandingto haveNCTs)
                                                                                                       declined economic
                                                                                                                rapidly.    re
                        However,
    gions. Later, for the           the number
                            2008–2011               of expanding
                                               period,             NCTs continued
                                                           the expanding         NCTsto grow  in thelocated
                                                                                           were       2011–2014mainly
                                                                                                                period, in th
                        reaching its peak in the 2017–2020 period (Figure 4).
    South (8 expanding NCTs) Figure 5 and
                                       showsMYR          (6 expanding
                                                 that expanding              NCTs)located
                                                                  NCTs are primarily    economic
                                                                                               in threeregions.
                                                                                                        major urbanCompare
                                                                                                                     ag-
    to the 2005–2008 period, the number of expanding NCTs appears to have declined rapidly
                        glomerations,   i.e., in the urban  agglomerations  of the Pearl River Delta, the Yangtze River
                        Delta, and the Beijing–Tianjin–Hebei area. The location of expanding NCTs is highly corre-
    However, the number         of expanding NCTs continued to grow in the 2011–2014 period
                        lated with the development of urban agglomerations. This study presents a development
    reaching its peak in   thelinking
                        model   2017–2020          period (Figure
                                        NCT development        with urban4).
                                                                          agglomerations.
         Figure 5 shows that expanding NCTs are primarily located in three major urban ag
    glomerations, i.e., in the urban agglomerations of the Pearl River Delta, the Yangtze Rive
    Delta, and the Beijing–Tianjin–Hebei area. The location of expanding NCTs is highly cor
    related with the development of urban agglomerations. This study presents a develop
    ment model linking NCT development with urban agglomerations.
Remote Sens.
Remote Sens. 2022,
2022, 14,
14, 598
x FOR PEER REVIEW 11
10 of 19
of 17
Figure 5.
Figure 5. Spatiotemporal
Spatiotemporalchanges
changesinin expanding
expanding NCTs
NCTs in China:
in China: (a) 2002–2005,
(a) 2002–2005, (b) 2005–2008,
(b) 2005–2008, (c)
(c) 2008–
2008–2011, (d) 2011–2014, (e) 2014–2017, (f) 2017–2020. Period from 2000 to 2002 was not mapped
2011, (d) 2011–2014, (e) 2014–2017, (f) 2017–2020. Period from 2000 to 2002 was not mapped because
because there were no expanding NCTs.
there were no expanding NCTs.Remote Sens. 2022, 14, x FOR PEER REVIEW 12 of 19
Remote Sens. 2022, 14, 598 11 of 17
3.3.
3.3. NCT
NCT Expansion
Expansion Intensity
Intensity and
and Ratio
Ratio
NCT
NCT expansion intensity includes low,
expansion intensity includes low, relatively
relatively low,
low, intermediate,
intermediate, relatively
relatively high,
high,
and
and high levels. Among the expanding NCTs in China from 2000 to 2020, the
high levels. Among the expanding NCTs in China from 2000 to 2020, expansion
the expansion
intensity was predominantly
intensity was predominantlyconcentrated
concentratedatatlow lowlevels.
levels.TheThenumber
numberofofNCTs
NCTs with
with differ‐
different
ent types of expansion intensity (CEII) is as follows: low (314), relatively
types of expansion intensity (CEII) is as follows: low (314), relatively low (44), intermediate low (44), inter‐
mediate (30), relatively high (7), and high (5), which accounts for 78.5%,
(30), relatively high (7), and high (5), which accounts for 78.5%, 11%, 7.5%, 1.75%, and 11%, 7.5%, 1.75%,
and
1.25% 1.25%
of allofNCTs,
all NCTs, respectively.
respectively.
The
The number
numberofofNCTs NCTswithwithdifferent
different types
typesof of
expansion
expansion ratio (CERI)
ratio is asisfollows:
(CERI) less
as follows:
than 10% (345), 10–15% (30), 15–20% (15), 20–25% (8), and more
less than 10% (345), 10–15% (30), 15–20% (15), 20–25% (8), and more than 25% (2), which than 25% (2), which ac‐
counts for 86.25%, 7.5%, 3.75%, 2%, 0.5% of the total number of NCTs,
accounts for 86.25%, 7.5%, 3.75%, 2%, 0.5% of the total number of NCTs, respectively. The respectively. The
expansion
expansion intensity
intensity ofof NCTs
NCTs is mostly at
is mostly at aa low
low level,
level, with
with anan NCT
NCT expansion
expansion ratio
ratio of
of less
less
than 10%.
NCTs with high expansion intensity and high expansion ratio are mainly located in
the South, East, and North economic regions, which have significantly higher expansion
intensity and
andratio
ratiocompared
comparedtoto other
other economic
economic regions
regions in China.
in China. The The characteristics
characteristics of NCT of
NCT expansion are mainly in line with the distribution of the three
expansion are mainly in line with the distribution of the three major urban agglomerations major urban agglom‐
erations in the
in the east. Theeast.
NCT The NCT expansion
expansion intensity intensity
shows ashowshigh adegree
high degree of agglomeration
of agglomeration in the
in the eastern
eastern regions.regions. Furthermore,
Furthermore, the NCT
the NCT expansion
expansion intensity
intensity in the
in the central
central andand west‐
western
regions
ern is relatively
regions high,
is relatively while
high, the expansion
while the expansion ratioratio
is generally low low
is generally (Figure 6). 6).
(Figure
Figure
Figure 6.
6. NCT
NCTexpansion
expansionintensity and
intensity expansion
and ratio
expansion in China:
ratio (a) CEII‐based
in China: distribution
(a) CEII-based by eco‐
distribution by
nomic regions; (b) CERI‐based distribution by economic regions.
economic regions; (b) CERI-based distribution by economic regions.
NCTs
NCTs inin the
the East
East economic
economic regions
regions have
have the
the highest
highest average
average expansion
expansion intensity
intensity
(146.568),
(146.568), followed by the South regions (127.921). In addition, CEII in the North, NW,NW,
followed by the South regions (127.921). In addition, CEII in the North, and
and NE economic
NE economic regions
regions is 47.835,
is 47.835, 38.529,
38.529, and 35.111,
and 35.111, respectively.
respectively. CEII
CEII in theinMYR
the MYR eco‐
economic
nomic
regionsregions
is only is onlywhich
5.696, 5.696, iswhich is less
less than 4%than 4%East
of the of the East economic
economic regions7A).
regions (Figure (Figure
For
7A). For the
the level level of characteristic
of characteristic towns, thetowns, the NCT expansion
NCT expansion intensity (accumulative
intensity (accumulative annual CEII) an‐
is
nual CEII) Anting
as follows: is as follows:
(1122.78), Anting
Lecong (1122.78), Lecong
(1006.198), Beijiao(1006.198), Beijiao (792.922),
(894.974), Xiqiao (894.974),Guzhen
Xiqiao
(792.922), Guzhen
(506.29), Wujing (506.29),Luzhi
(478.842), Wujing (478.842),
(434.942), LujiaLuzhi (434.942),
(407.269), FuningLujia (407.269),
(403.567), Funing
and Shawan
(403.567),
(399.116). and Shawan (399.116).
Additionally, it is worthAdditionally,
noting that outit isof
worth
all ofnoting
the topthat out of all
10 towns, of Funing
only the top
10 towns, onlyisFuning
(Heilongjiang) in the NE (Heilongjiang) is in the
economic region. Other NENCTs
economic region.
are mainly Other NCTs
concentrated in are
the
South and
mainly North economic
concentrated regions
in the South (Figure
and North7B).
economic regions (Figure 7B).Remote
Remote Sens. 2022, 14,
Sens. 2022, 14, 598
x FOR PEER REVIEW 1312of
of 19
17
Figure 7. CEII in China and its economic regions: (A) average CEII in economic region, (B) accumu‐
Figure 7. CEII in China and its economic regions: (A) average CEII in economic region, (B) accumula-
lative annual CEII in characteristic towns, and (C) average CEII in provinces.
tive annual CEII in characteristic towns, and (C) average CEII in provinces.
As
As shown
shown in in Figure
Figure 7C,7C, the NCTs in
the NCTs in Shanghai
Shanghai havehave thethe highest
highest average
average expansion
expansion
intensity 347.775. The next is the NCT expansion intensity in Guangdong
intensity 347.775. The next is the NCT expansion intensity in Guangdong province with province with
219.279.
219.279. The Jiangsu province, Tianjin, Beijing, Zhejiang province, Xinjiang, Ningxia, and
The Jiangsu province, Tianjin, Beijing, Zhejiang province, Xinjiang, Ningxia, and
Fujian
Fujian provinces
provinces exceed
exceed the
the national
national average
average level
level of
of 49.219.
49.219. It
It should
should be be noted
noted that
that from
from
the point of
the point of the
theaverage
averageexpansion
expansionintensity
intensityofof NCTs,
NCTs, Xinjiang
Xinjiang andand Ningxia
Ningxia rankrank in the
in the top
top 10, ahead of other provinces. In addition, the expansion of NCTs
10, ahead of other provinces. In addition, the expansion of NCTs in Liaoning province andin Liaoning province
and Heilongjiang
Heilongjiang province
province was notable
was notable betweenbetween 20002020,
2000 and and 2020,
with an with an average
average CEII
CEII value
value exceeding
exceeding 45. 45.
To further analyze
To further analyze thethe expansion
expansioncharacteristics
characteristicsof ofNCTs,
NCTs,we weadopted
adoptedthe theannual
annualaver-
av‐
erage
age ofof
thethe expansion
expansion intensity
intensity of of characteristic
characteristic towns
towns to to identify
identify critical
critical expansion
expansion peri‐
periods
ods in eight
in eight economiceconomic
zones. zones.
The annual The average
annual CEII average CEII is 19,411.779
is 19,411.779 and peakedand peaked
(27,560.018)
(27,560.018) during the period from 2011 to 2014. CEII increase was
during the period from 2011 to 2014. CEII increase was primarily concentrated in two time primarily concen‐
trated
periodsin(2008–2011
two time periods (2008–2011
and 2011–2014). Theand 2011–2014).
NCTs expansion The NCTs expansion
intensity intensity
was significantly was
higher
significantly
than the averagehigher than
level the average
(Figure 8). level (Figure 8).
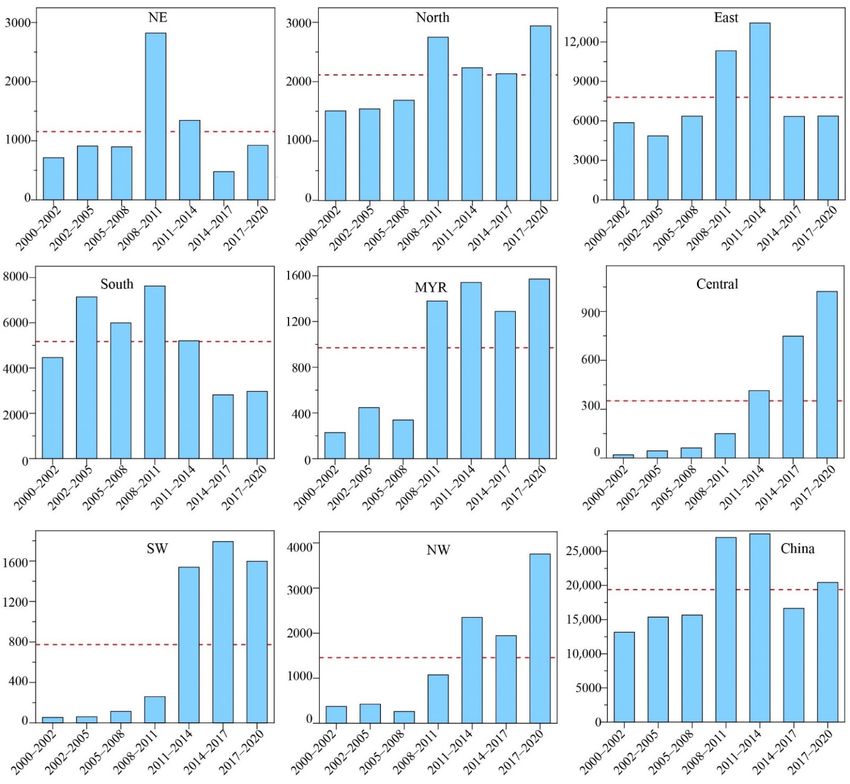
For economic regions, the time of distribution of the NCT expansion intensity is
different among the eight economic regions. The expansion intensity of NCTs in the NE
economic regions was mainly concentrated in the period 2008–2011 (2820.825) and was
significantly higher than the national average. Consequently, the expansion intensity in the
NE economic regions was significantly lower (1155.488) than the national average duringRemote Sens. 2022, 14, 598 13 of 17
Remote Sens. 2022, 14, x FOR PEER REVIEW
other periods. The NCT expansion intensity in the North was primarily identified14in of 19
two
periods, i.e., between 2008 and 2011 (2753.062) and between 2017 and 2020 (2944.962).
Figure 8.
Figure 8. Temporal changes in
Temporal changes in CEII
CEII in
in China
China and
and its
its economic
economic regions.
regions.
For economic
The intensity ofregions, the time ofindistribution
NCT expansion of the NCT
the East economic expansion
regions intensityhigher
is significantly is dif‐
ferentthe
than among the average
national eight economic regions.
and is mainly The expansion
concentrated intensity
in the period of NCTs in (13,447.379).
2011–2014 the NE eco‐
nomic
In regions
the East was mainly
economic concentrated
regions, in the period
the NCT expansion 2008–2011
intensity in any(2820.825) and was
other period was also
sig‐
nificantly higher
significantly than
higher thethe
than national
nationalaverage.
average, Consequently,
and the NCT the expansion
expansions wereintensity
evident.inThe
the
NE economic regions was significantly lower (1155.488) than the national
intensity of NCT expansion in the South economic regions was primarily concentrated average during
other periods.
between 2002 The
and NCT
2005 expansion intensity
(7145.08) and betweenin the North
2008 andwas2011primarily
(7624.593).identified
Duringinthese
two
periods, the
periods, i.e.,expansion
between 2008 and 2011
intensity (2753.062) and
was significantly between
higher than2017 and 2020
the national (2944.962).
average in other
The In
periods. intensity
the MYR of economic
NCT expansion
regions,inthe
theNCT
East expansion
economic regions
intensity is was
significantly higher
concentrated in
thantime
two the national
periods,average and is
the period mainly concentrated
2011–2014 (1541.372) andin the
theperiod
period2011–2014
2017–2020 (13,447.379).
(1571.826).
The NCT
In the Eastexpansion
economicintensity
regions,during
the NCT theexpansion
entire research cycleinwas
intensity anysignificantly
other period lower
was than
also
the national average. In addition, compared to the other seven economic
significantly higher than the national average, and the NCT expansions were evident. The regions, the NCT
expansion
intensity ofintensity in the Central
NCT expansion in the economic regionsregions
South economic was significantly
was primarily lower. Moreover,
concentrated
between 2002 and 2005 (7145.08) and between 2008 and 2011 (7624.593). During these pe‐
riods, the expansion intensity was significantly higher than the national average in other
periods. In the MYR economic regions, the NCT expansion intensity was concentrated inRemote Sens. 2022, 14, 598 14 of 17
the expansion intensity was primarily concentrated in the period between 2017 and 2020
(1022.244) and was at the level of the national average.
The NCT expansion intensity in the SW economic regions was concentrated in the
period 2014–2017 (1792.125). The expansion intensity is significantly lower than the national
average. Furthermore, the NCT expansion intensity in the NW economic regions was
largely concentrated in periods 2011–2014 (2347.784) and 2017–2020 (3754.511). In addition,
it should be noted that the NCT expansion intensity was significantly higher than the
national average, while the expansion intensity in other periods was significantly lower
than the national average.
Since 2016, China has been implementing the NCT policies at the national level. The
most obvious areas of NCT expansion intensity are the North, MYR, Central, SW, and
NW economic regions in the period 2017–2020. Compared to the eastern region, the
implementation of NCT policy has significantly promoted the development of NCTs in the
central and western regions.
4. Discussion
4.1. Are Characteristic Towns Expanding?
Characteristic towns are a new type of industrial organization in social and eco-nomic
development, which plays a vital role in optimization of industrial structure, distribution of
productive forces, allocation of spatial resources, and promotion of supply-side structural
reforms [53,54]. Based on the critical role of characteristic towns in promoting urbanization,
improving the rural living environment, and promoting regional innovation and devel-
opment, some scholars advocate promoting characteristic towns [17,26]. The expansion
of characteristic towns reflects the regional factor mobility and the changing patterns of
urbanization. It is not necessary to promote the development of all characteristic towns,
but characteristic towns with excellent growth potential and high quality of development.
Therefore, it is crucial to identify the characteristic towns that are expanding.
At present, research on characteristic towns is mainly focused on spatial distribution
characteristics [26,55]. Current research generally believes that NCTs are developing rapidly.
However, previous research has failed to use reliable data and methods to reflect the status
of NCT development [15,25,27,54].
The innovation of this paper is the discovery of spatial and temporal characteristics
of the expanding characteristic towns during different periods with the application of
nighttime light data. The expansion of characteristic towns may intensify the trend of
internal differentiation of characteristic towns, and location and policy will also change the
expansion trajectory of the characteristic towns. NCT expansion is common in China, but
also shows regional or temporal disparities. More than half of the NCTs have expanded
in China. The number of expanding NCTs peaked in two periods. The first period was
between 2005 and 2008 and the second period was between 2017 and 2020. NCT expansion
intensity and expansion ratio predominantly occurred in the East, South, and North eco-
nomic regions. The above research findings can provide a reference for decision makers to
implement advanced planning in response to the differentiated development of NCTs.
4.2. Advantages of Identifying Expanding NCTs Using Nighttime Light Data
There has always been an objective problem in the research of characteristic towns; that
is, the imperfect township statistics lead to a lack of data, which hinders the quantitative
research [35]. Using nighttime light data can provide a large amount of information that is
difficult to obtain by traditional methods, which compensates for the difficulties brought
by the lack of data for the study of characteristic towns.
This study proposes a method for identifying expanding NCTs in China using night-
time light data from 2000 to 2020. The results show that nighttime light data have significant
advantages in identifying expanding NCTs. The scientific method proposed in this study
can effectively identify the ‘hot spots’ of expanding NCTs and the critical periods of their
expansion. NCTs are still a relatively new phenomenon, and most are still being created orRemote Sens. 2022, 14, 598 15 of 17
developed in China. In this study, expanding NCTs and non-expanding NCTs were suc-
cessfully classified during the investigated period, which is the most significant difference
compared to other studies.
The method in this study was also used to evaluate NCT policy before and after its
implementation. The results show that the implementation of the NCT policy has promoted
the rapid development of characteristic towns in the central and western regions. Therefore,
the used method has significant advantages in identifying expanding NCTs in China.
4.3. Limitations and Future Work
It should be noted that there are still several aspects that were not addressed in this
study. First, although nighttime light data can better represent the development charac-
teristics of NCTs, the development of these towns is not manifested solely through spatial
expansion, but also in economic aspects of development. As nighttime light data are
unlikely to reflect these characteristics, it may be necessary to include statistical data in
future studies. Furthermore, there are obvious differences between the NCT regional devel-
opments and the influencing factors. The differentiation of the NCT regional development
differences have not been studied and further research is needed. Third, this paper aimed to
reveal the development process of NCTs, but there is no quantitative contribution of NCTs
to regional development. This paper failed to quantify the impact of NCT development
on the region. Future research should use econometric models to describe NCTs and their
locations, population, and policies. The relationship between the aforementioned factors is
crucial to a better understanding of the development of NCTs in China.
5. Conclusions
NCTs are typical representatives of small towns in China. This study proposes a
method for identifying expanding NCTs in China according to nighttime light data from
2000 to 2020. The accuracy of the identification of expanding NCTs was verified, and the
results show that the NCT expansion is a common phenomenon in China, but there are
regional or temporal differences. More than half of the NCTs have expanded in China. The
expanding NCTs are mainly located in the East, South, and North economic regions. The
number of expanding NCTs peaked in two periods. The first period was between 2005
and 2008 and the second period was between 2017 and 2020. NCT expansion intensity and
expansion ratio occurred predominantly in the East, South, and North economic regions.
NCTs are highly consistent with the spatial distribution of cities, and the development
of NCTs is inherently related to the development of urban agglomerations in the region.
The implementation of the NCT policy has promoted the rapid development of the NCTs in
central and western regions. Thus, policies should focus on the development of expanding
NCTs in the eastern urban agglomerations and the development of non-expanding NCTs
in the central and western regions.
In this study, the proposed method is practical and accurate for the identification of the
expanding NCTs using nighttime light data. This method can effectively identify the ‘hot
spots’ of expanding NCTs and the critical expansion periods. The results from this method
can help to optimize the spatial layout of characteristic towns and guide the adjustment of
NCT policies in China.
Supplementary Materials: The following are available online at https://www.mdpi.com/article/
10.3390/rs14030598/s1, Table S1: Comparison of primary data of NCTs and small towns in 2016,
Table S2. Types of expanding NCTs
Author Contributions: H.S. designed the research and wrote the manuscript. T.H. performed the
experiment and analyzed evaluation results. All authors have read and agreed to the published
version of the manuscript.
Funding: This work was supported by the National Natural Science Foundation of China (72004197).
Institutional Review Board Statement: Not applicable.Remote Sens. 2022, 14, 598 16 of 17
Informed Consent Statement: Not applicable.
Data Availability Statement: Not applicable.
Conflicts of Interest: The authors declare that they have no known competing financial interests or
personal relationships that could have appeared to influence the work reported in this paper.
References
1. Yin, X.; Wang, J.; Li, Y.; Feng, Z.; Wang, Q. Are small towns really inefficient? A data envelopment analysis of sampled towns in
Jiangsu province, China. Land Use Policy 2021, 109, 105590. [CrossRef]
2. Feng, Y.; Wang, R.; Tong, X.; Shafizadeh-Moghadam, H. How much can temporally stationary factors explain cellular automata-
based simulations of past and future urban growth? Comput. Environ. Urban Syst. 2019, 76, 150–162. [CrossRef]
3. Seto, K.C.; Sanchez-Rodriguez, R.; Fragkias, M. The new geography of contemporary urbanization and the environment. Annu.
Rev. Environ. Resour. 2010, 35, 167–194. [CrossRef]
4. Torbick, N.; Corbiere, M. Mapping urban sprawl and impervious surfaces in the northeast United States for the past four decades.
GIScience Remote Sens. 2015, 52, 746–764. [CrossRef]
5. Binns, T.; Nel, E. The village in a game park: Local response to the demise of coal mining in KwaZulu-Natal, South Africa. Econ.
Geogr. 2003, 79, 41–66. [CrossRef]
6. Malý, J. Small towns in the context of “borrowed size” and “agglomeration shadow” debates: The case of the south moravian
region (Czech republic). Eur. Ctry. 2016, 8, 333–350. [CrossRef]
7. Filipovi´c, M.; Kokotovi´c, K.; Drobnjakovi´c, M. Small towns in serbia-The “bridge” between the urban and the rural. Eur. Ctry.
2016, 8, 462–480.
8. Broadway, M. Implementing the slow life in southwest Ireland: A case study of Clonakilty and local food. Geogr. Rev. 2015, 105,
216–234. [CrossRef]
9. Mayer, H.; Knox, P. Small-town sustainability: Prospect in the second modernity. Eur. Plan. Stud. 2010, 18, 1545–1565. [CrossRef]
10. Wirth, P.; Elis, V.; Müller, B.; Yamamoto, K. Peripheralisation of small towns in Germany and Japan-Dealing with economic
decline and population loss. J. Rural Stud. 2016, 47, 62–75. [CrossRef]
11. Wu, Y. The controversy and definition of the concept of small towns in China. Dev. Small Cities Towns 2014, 32, 50–55.
12. Tong, Y.; Liu, W.; Li, C.; Zhang, J.; Ma, Z. Understanding patterns and multilevel influencing factors of small town shrinkage in
Northeast China. Sustain. Cities Soc. 2021, 68, 102811. [CrossRef]
13. Kühn, M. Small towns in peripheral regions of Germany. Ann. Univ. Paedagog. Crac. Studia Geogr. 2015, 8, 29–38.
14. Nel, E.; Connelly, S.; Stevenson, T. New Zealand’s small town transition: The experience of demographic and economic change
and place based responses. N. Z. Geog. 2019, 75, 163–176. [CrossRef]
15. Miao, J.T.; Phelps, N.A. ‘Featured town’ fever: The anatomy of a concept and its elevation to national policy in China. Habitat Int.
2019, 87, 44–53. [CrossRef]
16. Wu, Y.; Chen, Y.; Deng, X.; Hui, E. Development of characteristic towns in China. Habitat Int. 2018, 77, 21–31. [CrossRef]
17. Wang, D.W.; Li, Y. Typical problems of characteristic town development and sustainable promotion strategies. Econ. Rev. J. 2019,
8, 69–75.
18. Li, Y.F.; Ma, H.D. Cold Thinking in the Construction of characteristic town: Cultural absorption and inheritance in the construction
of characteristic town. Gov. Res. 2018, 3, 113–121.
19. Fu, X.D.; Fu, J.S. The Theory Origin and Enlightenment of Leading Industrial Embeddedness. Reg. Econ. Rev. 2017, 33, 26–32.
20. Sheng, S.H.; Zhang, W.M. Characteristic town: A form of industrial spatial organization. Zhejiang Soc. Sci. 2016, 19, 36–38.
21. Yao, S.J. Governance Confluence in the Integration of Urban and Rural Areas: Policy Issues Based on "characteristic towns". Soc.
Sci. Res. 2017, 39, 45–50.
22. Zeng, J.; Ci, F. The construction of characteristic towns under the background of new urbanization. Macroecon. Manag. 2016, 12,
51–56.
23. Zhang, J.F. The path and model of characteristic town construction: Taking Datong City, Shanxi Province as an example. China
Agric. Resour. Reg. Plan. 2017, 38, 145–151.
24. Zhou, X.H. Industry Transformation and Cultural Reconstruction: The Path of Creating characteristic towns. Nanjing Soc. Sci.
2017, 28, 12–19.
25. Xie, H.; Li, Y.H.; Wei, Y.Y. Study on the spatial structure characteristics and influencing factors of characteristic towns in Zhejiang
Province. Sci. Geogr. Sin. 2018, 38, 1283–1291.
26. Fang, Y.L.; Huang, Z.F.; Li, J.L.; Wang, F. The spatial distribution and industrial characteristics of Chinese characteristic towns.
J. Nat. Resour. 2019, 34, 1273–1284.
27. Ma, R.F.; Zhou, X.J.; Li, Q. The regional types of characteristic towns in the Yangtze River Delta and their adaptive construction
paths. J. Geogr. 2019, 39, 912–919.
28. Zou, Y.; Zhao, W. Searching for a new dynamic of industrialization and urbanization: Anatomy of China’s characteristic town
program. Urban Geogr. 2018, 39, 1060–1069. [CrossRef]
29. Liu, T. Characteristic town: New exploration in the process of Zhejiang’s new urbanization. Zhejiang Econ. 2017, 9, 8–10.You can also read