Unexpected enhancement of ozone exposure and health risks during National Day in China
←
→
Page content transcription
If your browser does not render page correctly, please read the page content below

Atmos. Chem. Phys., 21, 10347–10356, 2021
https://doi.org/10.5194/acp-21-10347-2021
© Author(s) 2021. This work is distributed under
the Creative Commons Attribution 4.0 License.

Unexpected enhancement of ozone exposure and health risks during
National Day in China
Peng Wang1,2 , Juanyong Shen3 , Men Xia2 , Shida Sun4 , Yanli Zhang1 , Hongliang Zhang5,6 , and Xinming Wang1
1 State Key Laboratory of Organic Geochemistry and Guangdong Key Laboratory of Environmental Protection and Resources
Utilization, Guangzhou Institute of Geochemistry, Chinese Academy of Sciences, Guangzhou, China
2 Department of Civil and Environmental Engineering, The Hong Kong Polytechnic University, Hong Kong SAR, China
3 School of Environmental Science and Engineering, Shanghai Jiao Tong University, Shanghai, China
4 Tianjin Key Laboratory of Urban Transport Emission Research, College of Environmental Science and Engineering,

Nankai University, Tianjin, China
5 Department of Environmental Science and Engineering, Fudan University, Shanghai, China
6 Institute of Eco-Chongming (IEC), Shanghai, China

Correspondence: Yanli Zhang (zhang_yl86@gig.ac.cn)

Received: 21 December 2020 – Discussion started: 2 February 2021
Revised: 9 May 2021 – Accepted: 9 June 2021 – Published: 8 July 2021

Abstract. China is confronting increasing ozone (O3 ) pollu-       Delta (PRD) in recent years, with continuously increasing
tion that worsens air quality and public health. Extreme O3        maximum daily 8 h average (MDA8) O3 levels (Fang et al.,
pollution occurs more frequently under special events and          2019; Li et al., 2019; Lu et al., 2018; H. Liu et al., 2018). Ex-
unfavorable meteorological conditions. Here we observed            acerbated O3 pollution aggravates health risks from a series
significantly elevated maximum daily 8 h average (MDA8)            of illnesses such as cardiovascular disease (CVD), respira-
O3 (up to 98 ppb) during the Chinese National Day holiday          tory disease (RD), hypertension, stroke, and chronic obstruc-
(CNDH) in 2018 throughout China, with a prominent rise by          tive pulmonary disease (COPD) (H. Liu et al., 2018; Li et al.,
up to 120 % compared to the previous week. The air qual-           2015; Brauer et al., 2016; Lelieveld et al., 2013; P. Wang et
ity model shows that increased precursor emissions and re-         al., 2020). In China, the annual COPD mortality due to O3
gional transport are major contributors to the elevation. In the   reached up to 8.03 × 10⁴ in 2015 (H. Liu et al., 2018).
Pearl River Delta region, the regional transport contributed          O3 is generated by nonlinear photochemical reactions of
up to 30 ppb O3 during the CNDH. Simultaneously, aggra-            its precursors involving volatile organic compounds (VOCs)
vated health risk occurs due to high O3 , inducing 33 % ad-        and nitrogen oxides (NOx ) (Sillman, 1995; T. Wang et al.,
ditional deaths throughout China. Moreover, in tourist cities      2017). The VOC / NOx ratio determines O3 sensitivity that
such as Sanya, daily mortality even increases significantly        is classified as VOC-limited, transition, and NOx -limited,
from 0.4 to 1.6. This is the first comprehensive study to in-      which controls O3 formation (Sillman, 1995; Sillman and
vestigate O3 pollution during the CNDH at the national level,      He, 2002; Cohan et al., 2005). Also, regional transport was
aiming to arouse more focus on the O3 holiday impact of the        reported as an important source of high O3 in China (Gao
public.                                                            et al., 2016; P. Wang et al., 2020; Li et al., 2012a). For in-
                                                                   stance, Li et al. (2012b) showed that over 50 % of surface O3
                                                                   was contributed from regional transport in the PRD during
                                                                   high-O3 episodes.
1   Introduction                                                      O3 concentration shows different patterns between holi-
                                                                   days and workdays (Pudasainee et al., 2010; Xu et al., 2017).
Tropospheric ozone (O3 ) has become a major air pollutant          Elevated O3 has been observed during holidays in different
in China, especially in urban areas such as the North China        regions, resulting from changes in precursor emissions re-
Plain (NCP), Yangtze River Delta (YRD), and Pearl River

Published by Copernicus Publications on behalf of the European Geosciences Union.
10348                                                             P. Wang et al.: Unexpected enhancement of ozone exposure

lated to intensive anthropogenic activities (Tan et al., 2009;      limited control, and O3 _VOC stands for the O3 formation be-
Chen et al., 2019; Tan et al., 2013; Levy, 2013). In China,         ing under VOC-limited control. The details of the 3R scheme
most studies focus on the Chinese New Year (CNY) to inves-          and the calculation of O3 _NOx and O3 _VOC are described
tigate the long-term holiday effect on O3 in southern areas         in Wang et al. (2019a). A domain with a horizontal resolu-
(Chen et al., 2019). However, the Chinese National Day hol-         tion of 36×36 km2 was applied in this study, covering China
iday (CNDH), a nationwide 7 d festival, is less studied. Xu et      and its surrounding areas (Supplement Fig. S1). The Weather
al. (2017) reported that the O3 production was influenced by        Research and Forecasting (WRF) model version 3.9.1 was
enhanced VOCs during the CNDH in the YRD based on in                used to generate the meteorological inputs, and the initial
situ observations. Previous studies mainly paid attention to        and boundary conditions were based on the FNL reanaly-
developed regions/cities without nationwide consideration.          sis data from the National Centers for Environmental Predic-
In addition, the national O3 -attributable health impact during     tion (NCEP). The anthropogenic emissions in China are from
the CNDH is also unclear. Consequently, a comprehensive             the Multiresolution Emission Inventory for China (MEIC;
study on O3 during the CNDH is urgently needed in China.            http://www.meicmodel.org/, last access: 1 July 2021) version
   In this study, we used observation data and a source-            1.3 that lumped emissions into five sectors: agriculture, in-
oriented version of the Community Multiscale Air Quality            dustries, residential, power plants, and transportation. The
(CMAQ) model (Wang et al., 2019b) to investigate O3 char-           annual MEIC emission inventory was applied in this study,
acteristics during the CNDH in 2018 in China. Daily prema-          and the monthly profile of the anthropogenic emissions was
ture death mortality was evaluated to determine health im-          based on Zhang et al. (2007) and Streets et al. (2003), as
pacts attributed to O3 as well. We find a rapid increase by         shown in Table S1, to represent the emissions changes be-
up to 120 % of the observational MDA8 O3 from previous              tween September and October. Higher emissions rates were
periods to CNDH throughout China, which is attributed to            found during October from the residential and industrial sec-
increased precursors and regional transport. This study pro-        tors, while the levels from transportation and power sectors
vides an in-depth investigation of elevated O3 and its adverse      stayed the same. Emissions from other countries were from
health impacts during the CNDH, which has important im-             the MIX Asian emission inventory (Li et al., 2017). Open
plications for developing effective control policies in China.      burning emissions were from the Fire INventory from NCAR
                                                                    (FINN) (Wiedinmyer et al., 2011), and biogenic emissions
                                                                    were generated using the Model of Emissions of Gases and
2     Methods                                                       Aerosols from Nature version 2.1 (MEGAN2.1) (Guenther
                                                                    et al., 2012). The integrated process rate (IPR) in the process
2.1    The CMAQ model setup and validation
                                                                    analysis (PA) tool in the CMAQ model was applied to quan-
The CMAQ model with three-regime (3R) approach, which               tify the contributions of atmospheric processes to O3 (Gip-
attributed O3 to NOx and VOCs based on the NOx –VOC–O3              son, 1999) (for details, see Table S2 in the Supplement). In
sensitivity regime, was applied to study O3 during the CNDH         the CMAQ model, the IPR and integrated reaction rate anal-
in China in 2018. The regime indicator R was calculated us-         ysis (IRR) were all defined as the PA. PA aims to provide
ing Eq. (1):                                                        quantitative information on the process of the chemical re-
                                                                    actions and other atmospheric processes that are being sim-
       PH2 O2 + PROOH                                               ulated, illustrating how the CMAQ model calculated its pre-
R=                    ,                                    (1)      dictions. The IPR was used to determine the relative con-
            PHNO3
                                                                    tributions of individual atmospheric physical and chemical
where PH2 O2 is the formation rate of hydrogen peroxide             processes in the CMAQ model.
(H2 O2 ), PROOH is the formation rate of organic peroxide              The simulation period was from 24 September to 31 Oc-
(ROOH), and PHNO3 is the formation rate of nitric acid              tober 2018 and was divided into three intervals: PRE-CNDH
(HNO3 ) in each chemistry time step. The threshold val-             (24–30 September), CNDH (1–7 October), and AFT-CNDH
ues for the transition regime are 0.047 (Rts , change from          (8–31 October). In this study, a total of 43 cities, including
VOC-limited to transition regime) and 5.142 (Rte , change           both megacities (such as Beijing and Shanghai) and popu-
from transition regime to NOx -limited regime) in this study        lar tourist cities (such as Sanya), were selected to investigate
(Wang et al., 2019a). The formed O3 is entirely attributed          the O3 issue during the CNDH in 2018 in China (Table S3).
to NOx or VOC sources, when R values are located in a               Locations of these cities cover developed (such as the YRD
NOx -limited (R > Rte ) or VOC-limited (R < Rts ) regime. In        region) and also suburban/rural regions (such as Urumqi and
contrast, when R values are in the transition regime (Rts ≤         Lhasa in western China), which provides a comprehensive
R ≤ Rte ), the formed O3 is attributed to both NOx and              perspective for this study (Fig. S1).
VOC sources. Two non-reactive O3 species, O3 _NOx and                  All the statistical results of the WRF model satisfy the
O3 _VOC, are added to the CMAQ model to quantify the                benchmarks (Emery et al., 2001), except for the gross er-
O3 attributable to NOx and VOCs, respectively. In particu-          ror (GE) of temperature at 2 m height (T 2) and wind speed
lar, O3 _NOx stands for the O3 formation being under NOx -          (WD), which went beyond the benchmark by 25 % and 46 %,

Atmos. Chem. Phys., 21, 10347–10356, 2021                                           https://doi.org/10.5194/acp-21-10347-2021
P. Wang et al.: Unexpected enhancement of ozone exposure                                                                    10349

respectively (Table S4). The WRF model performance is              whole of October (Fig. 1c). Other regions exhibit less MDA8
similar to previous studies (Zhang et al., 2012; Hu et al.,        O3 increase, which is 20 %, 16 %, and 3 % for East, North,
2016) that could provide robust meteorological inputs to           and West China, respectively (Fig. 1b). Negligible MDA8
the CMAQ model. The observation data of key pollutants             O3 increase in West China is consistent with vast rural ar-
obtained from the national air quality monitoring network          eas and less anthropogenic impact (J. Wang et al., 2017).
(https://quotsoft.net/air/, last access: 5 August 2020; more       This result suggests that changes in anthropogenic emissions
than 1500 sites) were used to validate the CMAQ model              have significant impacts on MDA8 O3 during the CNDH in
performance. The model performance of O3 was within the            South, East, and North China, similar to a previous observa-
criteria (US EPA, 2005), with a slight underestimation com-        tion study (Xu et al., 2017).
pared to observations, demonstrating our simulation is suit-          Nine key cities are then selected for analyzing the causes
able for use in O3 study in China (Table S5).                      and impacts of the significant MDA8 O3 rises. Comprehen-
                                                                   sive criteria were adopted in selection according to (1) acute
2.2    Health impact estimation                                    MDA8 O3 increases (e.g., Changsha and Shenzhen) and (2)
                                                                   important provincial capitals (e.g., Beijing and Shanghai)
Daily premature mortalities due to O3 from all non-                and famous tourist cities (e.g., Sanya). The selected key cities
accidental causes, CVD, RD, hypertension, stroke, and              are representative of the situation of broad regions in China
COPD are estimated in this study. The O3 -related daily mor-       except for West China (Fig. S1), which has an insignificant
tality is calculated based on Anenberg et al. (2010) and Co-       MDA8 O3 increase (Table S3) and fewer tourist cities. The
hen et al. (2004). In this study, the population data are from     MDA8 O3 increased by 48 ± 37 % during the 2018 CNDH
all age groups, which may induce higher daily mortality than       in these key cities. The highest MDA8 O3 is observed in
expected (H. Liu et al., 2018). In this study, the daily prema-    Zhuhai, reaching 98 ppb on average, with a peak of 107 ppb.
ture mortality due to O3 is calculated from Eq. (2) (Anenberg      The MDA8 O3 in Sanya increases 2-fold compared to PRE-
et al., 2010; Cohen et al., 2004):                                 CNDH, which is unexpected because there is less focus on
                                                                 air pollution in Sanya, and it is known for less anthropogenic
1M = y0 1 − exp (−β1X) Pop,                                 (2)    emissions (Wang et al., 2015). Other key cities show 8 %–
                                                                   70 % increases during the CNDH. The exact causes of sub-
where 1M is the daily premature mortality due to O3 ;
                                                                   stantial O3 increases in these cities are of high interest and
y0 is the daily baseline mortality rate, collected from the
                                                                   are explored below.
China Health Statistical Yearbook 2018 (National Health
and Family Planning Commission of China, 2018); β is the
                                                                   3.2   Increased O3 precursor emissions during the
concentration–response function (CRF), which represents
                                                                         CNDH
the increase in daily mortality with each 10 µg m−3 increase
of MDA8 O3 concentration, cited from Yin et al. (2017); 1X
                                                                   CMAQ is capable of representing the changes in observed
is the incremental concentration of O3 based on the thresh-
                                                                   MDA8 O3 (Fig. 2). Generally, increasing trends of MDA8
old concentration (35.1 ppb) (Lim et al., 2012; H. Liu et al.,
                                                                   O3 are found in vast areas from PRE-CNDH to CNDH, sug-
2018); and Pop is the population exposure to O3 , obtained
                                                                   gesting the elevated O3 occurs on a regional-scale. In South
from China’s Sixth Census data (Fig. S2) (National Bureau
                                                                   China, the predicted MDA8 O3 reaches ∼ 90 ppb, which is
of Statistics of China, 2010). The daily y0 and β values for all
                                                                   approximately 1.2 times that of the Class II standard, with
non-accidental causes, CVD, RD, hypertension, stroke, and
                                                                   an average increase rate of 30 %. The highest MDA8 O3
COPD are summarized in Table S6.
                                                                   drops sharply to 60 ppb in the same regions in AFT-CNDH.
                                                                   High O3 _NOx and O3 _VOC levels are also found during the
3     Results and discussion                                       CNDH with different spatial distributions (Fig. 2). The rising
                                                                   O3 _NOx areas are mainly located in South China, covering
3.1    Observational O3 in China during the CNDH                   Hubei, Hunan, Guangxi, Jiangxi, north Guangdong, and Fu-
                                                                   jian provinces, with an average increase of ∼ 5–10 ppb. In
MDA8 O3 levels have noticeably risen during the 2018               contrast, high O3 _VOC regions are in developed city clus-
CNDH based on observations, from 43 ppb (PRE-CNDH)                 ters such as the NCP, YRD, and PRD regions. In the PRD,
to 55 ppb (CNDH) among selected cities (Fig. 1a and Ta-            peak O3 _VOC is over 30 ppb during the CNDH, which is 1.5
ble S3). The most significant increase of MDA8 O3 (up to           times that in PRE-CNDH. Similar to MDA8 O3 , decreases
56 %) is observed in South China (Fig. 1b). The PRD re-            in both O3 _NOx and O3 _VOC are found in AFT-CNDH.
gion has recorded 49 % of MDA8 O3 increase, and in most            For the nine key cities, O3 _NOx and O3 _VOC are also in-
PRD cities (such as Shenzhen and Guangzhou), the number            creased during the CNDH. In Sanya, non-background O3
of exceeding days is as high as 5–7 d during the 7 d CNDH,         during the CNDH is 2 times that in PRE-CNDH. The peak
which contributed to 50 %–86 % of days exceeding the Chi-          of non-background O3 (O3 _NOx + O3 _VOC) is over 80 ppb
nese national air quality standards (Grade II, ∼ 75 ppb) in the    in Beijing and Zhuhai, indicating that O3 formation plays an

https://doi.org/10.5194/acp-21-10347-2021                                        Atmos. Chem. Phys., 21, 10347–10356, 2021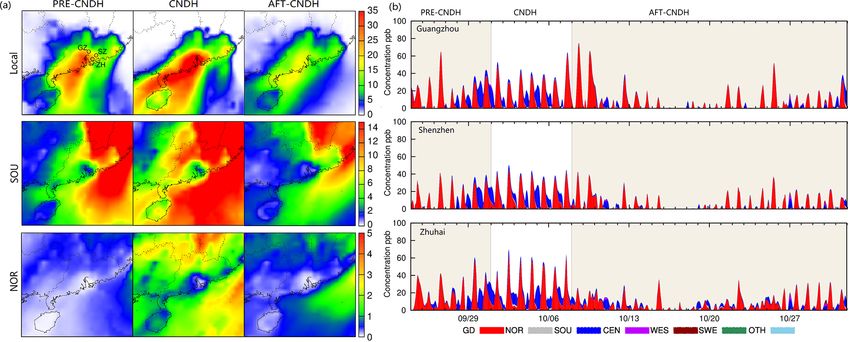
10350                                                                  P. Wang et al.: Unexpected enhancement of ozone exposure

Figure 1. (a) The observed average MDA8 O3 in PRE-CNDH, CNDH and AFT-CNDH in South, East, West and North China in 2018.
(b) The increase rate of observed MDA8 O3 during the CNDH. (c) The exceeding rate of observed MDA8 O3 in CNDH and October (the
exceeding days during the CNDH divided by those during October, i.e., exceeding_CNDH/exceeding_ October). Locations of these regions
are shown in Fig. S3. Blue dots refer to the key cities, and grey dots represent other cities. The pairs of values in the parentheses following
city names are the exceeding days in CNDH and October, respectively. IQR is the interquartile range.

important role during the CNDH (Fig. 3). In megacities such               ing AFT-CNDH, more areas develop into a transition regime
as Beijing, O3 _VOC is the major contributor to elevated O3 ,             in South China. The decreases in biogenic VOCs (BVOCs,
while O3 _NOx becomes significant in tourist cities such as               compared to CNDH) (Fig. 4) due to temperature (Fig. S5)
Sanya.                                                                    decrease MDA8 O3 for regions in a transition regime during
   From Fig. 4, it is seen that the anthropogenic O3 precur-              AFT-CNDH. Accordingly, changes in O3 highly depend on
sor emissions (NOx and VOCs) increase throughout China.                   its precursor (NOx and VOCs) emissions and the sensitivity
Increasing NOx emissions are observed in South China, es-                 regime.
pecially in Guangxi and Guangdong, with a relative increase                  Transportation increase due to tourism is also a potential
of up to 100 % during the CNDH. Considering O3 sensitivity                source of elevated O3 during holidays (Xu et al., 2017). How-
regimes (determined by Eq. 1), no noticeable differences are              ever, changes in transportation emissions are not considered
observed between PRE-CNDH and CNDH (Fig. S4). Dur-                        in this study due to a lack of related statistical data. Resi-
ing CNDH, the VOC-limited regions are mainly in the NCP                   dents prefer to travel during the CNDH, and thus more sig-
and YRD, accompanied by high O3 _VOC. In South China,                     nificant impacts may be from mobile sources (Zhao et al.,
O3 formation is under a transition regime in most regions,                2019). Traveling by private cars is the most common ap-
and NOx -limited areas are in Fujian and parts of Guangdong               proach, leading to a significant increase in vehicle activi-
and Guangxi, where there are rising NOx emissions. This                   ties (Z. Wang et al., 2019). Time-varying coefficients are
corresponds to an increase in O3 in these regions (Figs. 2                estimated to describe traffic flow according to a report by
and 4). Simultaneously, higher anthropogenic VOC emis-                    AMAP (2018) during the 2018 CNDH (Fig. S6). On average,
sions are also observed during the CNDH in South China,                   during CNDH, the traffic flow is 2.2 times that of ordinary
leading to elevated O3 in the transition regime when VOCs                 weeks. Heavy traffic flow occurs on 1 October (coefficient of
and NOx jointly controlled O3 formation. These increasing                 16.3 %) and 5 October (6.1 %) due to intensive departure and
O3 precursors emissions are mainly from the residential and               return. Hourly variations of traffic flow in CNDH are sim-
transportation sectors (Table S1), indicating their important             ilar to weekends, having a flatter trend compared to work-
roles in the elevated O3 during the CNDH. In contrast, dur-               days (Y. H. Liu et al., 2018). A real-time vehicle emission

Atmos. Chem. Phys., 21, 10347–10356, 2021                                                   https://doi.org/10.5194/acp-21-10347-2021

P. Wang et al.: Unexpected enhancement of ozone exposure                                                                        10351

Figure 2. (a) Comparison of observed (circle) and predicted MDA8 O3 . (b) Spatial distribution of O3 _NOx . (c) Spatial distribution of
O3 _VOC in China in PRE-CNDH, CNDH, and AFT-CNDH, respectively. Units are parts per billion (ppb). O3 _NOx and O3 _VOC are the
O3 attributed to NOx and VOCs, respectively.

Figure 3. Hourly O3 and its source apportionment results in nine key cities.

https://doi.org/10.5194/acp-21-10347-2021                                            Atmos. Chem. Phys., 21, 10347–10356, 2021

10352                                                               P. Wang et al.: Unexpected enhancement of ozone exposure

Figure 4. Changes of emissions in relative differences ((October–September)/September) of (a) NO2 and (b) NOx . Averaged emissions rates
of anthropogenic organic compounds (AVOCs) from the MEIC emission inventory in (c) September and (d) October and their difference (e).
Averaged BVOCs emission rates from the MEGAN model in (f) CNDH and their differences: (g) CNDH minus PRD-CNDH and (h) CNDH
minus AFT-CNDH. Units are moles per second (moles/s) for (c)–(h).

inventory should be developed in future to better predict O3          The enhanced regional transport and the increasing anthro-
changes during the CNDH.                                              pogenic emissions synergistically lead to the rising O3 dur-
                                                                      ing the CNDH, offsetting the impacts from the lower BVOCs
3.3   Impacts of regional transport during the CNDH                   emissions (Fig. 4).
                                                                         A regional-source tracking simulation was conducted in
                                                                      the PRD that predicted significant O3 elevation to qualify
Regional transport is also a significant contributor to en-
                                                                      the impacts of regional transport. The emissions were clas-
hanced MDA8 O3 during the CNDH. As shown in Fig. S5,
                                                                      sified into seven regional types (Fig. S9): the local PRD
the lower temperature is predicted during the CNDH com-
                                                                      (GD), northern part (NOR), southern part (SOU), central
pared to the PRE-CNDH. In PRD, the average temperature
                                                                      part (CEN), western part (WES), southeast part (SWE), and
drops from 25 to 23 ◦ C, leading to a lower O3 level in pre-
                                                                      other countries (OTH). The detailed model description can
vious studies (Fu et al., 2015; Bloomer et al., 2009; Pusede
                                                                      be found in P. Wang et al. (2020). Although the local sector
et al., 2015). Meanwhile, the increasing wind speed is pre-
                                                                      contributes more than 50 % non-background O3 from PRE-
dicted in the PRD, which is able to facilitate regional trans-
                                                                      CNDH to AFT-CNDH, more significant O3 regional trans-
port. The higher O3 production rates that are calculated by
                                                                      port is predicted during the late PRE-CNDH and CNDH in
the PA process directly in the CMAQ model (increase rate
                                                                      the PRD, demonstrating its important role in O3 elevation
up to ∼ 150 %) are predicted mainly in the urban regions
                                                                      (Figs. 5 and S10). The SOU sector is the most crucial con-
(the NCP, YRD, and PRD) in China (Fig. S7). With north
                                                                      tributor among all these regional sectors outside Guangdong
winds (Fig. S5), O3 is transported from the northern regions
                                                                      due to the prevailing north wind.
to downwind southern China to cause aggravated O3 . In the
                                                                         In these key PRD cities (Guangzhou, Shenzhen, and
nine key cites, enhanced regional transport (HADV, horizon-
                                                                      Zhuhai), the contribution of the SOU sector in the non-
tal advection) of O3 in Beijing, Changsha, Fuzhou, Shen-
                                                                      background O3 is up to ∼ 30 ppb, mainly occurring in the
zhen, Sanya, and Shanghai is as high as 90 ppb (Fig. S8).

Atmos. Chem. Phys., 21, 10347–10356, 2021                                              https://doi.org/10.5194/acp-21-10347-2021
P. Wang et al.: Unexpected enhancement of ozone exposure 10353
Figure 5. (a) Average regional contributions to non-background O3 from the PRD local emissions and emissions in SOU and NOR sectors
and (b) regional contributions from all sectors to non-background O3 in the key PRD cities (Guangzhou, Shenzhen, and Zhuhai) during the
simulation periods. GZ: Guangzhou, SZ: Shenzhen, and ZH: Zhuhai.
nighttime and early morning (Fig. 5). In the noontime,
∼ 10 %–15 % non-background O3 is from the SOU sector
during the CNDH compared to less than 5 % in other pe-
riods. The O3 _NOx shows more significant regional trans-
port characteristics than the O3 _VOC (Figs. S11 and S12).
During the late PRE-CNDH and the CNDH, the contribu-
tion from regional transport in the O3 _NOx is up to 35 ppb.
Due to the enhanced regional transport during the CNDH, the
O3 _NOx could be even transported from the long-distance
sector as NOR to the PRD. The peak of O3 _NOx due to re-
gional transport is predicted at midnight, which is different
from O3 _VOC (peak at noontime).
3.4 Aggravated health risk during the CNDH
It is recognized that O3 pollution induces serious health risks
from CVD, RD, COPD, hypertension, and stroke (Lelieveld
et al., 2013; Yin et al., 2017; Huang et al., 2018; Krewski Figure 6. (a) National daily mortality from all non-accidental
et al., 2009). Elevated MDA8 O3 during the CNDH leads to causes, CVD, RD, COPD, hypertension, and stroke attributed to
significantly higher health risks (Fig. 6). The estimated total O3 in PRE-CNDH, CNDH, and AFT-CNDH and (b) daily mortal-
national daily mortality (from all non-accidental causes) due ity from all non-accidental causes due to O3 in the nine key cities.
Red/blue values above the bars are the increase/decrease rates of
to MDA8 O3 is 2629 during the CNDH, 33 % higher than
daily mortality from PRE-CNDH to CNDH. CVD: cardiovascular
that (1982) in PRE-CNDH. All above O3 -related diseases
disease; RD: respiratory disease; COPD: chronic obstructive pul-
have noticeable increases in national daily mortality during monary disease.
the CNDH. The highest health risk among these diseases is
from CVD (674 during the CNDH), which is consistent with
Yin et al. (2017), followed by RD (219), COPD (213), hy-
pertension (189), and stroke (22). The COPD mortality due especially in densely populated regions (e.g., the YRD and
to O3 in this study is comparable with 152–220 in H. Liu PRD) (Fig. S11), which is consistent with previous studies
et al. (2018). In AFT-CNDH, total daily mortality (drops to (Chen et al., 2018; H. Liu et al., 2018; Y. Wang et al., 2020).
1653) and mortality from all diseases decrease due to sub- Except for Shanghai (in which O3 is slightly underesti-
stantial O3 reduction. Also, a significant increase of the total mated), the total daily mortality rates in the other eight key
daily mortality is shown throughout China during the CNDH, cities increased from PRE-CNDH to CNDH. Four megaci-
https://doi.org/10.5194/acp-21-10347-2021 Atmos. Chem. Phys., 21, 10347–10356, 202110354 P. Wang et al.: Unexpected enhancement of ozone exposure
ties (Beijing, Shanghai, Wuhan, and Guangzhou) with enor- Competing interests. The authors declare that they have no conflict
mous populations have the highest daily deaths (24–28) dur- of interest.
ing the CNDH, 50 % larger than the mean level (16) in the
other 272 Chinese cities (Chen et al., 2018; Yin et al., 2017).
It is worth noting that a higher increase rate of daily mortal- Disclaimer. Publisher’s note: Copernicus Publications remains
ity is found in tourist cities (Sanya and Changsha). In Sanya, neutral with regard to jurisdictional claims in published maps and
daily deaths even increase by as much as 303 % from PRE- institutional affiliations.
CNDH to CNDH. An even higher increase in health risk may
occur in Sanya if a sharp increase in tourist flow during the
Acknowledgements. This work was supported by the Na-
CNDH is considered.
tional Natural Science Foundation of China (42022023 and
41961144029), the National Key Research and Development
Program (2017YFC02122802), the Chinese Academy of Sci-
4 Conclusion and implications ences (XDA23020301 and QYZDJ-SSW-DQC032/XDPB1901),
the Hong Kong Research Grants Council (T24-504/17-N/A-
In this study, we find a significant increase in O3 during PolyU502/16), the Youth Innovation Promotion Association, CAS
the CNDH throughout China, especially in the southern (2017406), and the Guangdong Foundation for Program of Science
parts, which is attributed to the changes in precursor emis- and Technology Research (2020B1212060053).
sions, sensitivity regime, and enhanced regional transport.
Moreover, elevated O3 also causes severe impacts on hu-
man health, with total daily mortality from all non-accidental Financial support. This research has been supported by the Na-
causes increasing from 151 to 201 in China. More compre- tional Natural Science Foundation of China (42022023 and
hensive studies should be conducted to understand better the 41961144029), the National Key Research and Development
long-term holiday impacts (such as during the CNDH) of O3 Program (2017YFC02122802), the Chinese Academy of Sci-
ences (XDA23020301 and QYZDJ-SSW-DQC032/XDPB1901),
in the future, and here we suggest the following:
the Hong Kong Research Grants Council (T24-504/17-N/A-
PolyU502/16), the Youth Innovation Promotion Association, CAS
1. More strident emission control policies should be im- (2017406), and the Guangdong Foundation for Program of Science
plemented in China before and during the CNDH to in- and Technology Research (2020B1212060053).
hibit the elevated O3 . And more localized control poli-
cies with the consideration of the O3 sensitivity regimes
should be applied. Review statement. This paper was edited by John Orlando and re-
viewed by Maryam Abdi-Oskouei and two anonymous referees.
2. In order to reduce the health risk from the elevated O3 , it
is suggested to avoid traveling in rush hours, especially
at midday during the CNDH.
3. Reducing the activities of private gasoline vehicles References
is effective in mitigating excess emissions during the
CNDH. It is encouraged to travel by electric car or pub- AMAP: Forecast report on travel index during Mid-Autumn Festi-
val and National Day in 2018, https://report.amap.com/m/dist/#/
lic transportation such as bus, subway, and train.
reports (last access: 1 July 2021), 2018.
Anenberg, S. C., Horowitz, L. W., Tong, D. Q., and West, J. J.: An
Estimate of the Global Burden of Anthropogenic Ozone and Fine
Data availability. The datasets used in the study can be ac- Particulate Matter on Premature Human Mortality Using At-
cessed from websites listed in the references or by con- mospheric Modeling, Environ. Health Persp., 118, 1189–1195,
tacting the corresponding author (zhang_yl86@gig.ac.cn). All 2010.
data are available at Zenodo https://zenodo.org/record/5064149# Bloomer, B. J., Stehr, J. W., Piety, C. A., Salawitch, R. J., and Dick-
.YOVZUEyxVjX (Wang, 2021). erson, R. R.: Observed relationships of ozone air pollution with
temperature and emissions, Geophys. Res. Lett., 36, L09803,
https://doi.org/10.1029/2009GL037308, 2009.
Supplement. The supplement related to this article is available on- Brauer, M., Freedman, G., Frostad, J., Van Donkelaar, A., Martin,
line at: https://doi.org/10.5194/acp-21-10347-2021-supplement. R. V., Dentener, F., Van Dingenen, R., Estep, K., Amini, H., and
Apte, J. S.: Ambient Air Pollution Exposure Estimation for the
Global Burden of Disease 2013, Environ. Sci. Technol., 50, 79–
Author contributions. PW and YZ designed the research. PW, JS, 88, 2016.
MX, SS, and HZ analyzed the data. PW performed the air quality Chen, K., Fiore, A. M., Chen, R., Jiang, L., Jones, B., Schneider, A.,
model. PW and YZ wrote the manuscript with comments from all Peters, A., Bi, J., Kan, H., and Kinney, P. L.: Future ozone-related
co-authors. acute excess mortality under climate and population change sce-
Atmos. Chem. Phys., 21, 10347–10356, 2021 https://doi.org/10.5194/acp-21-10347-2021P. Wang et al.: Unexpected enhancement of ozone exposure 10355
narios in China: A modeling study, PLOS Med., 15, e1002598, tion and mortality, Res. Rep. Health Eff. Inst., 5–114, 115–136,
https://doi.org/10.1371/journal.pmed.1002598, 2018. 2009.
Chen, P., Tan, P., Chou, C. C. K., Lin, Y., Chen, W., and Shiu, Lelieveld, J., Barlas, C., Giannadaki, D., and Pozzer, A.: Model
C.: Impacts of holiday characteristics and number of vacation calculated global, regional and megacity premature mortality
days on “holiday effect” in Taipei: Implications on ozone control due to air pollution, Atmos. Chem. Phys., 13, 7023–7037,
strategies, Atmos. Environ., 202, 357–369, 2019. https://doi.org/10.5194/acp-13-7023-2013, 2013.
Cohan, D. S., Hakami, A., Hu, Y., and Russell, A. G.: Nonlinear Levy, I.: A national day with near zero emissions and its effect
response of ozone to emissions: source apportionment and sensi- on primary and secondary pollutants, Atmos. Environ., 77, 202–
tivity analysis, Environ. Sci. Technol., 39, 6739–6748, 2005. 212, https://doi.org/10.1016/j.atmosenv.2013.05.005, 2013.
Cohen, A. J., Anderson, H. R., Ostro, B., Pandey, K. D., Li, K., Jacob, D. J., Liao, H., Shen, L., Zhang, Q., and Bates, K.
Krzyzanowski, M., Künzli, N., Gutschmidt, K., Pope, A., H.: Anthropogenic drivers of 2013–2017 trends in summer sur-
Romieu, I., Samet, J. M., and Smith, K.: Urban air pollution, in: face ozone in China, P. Natl. Acad. Sci. USA, 116, 422-427,
Comparative quantification of health risks, Global and regional 10.1073/pnas.1812168116, 2019.
burden of disease attributable to selected major risk factors, Vol- Li, M., Zhang, Q., Kurokawa, J.-I., Woo, J.-H., He, K., Lu, Z.,
ume 1, World Health Organization, Geneva, 2004. Ohara, T., Song, Y., Streets, D. G., Carmichael, G. R., Cheng,
Emery, C., Tai, E., and Yarwood, G.: Enhanced meteorologi- Y., Hong, C., Huo, H., Jiang, X., Kang, S., Liu, F., Su, H.,
cal modeling and performance evaluation for two Texas ozone and Zheng, B.: MIX: a mosaic Asian anthropogenic emission
episodes, Prepared for the Texas natural resource conservation inventory under the international collaboration framework of
commission, ENVIRON International Corporation, 2001. the MICS-Asia and HTAP, Atmos. Chem. Phys., 17, 935–963,
Fang, X., Park, S., Saito, T., Tunnicliffe, R., Ganesan, A. L., Rigby, https://doi.org/10.5194/acp-17-935-2017, 2017.
M., Li, S., Yokouchi, Y., Fraser, P. J., and Harth, C. M.: Rapid Li, T., Yan, M., Ma, W., Ban, J., Liu, T., Lin, H., and Liu, Z.: Short-
increase in ozone-depleting chloroform emissions from China, term effects of multiple ozone metrics on daily mortality in a
Nat. Geosci., 12, 89–93, 2019. megacity of China, Environ. Sci. Pollut. Res., 22, 8738–8746,
Fu, T.-M., Zheng, Y., Paulot, F., Mao, J., and Yantosca, R. M.: Pos- 2015.
itive but variable sensitivity of August surface ozone to large- Li, Y., Lau, A. K. H., Fung, J. C. H., Zheng, J., Zhong, L., and
scale warming in the southeast United States, Nat. Clim. Change, Louie, P. K. K.: Ozone source apportionment (OSAT) to differen-
5, 454–458, 2015. tiate local regional and super-regional source contributions in the
Gao, J., Zhu, B., Xiao, H., Kang, H., Hou, X., and Shao, P.: A case Pearl River Delta region, China, J. Geophys. Res., 117, D15305,
study of surface ozone source apportionment during a high con- https://doi.org/10.1029/2011JD017340, 2012a.
centration episode, under frequent shifting wind conditions over Li, Y., Lau, A. K. H., Fung, J. C. H., Zheng, J. Y., Zhong, L. J.,
the Yangtze River Delta, China, Sci. Total Environ., 544, 853– and Louie, P. K. K.: Ozone source apportionment (OSAT) to dif-
863, https://doi.org/10.1016/j.scitotenv.2015.12.039, 2016. ferentiate local regional and super-regional source contributions
Gipson, G. L.: Process analysis. In science algorithms of the EPA in the Pearl River Delta region, China, J. Geophys. Res.-Atmos.,
models-3 Community Multiscale Air Quality (CMAQ) Modeling 117, D15305, https://doi.org/10.1029/2011JD017340, 2012b.
System, chap. 16, EPA/600/R-99/030, available at: https://www. Lim, S. S., Vos, T., Flaxman, A. D., Danaei, G., Shibuya, K., Adair-
cmascenter.org/cmaq/science_documentation/pdf/ch16.pdf (last rohani, H., Almazroa, M. A., Amann, M., Anderson, H. R., and
access: 5 August 2020), 1999. Andrews, K. G.: A comparative risk assessment of burden of
Guenther, A. B., Jiang, X., Heald, C. L., Sakulyanontvittaya, disease and injury attributable to 67 risk factors and risk factor
T., Duhl, T., Emmons, L. K., and Wang, X.: The Model of clusters in 21 regions, 1990–2010: a systematic analysis for the
Emissions of Gases and Aerosols from Nature version 2.1 Global Burden of Disease Study 2010, Lancet, 380, 2224–2260,
(MEGAN2.1): an extended and updated framework for mod- 2012.
eling biogenic emissions, Geosci. Model Dev., 5, 1471–1492, Liu, H., Liu, S., Xue, B., Lv, Z., Meng, Z., Yang, X., Xue,
https://doi.org/10.5194/gmd-5-1471-2012, 2012. T., Yu, Q., and He, K.: Ground-level ozone pollution and
Hu, J., Chen, J., Ying, Q., and Zhang, H.: One-year simulation its health impacts in China, Atmos. Environ., 173, 223–230,
of ozone and particulate matter in China using WRF/CMAQ https://doi.org/10.1016/j.atmosenv.2017.11.014, 2018.
modeling system, Atmos. Chem. Phys., 16, 10333–10350, Liu, Y. H., Ma, J. L., Li, L., Lin, X. F., Xu, W. J., and
https://doi.org/10.5194/acp-16-10333-2016, 2016. Ding, H.: A high temporal-spatial vehicle emission inven-
Huang, J., Pan, X., Guo, X., and Li, G.: Health impact of China’s tory based on detailed hourly traffic data in a medium-
Air Pollution Prevention and Control Action Plan: an analysis of sized city of China, Environ. Pollut., 236, 324–333,
national air quality monitoring and mortality data, The Lancet https://doi.org/10.1016/j.envpol.2018.01.068, 2018.
Planetary Health, 2, E313–E323, https://doi.org/10.1016/S2542- Lu, X., Hong, J., Zhang, L., Cooper, O. R., Schultz, M.
5196(18)30141-4, 2018. G., Xu, X., Wang, T., Gao, M., Zhao, Y., and Zhang,
Krewski, D., Jerrett, M., Burnett, R. T., Ma, R., Hughes, E., Shi, Y.: Severe Surface Ozone Pollution in China: A Global
Y., Turner, M. C., Pope, C. A., 3rd, Thurston, G., Calle, E. E., Perspective, Environ. Sci. Technol. Let., 5, 487–494,
Thun, M. J., Beckerman, B., DeLuca, P., Finkelstein, N., Ito, K., https://doi.org/10.1021/acs.estlett.8b00366, 2018.
Moore, D. K., Newbold, K. B., Ramsay, T., Ross, Z., Shin, H., National Health and Family Planning Commission of China:
and Tempalski, B.: Extended follow-up and spatial analysis of China health statistics yearbook, available at: https://www.
the American Cancer Society study linking particulate air pollu- yearbookchina.com/navibooklist-n3018112802-1.html (last ac-
cess: 5 August 2020), 2018.
https://doi.org/10.5194/acp-21-10347-2021 Atmos. Chem. Phys., 21, 10347–10356, 202110356 P. Wang et al.: Unexpected enhancement of ozone exposure National Bureau of Statistics of China: Tabulation on the 2010 Pop- Wang, P.: Unexpected enhancement of ozone exposure and ulation Census of the People’s Republic of China, available at: health risks duringNational Day in China. http://doi.org/10.5194/ http://www.stats.gov.cn/tjsj/pcsj/rkpc/6rp/indexch.htm (last ac- acp-2020-1302, Zenodo, https://zenodo.org/record/5064149# cess: 5 August 2020), 2010. .YOVZUEyxVjX, 2021. Pudasainee, D., Sapkota, B., Bhatnagar, A., Kim, S., and Seo, Y.: Wang, T., Xue, L., Brimblecombe, P., Lam, Y. F., Li, L., Influence of weekdays, weekends and bandhas on surface ozone and Zhang, L.: Ozone pollution in China: A review of in Kathmandu valley, Atmos. Res., 95, 150–156, 2010. concentrations, meteorological influences, chemical precur- Pusede, S. E., Steiner, A. L., and Cohen, R. C.: Temperature and re- sors, and effects, Sci. Total Environ., 575, 1582–1596, cent trends in the chemistry of continental surface ozone, Chem. https://doi.org/10.1016/j.scitotenv.2016.10.081, 2017. Rev., 115, 3898–3918, 2015. Wang, Y., Wild, O., Chen, X., Wu, Q., Gao, M., Chen, H., Qi, Sillman, S.: The use of NOy , H2 O2 , and HNO3 as indi- Y., and Wang, Z.: Health impacts of long-term ozone expo- cators for ozone-NOx -hydrocarbon sensitivity in urban sure in China over 2013–2017, Environ. Int., 144, 106030, locations, J. Geophys. Res.-Atmos., 100, 14175–14188, https://doi.org/10.1016/j.envint.2020.106030, 2020. https://doi.org/10.1029/94jd02953, 1995. Wang, Z., Chen, Y., Su, J., Guo, Y., Zhao, Y., Tang, W., Zeng, C., Sillman, S. and He, D.: Some theoretical results concerning O3 - and Chen, J.: Measurement and Prediction of Regional Traffic NOx -VOC chemistry and NOx -VOC indicators, J. Geophys. Volume in Holidays, 2019 IEEE Intelligent Transportation Sys- Res., 107, 4659, https://doi.org/10.1029/2001JD001123, 2002. tems Conference, ITSC 2019, 486–491, 2019. Streets, D. G., Bond, T. C., Carmichael, G. R., Fernandes, S. D., Fu, Wiedinmyer, C., Akagi, S. K., Yokelson, R. J., Emmons, L. K., Al- Q., He, D., Klimont, Z., Nelson, S. M., Tsai, N. Y., Wang, M. Saadi, J. A., Orlando, J. J., and Soja, A. J.: The Fire INventory Q., Woo, J. H., and Yarber, K. F.: An inventory of gaseous and from NCAR (FINN): a high resolution global model to estimate primary aerosol emissions in Asia in the year 2000, J. Geophys. the emissions from open burning, Geosci. Model Dev., 4, 625– Res.-Atmos., 108, 8809, https://doi.org/10.1029/2002JD003093, 641, https://doi.org/10.5194/gmd-4-625-2011, 2011. 2003. Xu, Z., Huang, X., Nie, W., Chi, X., Xu, Z., Zheng, L., Sun, Tan, P., Chou, C., Liang, J., Chou, C. C. K., and Shiu, C.: Air pol- P., and Ding, A.: Influence of synoptic condition and holi- lution ”holiday effect” resulting from the Chinese New Year, At- day effects on VOCs and ozone production in the Yangtze mos. Environ., 43, 2114–2124, 2009. River Delta region, China, Atmos. Environ., 168, 112–124, Tan, P.-H., Chou, C., and Chou, C. C. K.: Impact of urbanization on https://doi.org/10.1016/j.atmosenv.2017.08.035, 2017. the air pollution “holiday effect” in Taiwan, Atmos. Environ., 70, Yin, P., Chen, R., Wang, L., Meng, X., Liu, C., Niu, Y., Lin, Z., 361–375, https://doi.org/10.1016/j.atmosenv.2013.01.008, 2013. Liu, Y., Liu, J., and Qi, J.: Ambient Ozone Pollution and Daily US EPA: Guidance on the Use of Models and Other Anal- Mortality: A Nationwide Study in 272 Chinese Cities, Environ. yses in Attainment Demonstrations for the 8-hour Ozone Health Persp., 125, 117006, https://doi.org/10.1289/EHP1849, NAAQS, EPA-454/R-05-002, available at: https://nepis.epa.gov/ 2017. Exe/ZyPDF.cgi/P1006FPU.PDF?Dockey=P1006FPU.PDF (last Zhang, H., Li, J., Ying, Q., Yu, J. Z., Wu, D., Cheng, Y., access: 5 August 2020), 2005. He, K., and Jiang, J.: Source apportionment of PM2.5 Wang, J., Ho, S. S. H., Cao, J., Huang, R., Zhou, J., Zhao, Y., nitrate and sulfate in China using a source-oriented chem- Xu, H., Liu, S., Wang, G., Shen, Z., and Han, Y.: Character- ical transport model, Atmos. Environ., 62, 228–242, istics and major sources of carbonaceous aerosols in PM2.5 https://doi.org/10.1016/j.atmosenv.2012.08.014, 2012. from Sanya, China, Sci. Total Environ., 530–531, 110–119, Zhang, Q., Streets, D. G., He, K., Wang, Y., Richter, A., Burrows, J. https://doi.org/10.1016/j.scitotenv.2015.05.005, 2015. P., Uno, I., Jang, C. J., Chen, D., Yao, Z., and Lei, Y.: NOx emis- Wang, J., Zhao, B., Wang, S., Yang, F., Xing, J., Morawska, L., sion trends for China, 1995–2004: The view from the ground Ding, A., Kulmala, M., Kerminen, V.-M., Kujansuu, J., Wang, and the view from space, J. Geophys. Res.-Atmos., 112, D22306, Z., Ding, D., Zhang, X., Wang, H., Tian, M., Petäjä, T., Jiang, https://doi.org/10.1029/2007JD008684, 2007. J., and Hao, J.: Particulate matter pollution over China and the Zhao, J., Cui, J., Zhang, Y., and Luo, T.: Impact of holiday-free effects of control policies, Sci. Total Environ., 584–585, 426– policy on traffic volume of freeway: An investigation in Xi’an, in: 447, https://doi.org/10.1016/j.scitotenv.2017.01.027, 2017. 8th International Conference on Green Intelligent Transportation Wang, P., Chen, Y., Hu, J., Zhang, H., and Ying, Q.: Attribution of Systems and Safety, 2017, edited by: Wang, W., Jiang, X., and Tropospheric Ozone to NOx and VOC Emissions: Considering Bengler, K., Springer Verlag, 117–124, 2019. Ozone Formation in the Transition Regime, Environ. Sci. Tech- nol., 53, 1404–1412, https://doi.org/10.1021/acs.est.8b05981, 2019a. Wang, P., Chen, Y., Hu, J., Zhang, H., and Ying, Q.: Source ap- portionment of summertime ozone in China using a source- oriented chemical transport model, Atmos. Environ., 211, 79–90, https://doi.org/10.1016/j.atmosenv.2019.05.006, 2019b. Wang, P., Wang, T., and Ying, Q.: Regional source appor- tionment of summertime ozone and its precursors in the megacities of Beijing and Shanghai using a source-oriented chemical transport model, Atmos. Environ., 224, 117337, https://doi.org/10.1016/j.atmosenv.2020.117337, 2020. Atmos. Chem. Phys., 21, 10347–10356, 2021 https://doi.org/10.5194/acp-21-10347-2021
You can also read