North African dust intrusions and increased risk of respiratory diseases in Southern Portugal
←
→
Page content transcription
If your browser does not render page correctly, please read the page content below
International Journal of Biometeorology
https://doi.org/10.1007/s00484-021-02132-x

    ORIGINAL PAPER

North African dust intrusions and increased risk of respiratory
diseases in Southern Portugal
T. Silva 1,5     &   M. Fragoso 1 & R. Almendra 2 & J. Vasconcelos 1,3 & A. Lopes 1 & A. Faleh 4

Received: 28 May 2020 / Revised: 30 March 2021 / Accepted: 9 April 2021
# The Author(s) 2021

Abstract
The study of dust intrusions in Portugal is still a subject on which little investigation has been made, especially in terms of their
effects. Thus, this work aims to achieve two goals: firstly, to characterize the dust intrusions in the study area; and secondly, to
evaluate the possible statistical association between the dust intrusion days and hospital admissions due to respiratory diseases. Dust
intrusions in Portugal are prevalent during the summer season. During this season, the dust plumes tend to cover broader areas than
in the other seasons and they have origin in the North African countries. In the study area for the period between 2005 and 2015, the
relative risk of urgent hospitalizations due to respiratory diseases was 12.6% higher during dust intrusion days. In order to obtain this
statistical association, a Distributed Lag Nonlinear Model was developed. With this work, we expect to help the development of
further studies regarding North African dust intrusions in Portugal, more precisely their effects on human health.

Keywords Portugal . North African dust . Respiratory diseases . Hospital admissions . DLNM

Introduction                                                              that can be breathed into the lungs and invade the smallest
                                                                          airways, including alveolar tissue (Goudie 2014), but also
Desert dust intrusions are a growing study object across the              because of other components as allergens, toxic chemicals
world mainly because of their potential environmental and                 (Goudie and Middleton 2006), microbes and fungi (Griffin
human health impacts. Thus, in Europe, especially in the                  et al. 2002).
southern countries, they are increasingly being studied by                    Several papers have highlighted that particulate matter may
the scientific community.                                                 trigger inflammatory stress responses associated with chronic
   Dust storms are events generated by the action of the wind             obstructive pulmonary disease (Middleton 2017), asthma,
which will cause the movement of sediments from the surface               bronchitis (Middleton 2017; Samoli et al. 2011a; UNEP
to the lower atmosphere (UNEP et al. 2016). Dust storms are               et al. 2016), pneumonia, allergic rhinitis, irritations and in-
the form of atmospheric pollution that affect people mostly               flammations in the upper respiratory system (UNEP et al.
(UNEP et al. 2016), not only because of the fine particle size            2016) and cardiovascular conditions (Middleton et al. 2008).
                                                                          These diseases, along with flu, irritations and inflammations
                                                                          in the lower respiratory system, rhinitis and pneumoconiosis,
* T. Silva                                                                have been chosen for this study.
  silvatiago@campus.ul.pt                                                     Epidemiological studies have shown a relation between
                                                                          these dust intrusions and hospital admissions (Alessandrini
1
     University of Lisbon, Institute of Geography and Spatial Planning    et al. 2013; Brunekreef and Forsberg 2005; Chien et al.
     (IGOT), Centre of Geographical Studies (CEG), Lisbon, Portugal       2012; Gyan et al. 2005; Middleton et al. 2008) and mortality
2
     Department of Geography and Tourism, University of Coimbra,          (Alessandrini et al. 2013; Mallone et al. 2011; Neophytou
     Centre of Studies in Geography and Spatial Planning (CEGOT),         et al. 2013; Pérez et al. 2008, 2012; Sajani et al. 2011;
     Coimbra, Portugal
                                                                          Samoli et al. 2011b). Studies conducted by Alessandrini
3
     Polytechnic of Leiria , Leiria, Portugal                             et al. (2013), Sajani et al. (2011) and Samoli et al. (2011a)
4
     Sidi Mohammed Ben Abdellah University-Fès , Fès, Morocco             have also shown a relation between these phenomena and the
5
     Portuguese Institute for Sea and Atmosphere (IPMA) ,                 increase of respiratory diseases. Some of these studies evalu-
     Lisbon, Portugal                                                     ate these relations through lagged effect models, for example,
Int J Biometeorol

Jiménez et al. (2010), Middleton et al. (2008) and Samoli et al.      5°C, and during the summer, it reaches temperatures higher
(2011a, 2011b). In the Iberian Peninsula, Linares et al. (2020),      than 30°C.
Ortiz et al. (2017) and Stafoggia et al. (2013, 2016) have               This study area has been chosen for two reasons: firstly and
shown that there is a relationship between exposure to partic-        more importantly due to the availability of hospital admission
ulate matter and an increase in mortality and hospital admis-         data for Central Alentejo; and secondly, the region of Alentejo
sions regarding cardiovascular and respiratory disorders.             (NUT II) is one of the closest Portuguese regions to North
    Other authors have studied different aspects of the dust intru-   Africa, and because of that, it is also one of the most affected
sions like Escudero et al. (2005), Goudie and Middleton, (2006)       by North African dust intrusions according to the air quality
and Griffin et al. (2002) who studied the dust chemical and           reports produced by the Portuguese Environmental Agency
organic composition; Couto et al. (2021), Russo et al. (2020),        (for further information see the reports identificação e
Díaz et al. (2017) and Salvador et al. (2013) who focused on the      avaliação de eventos naturais em Portugal no ano de… from
synoptic conditions during dust intrusion days; and more              2006 to 2015).
recently, Sousa et al. (2019) who studied the relation between
dust intrusions days and heat waves. Several authors have ap-
plied Distributed Lag Nonlinear Regression Models to study the
                                                                      Data and methods
relationship between physical environmental health determinants
(e.g., dust concentrations and meteorological parameters, among
                                                                      The APA (Agência Portuguesa do Ambiente—Portuguese
others) and their lagged effects on human health (Almendra et al.
                                                                      Environmental Agency) reports about natural events detected
2019a; Almendra et al. 2019b; Gasparrini and Armstrong 2011;
                                                                      in Portugal such as dust intrusions were crucial to this study
Stafoggia et al. 2013; Silva 2015; Vasconcelos et al. 2013).
                                                                      because it enabled us to identify which days have been affect-
    The association between dust events and hospitalizations or
                                                                      ed by North African dust. Between 2006 and 2015, 825 dust
hospital morbidity is still not clear in Portugal, and studies are
                                                                      intrusion days were identified in Alentejo. To verify among
still very scarce, and therefore, it is an innovative study in the
                                                                      these 825 intrusion days which dust intrusions overlapped the
country. Thus, in this study, the association between hospital
                                                                      Central Alentejo region (Fig. 1), a checking procedure was
admissions due to respiratory diseases and the occurrence of
                                                                      carried out. Hence, we have strained the APA inventory into
dust intrusions in Central Alentejo (Portugal) was assessed.
                                                                      a study inventory (resulting in 246 days) using satellite imag-
    Therefore, two main objectives have been established for
                                                                      ery, backward trajectories and PM10 concentrations. There is
the present study: first to characterize the North African dust
                                                                      no APA report for the year 2005, so the days were identified
intrusions in the study area, in terms of the temporal and spa-
                                                                      with the same methodology used to create the study inventory.
tial distribution, and the effects of particle concentrations on
                                                                      The study inventory was also used as a mean of comparison
the air quality at the surface; and second, to evaluate the pos-
                                                                      for the Distribution Lag Nonlinear Regression Model used in
sible statistical association between the identified dust days
                                                                      the present study.
and the emergency hospital admissions due to respiratory
diseases.
                                                                      Data

Study area                                                            To reduce the size of APA inventory and to achieve the first
                                                                      objective, the following data was used:
Central Alentejo, NUT III, the central area of Alentejo region,
is one of the statistical regions of Portugal, located in the south   &   APA inventories: the criteria used by APA to identify a
of the country, matching Évora district (Fig. 1). It has an area          dust intrusion day is established by the European
of 7393 km2 (8% of the Portuguese territory) (PIAAC-AC.                   Commission in the document “Establishing guidelines
2018). Portugal, especially the study area, is located geo-               for demonstration and subtraction of exceedances attribut-
graphically close to North Africa and the Sahara Desert, hence            able to natural sources under the Directive 2008/50/EC on
the importance of this study. Central Alentejo had a mean                 ambient air quality and cleaner air for Europe”. Among
population density of 20.9 inhabitants per square kilometre               the five criteria established in this document, APA only
in 2018 with circa 154,500 residents (INE 2018). Of the                   uses three of the required measures (Table 1).
154,536 inhabitants, 26,671 are between 0 and 19 years old            &   Satellite images: real colour images and two aerosol
and 39,808 are 65 plus years old (INE 2018). The study area               concentration layers (deep blue aerosol optical depth
has one central public, Hospital do Espírito Santo (Fig. 1).              and aerosol optical depth) from Terra and Aqua sat-
Alentejo climate is classified, according to Köppen classifica-           ellites with MODIS sensor (Table 1) were used to
tion, as Csa (PIAAC-AC. 2018). The mean annual tempera-                   create the new inventory and to delimit the bound-
ture is 16°C. During winter, temperature may reach as low as              aries of the dust plumes.
Int J Biometeorol
a
b
Fig. 1 Study area (a) and North African major dust sources (b). The study area is also represented by the rural background station where the pollutants
were measured and the hospital which supplied the internment dataInt J Biometeorol
1.9%; RH: 1.8%; WV: 1.6%; P: 1.6%. Meteorological
&
HYSPLIT models; PM10 and PM2.5 concentrations;
Missing values: PM10: 21%; PM2.5: 18%. Daily mean
HYSPLIT backward trajectories proposed by Stein et al.
limits: PM10: 50 μg/m3; PM2.5: 25 μg/m3. Station
Destination point defined: 38°34′ 47″ N, 7°54′36″ W
Used to identify dust over oceans and dark land such
Missing values: MeanT: 1.9%; MinT: 2.2%; MaxT:
(2015): the HYSPLIT model was used to help reduce the
dust intrusion prediction models (e.g., SKIRON,
Criteria used by APA to identify dust intrusions:
Used to identify dust over deserts and arid lands
APA inventory and to help understand which North
station location: 38°31′48″ N, 7°54′36″ W
African regions the dust came from, illustrating the
pathway taken by the transported dust until they arrived
location: 38°36′54″ N, 7°23′51″ W
in Central Alentejo. To build these models, some
parameters had to be defined, such as the destination
point (Table 1) and the atmospheric database (Reanalysis
NCEP/NCAR). The backward trajectories were calculated
Other characteristics
as vegetated areas
always up to 5 days prior to the event (dust intrusion in
BSC-DREAM)
Central Alentejo) for 700, 1500 and 2500 m of altitude
ICD-9-CM.
(above ground level).
& PM10 and PM2.5 daily concentrations: the pollutants
constituted another type of data that helped to strain the
APA inventory. The daily mean limits defined by the
Grouping of Health Centers in Central Alentejo.
European Commission were considered for both pollut-
ants (Table 1). These data were retrieved from QualAr
and Climate; KNMI Climate Explorer
website (APA), for Terena rural station (Fig, 1). Only days
with more than 12-h PM10/PM2.5 measures were taken
NASA WorldView-Terra/MODIS
NOAA Air Resources Laboratory
ICT-Atmospheric Sciences Water
into account to calculate the daily average.
NASA WorldView-Terra and
NASA WorldView-Terra and
Agência Portuguesa do
To achieve the second goal, the following data were also
Ambiente (APA)
Aqua/MODIS
Aqua/MODIS
used:
APA-QualAr
& Meteorological data: the used data were as follows: mean
Source
temperature (°C), maximum temperature (°C), minimum
temperature (°C), wind velocity (m/s), relative humidity
(%) and precipitation (mm), from Évora/Geophysical cen-
North Africa/Iberian Peninsula
tre meteorological station (Table 1). These meteorological
NUTS III-Central Alentejo
Évora/Geophysical centre
variables were important for two reasons: firstly, to assess
the atmospheric and environmental conditions during dust
Spatial resolution
NUTS II-Alentejo
intrusion days and to compare these same conditions be-
tween days with dust (APA and study inventories) and
2 km pixel
2 km pixel
5 km pixel
days without dust intrusions; and secondly, to be intro-
Terena
duced in the DLNM as co-variables.
& Hospital admissions data: daily urgent hospitalizations
due to respiratory pathologies (ICD9: 460-519—for more
Frequency
details see Table S1) at the Espiríto Santo hospital in
Hourly
Yearly
Daily
Daily
Daily
Daily
Daily
Daily
Évora were taken into account (Table 1). The data was
stratified by age group (0–16; ≥65) and season (from win-
ter solstice to summer solstice).
2006–2015
2005–2015
2005–2015
2005–2015
2005–2015
2005–2015
2005–2015
2005–2015
Period
Methods
Satellite imagery—real colour
blue aerosol optical depth
Satellite imagery—aerosol
Straining the APA inventory
Hospital admissions data
Satellite imagery—deep
Metadata
Meteorological data
Days included in the study inventory had to fulfil two out of
HYSPLIT models
PM10 and PM2.5
optical depth
three criteria: (i) North African dust plume affecting the study
APA reports
area (whether visible by real colour satellite images or aerosol
Table 1
optical depth layers) had to be noticeable; (ii) the HYSPLIT
Data
backward trajectories had to prove that the air masses carryingInt J Biometeorol
the dust affecting the study area came from North Africa 5 where λi and μi are the urgent hospital admission means for
days prior to the event registered in Central Alentejo; (iii) the 2-day lag and prediction model components, respectively;
daily mean concentration of particulate matter PM10 and Lk(·) and Sk(·) are the corresponding space of lag DF and
PM2.5 had to surpass the established daily mean limits of 50 spline nonlinear effects with k degrees of freedom. The model
μg/m3 for PM10 and 25 μg/m3 for PM2.5. was also adjusted to time and days of the week (DOW). These
last two variables aim to control possible seasonal and trend
Statistical analysis and DLNM modelling variations over the study period that is not related to the
hospitalizations.
In an earlier stage of the research, some exploratory analyses
were developed. One of these focused on the temporal distri-
bution of the events (annual, seasonal and monthly). Seasons Results
were defined according to the solstices of March and
September and equinoxes of June and December. Also, the Characterization of dust intrusion events in Central
statistical characterization of the PM2.5 and PM10 pollutants, Alentejo
including annual, seasonal and monthly mean concentrations,
was performed. To characterize the North African dust intru- Annual, seasonal and monthly distribution
sions, the percentage of days with mean values above the
defined limit (mean and maximum number of hours per day) On an annual scale, according to Fig. 2a, b, a strong interan-
was also assessed. The dust plumes observed through the sat- nual variation is visible. In the APA inventory, it can be ob-
ellite images were delimited, and their areas were calculated. served that 2011 had the most episodes while the year with the
Each plume of the 246 days was delimited and represented fewest was 2015. As for the study inventory, the year with the
seasonally. highest number of dust intrusion days was also 2011while
A statistical summary was built and analyzed for dust in- 2013 was the year with the lowest frequency. The variation
trusion days (identified by APA and by the study inventory) of episodes between seasons and years is irregular, that is, it
and for days without dust intrusions with the meteorological does not have a pattern that suggests a tendency for growth or
and dust concentration variables. With the hospitalization da- decrease over the study period.
ta, an exploratory statistical analysis was also developed. Seasonally (Fig. 2c) and monthly (Fig. 2d), both invento-
To evaluate the possible statistical association between ries exhibit the same behaviour, where summer and its months
emergency hospital admissions and days with dust intrusion, have most episodes and winter with the least.
a DLNM (Distributed Lag Nonlinear Model) was applied.
This method enables us to perceive the immediate effect of a Characterization of dust plumes
phenomenon, as well as the lagged and cumulative effect in
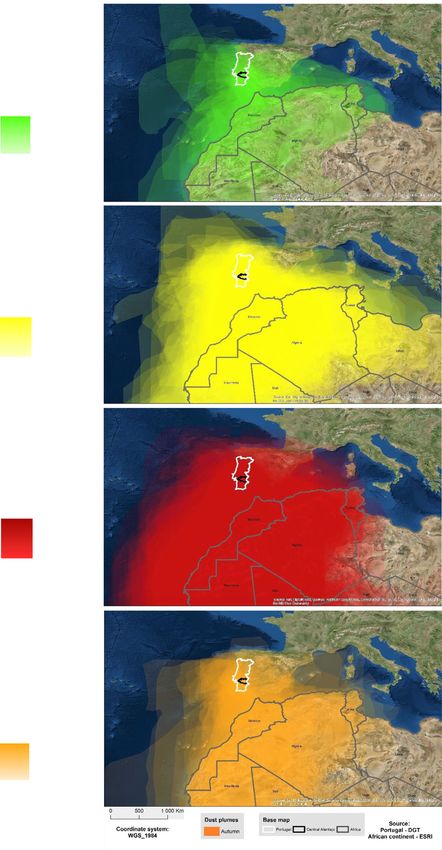
time (Gasparrini et al. 2010; Gasparrini and Armstrong 2011), During winter (Fig. 3), it is noticed that the concentration and
where the description of the associations is defined as dimension of the plumes are lower. However, an area with a
exposure-lag-response (Gasparrini 2018; Gasparrini et al. more pronounced hue is visible between the north-west of
2018). Morocco and the south of Portugal. It is also observed that
The production of a DLNM presupposed two phases. the plumes extend from Mauritania, Algeria and Tunisia and
Firstly, each variable was assessed individually to identify can even reach almost the region of the Azores and the
the combination of degrees of freedom (DF) with the lowest Atlantic to the north-west of mainland Portugal. For this rea-
generalized cross-validation (GCV) values. In case of similar son, through Table 2, it is confirmed by the summed area that
GCV values, the parsimony criterion was applied. Then, the the overlap of plumes is low compared to others, resulting
most significant combination was chosen to proceed to the from the small number of recorded episodes. This season also
next step. In this first phase, the co-variables chosen were has the lowest average and maximum area, revealing that the
the daily average mean temperature and the average daily plumes are spatially limited. In spring (Fig. 3), the situation
concentration of PM10 with 2 DF. Secondly, for the final changes dramatically. In addition to the number of episodes
model, two variables were included to adjust for time and being much higher, the plumes have much larger dimensions
seasonality: “Time” and “Days of the week”. The model is (Table 2). It can be seen through Fig. 3 a great overlap of the
represented by the equations [1] and [2]. plumes among the shown area. Through Table 2, it is possible
to confirm the idea the figure suggests. Therefore, during the
λi ¼ L4 ðtemperaturei Þ þ L4 ðPM10i Þ ð1Þ spring season, the summed area increases by almost sixfold
μi ¼ APA þ S 4 ðtemperaturei Þ þ S 4 ðPM10i Þ compared to winter; however, the average area has only a
slight increase. In summer (Fig. 3), the increase in the length
þ S 211 ðtimeÞ þ DOW ð2Þ of the plumes is even more noticeable. In this season, theInt J Biometeorol
Fig. 2 Annual, seasonal and monthly distribution of dust intrusion to APA inventory, b annual variation according to validation inventory, c
episodes in Central Alentejo, between 2005 and 2015, according to seasonal variation, and d monthly variation
APA inventory and validation inventory. a Annual variation according
overlap of plumes is higher. The plumes thus extend over to the study area roughly. However, the areas of the dust
large areas, not presenting so defined trajectories as those plumes give other indications. According to Table 2, the total
observed in winter, revealing that the plumes are less spatially area, despite being smaller compared to spring by almost half,
limited. the average, minimum and maximum area is higher, that is,
Based on the data presented in Table 2, it is observed that, autumn has fewer episodes than spring, although these same
in relation to summer, the summed area occupied by the episodes include larger areas.
plumes almost doubles compared to spring. The average and
maximum areas of each plume increased significantly, while
the minimum area increased slightly compared to spring. PM concentrations in dust intrusion events
Finally, during autumn (Fig. 3), the intensity of the plumes
and the number of episodes tend to become lower again sug- According to Table 3, only 2 years (2005 and 2008) have
gesting some similarities with winter. There is an area with more than 50% of the days with the average value above the
high overlap between Morocco and the south of Portugal, up limit. During 2006, the North African intrusion days had an
average of 17 h that the permitted values were exceeded
(Table 3). Conversely, in 2009, only 1 h per day on average
Table 2 North African dust plume areas (km2) surpassed the limit. During 2005, 2006 and 2010, at least one
of the days had all hourly values above what is allowed by the
Area Winter Spring Summer Autumn
EU directive for air pollutant concentration. The highest value
Summed ~54,529,660 ~295,057,890 ~545,999,630 ~128,642,970 of PM10 concentration was registered in 2006 (Table 3), and
Mean ~2,726,400 ~3,278,420 ~5,102,800 ~4,435,960 2013 had the lowest value among the maximum recorded.
Minimum ~642,040 ~238,610 ~356,140 ~863,940 As per PM2.5 data, only in 2013 half the days exceed the
Maximum ~5,597,220 ~8,541,150 ~12,387,070 ~10,937,500 threshold as shown in the supplementary material (Table S2).
Regarding the mean and maximum hourly values 2005 andInt J Biometeorol
Winter
Overlap of dust
plumes
High : 20
Low : 1
Spring
Overlap of dust
plumes
High : 90
Low : 1
Summer
Overlap of
plumes
High : 108
Low : 1
Autumn
Overlap of dust
plumes
High : 28
Low : 1
Fig. 3 Overlap of dust plumes for each season of the year (2005–2015 period)Int J Biometeorol
Table 3 Characterization of mean
PM10 concentrations per year, on Year % days ≥ 50 μg/m3 Daily mean hours Maximum daily number Highest value
study inventory days, in Central ≥ 50 μg/m3 of hours ≥ 50 μg/m3 μg/m3
Alentejo. Data source: QualAr–
Terena Rural Background station 2005 88 16 24 230
2006 37 17 24 640
2007 12 15 18 123
2008 55 13 22 193
2009 29 1 16 151
2010 16 12 24 397
2011 32 12 16 224
2012 32 13 21 250
2013 0 - 9 130
2014 11 13 13 266
2015 20 11 16 219
2010 stand out. The highest recorded value registered was in days are higher than on days without dust. Regarding relative
2015. humidity, this variable shows higher values on days without
As for the seasonal analysis (Table 4), it is observed that, dust (63.7%) and lower on days with dust (55.5–54.1%). The
within the four seasons, less than 50% of the days exceed the precipitation and the wind speed do not show significant var-
designated limits. In any case, winter is the season with the iations depending on the presence/absence of dust, although
highest percentage of days above the limit, despite having on study inventory days, the values are slightly lower. As for
fewer episodes as noted before. The highest value occurs also the set of variables of the PM10 and PM2.5, the concentration
in the winter. Spring and summer registered days with 24 h is higher on dusty days, as would be expected.
exceeding the limit. Spring has the highest value, while au- In Central Alentejo, between 2005 and 2015, 7123 individ-
tumn has the lowest value. uals were hospitalized in a total of 8933 urgent hospitaliza-
tions (several individuals with more than one hospitalization),
Statistical association between environmental due to respiratory diseases. In 30.5% of the days, one hospi-
variables and hospital admissions due to respiratory talization per day was observed while, in contrast, in 13.1% of
diseases the days there were five or more hospitalizations (Fig. 4). Of
the total number of urgent admissions, 42.3% were of women
Descriptive analysis and 57.7% were of men (Fig. 4). The elderly are the most
vulnerable age group (Fig. 4). Considering all urgent admis-
The behaviour of the meteorological and dust concentration sions, it is also observed that most of them were mainly due to
variables, according to APA, and the study inventory and the pneumonia (Fig. 5a).
days without dust present slight but important differences as It is observed that hospitalizations due to respiratory dis-
shown in Table 5. eases (Fig. 5b) show a pattern of decrease. Probably due to the
The mean, maximum and minimum average temperatures influence of cold weather on health, the winter registered the
present the lowest values during days without dust (15.9°C, highest number of hospitalizations, while the summer the least
21.9°C and 9.4°C, respectively). In contrast, the study inven- (Fig. 5c). The monthly analysis (Fig. 5d) shows that during
tory days have the highest values (22.4°C, 30.1°C and 14.6°C, winter months, there is a higher percentage of people hospi-
respectively). It should also be noted that the values on APA talized with respiratory problems, with February being the
Table 4 Characterization of mean
PM10 concentrations per season, % days ≥ 50 Daily mean hours ≥ 50 Maximum daily, number of hours Highest value
on study inventory days, in μg/m3 μg/m3 ≥ 50 μg/m3 μg/m3
Central Alentejo. Data source:
QualAr–Terena Rural Winter 45 16 22 244
Background station Spring 30 14 24 640
Summer 32 13 24 397
Autumn 24 11 15 224Int J Biometeorol
most problematic. In contrast, the summer months confirm verify if with a stricter inventory a significantly different result
that during this season, there are less hospitalizations, with would be found. Despite the association between dust intru-
August being the month with less hospitalizations (4.5%). sion days and hospital admissions is not significant (p-value >
0.05) when considering the study inventory, it does not mean
that the identified dust intrusions do not have a hazardous
DLNM modelling of hospitalizations due to respiratory effect on human health. It needs to be highlighted that the dust
diseases and environmental determinants intrusion days from the study inventory are not significant in
the model; however, dust days from APA inventory are.
The result obtained with the DLNM (Fig. 6) shows that the
relative risk of urgent hospitalizations due to respiratory dis-
eases is 12.6% (p-valueInt J Biometeorol
relationship means that after adjustment with the daily
average mean temperature and daily average PM10, the
days with dust intrusion, identified by APA, have a rela-
tive risk of 12.6% more urgent hospitalizations than on
days without dust intrusions. Part of the explanation for
urgent hospital admissions for respiratory diseases in
Central Alentejo is conditioned by these variables.
However, important contributing factors to hospitaliza-
tions were not modelled in this study, such as individual
health behaviour, lifestyle and physiological characteris-
tics. Therefore, this result is liable to change, and further
studies are needed. Nonetheless, the results highlight the
role of dust intrusions as an important health determinant
for respiratory diseases in Alentejo Central.
The results of studies carried out in several countries and
cities in the South of Europe (namely Spain, Italy, Greece and
Cyprus) by authors such as Alessandrini et al. (2013), Díaz
et al. (2012), Jiménez et al. (2010), Mallone et al. (2011),
Middleton et al. (2008), Neophytou et al. (2013), Pérez et al.
Fig. 4 Hospitalizations in Central Alentejo (2005–2015): a) frequency of
hospitalizations per day due to respiratory diseases, b) hospitalizations by (2008, 2012), Reyes et al. (2014), Sajani et al. (2011), Samoli
gender, and c) hospitalizations by group age et al. (2011a, 2011b), Stafoggia et al. (2016) and Tobías et al.
(2011) are aligned with ours and demonstrate that Saharan
association between urgent hospital admissions due to re- dust intrusion events have a statistical association with an
spiratory afflictions and dust intrusions. This statistical increase in hospitalizations and mortality from cardiac,
Fig. 5 Hospitalizations in Central Alentejo (2005–2015): a) total number of hospitalizations per respiratory disease, b) hospitalizations by year, c)
hospitalizations by season, and d) hospitalizations by monthInt J Biometeorol
Fig. 6 Boxplot of the relative risk 1.30
of urgent hospitalizations due to
the intrusion of dust in Central
1.20
Alentejo, according to the study
inventories, with confidence
1.10
intervals
1.00
RR
0.90
0.80
0.70
0.60
APA inventory filtered inventory
respiratory and even cerebrovascular causes, particularly et al. 2013) and yet, with plumes with higher concentrations
among the elderly age group. compared to other seasons (Cachorro et al. 2006; Pey et al.
Through the statistical summary, it is also noticed that gener- 2013). Within winter, the least active period is November and
ally in the Évora’s hospital, there is in most days an urgent December (Escudero et al. 2005; Knippertz and Todd 2012).
hospitalization per day due to respiratory pathologies. On the In fact, the results confirm exactly this situation, in which the
other hand, it was also found that men register more hospitaliza- winter is the season where fewer episodes are observed in the
tions than women. As for the age group, the elderly (65 years old Central Alentejo. Within this period, the months with the least
or more) are more vulnerable than young people (less than 17 activity are November, December and January. The present
years old) as shown in the results. It is also mentioned by Griffin study also confirmed that the frequency and dimension of the
and Kellogg (2004), Jiménez et al. (2010), Sajani et al. (2011) plumes in the set of episodes during the winter months are
and Samoli et al. 2011a, 2011b) that the elderly age group is the lower, with plumes of dust that, in terms of average and max-
most affected. The urgent hospitalizations are commonly due to imum area, have lower values compared to other seasons.
pneumonia. The impact of dust intrusions in the increase of these Despite this, the PM10 daily average concentration indicates
diseases have already been mentioned by Goudie (2014) and that, during winter, the legal limit is exceeded in 45% of the
UNEP et al. (2016) in the case of pneumonia and by days. Although the objective of this work is not to explain this
Brunekreef and Holgate (2002), Chien et al. (2014), Goudie phenomenon, we can present some factors that may help to
and Middleton (2006) and Middleton (2017) in the case of ob- explain it, for example, there is a higher concentration of par-
structive pulmonary diseases. On the other hand, the less com- ticles during the winter, because the area occupied by the
mon diseases that cause urgent hospitalizations are rhinitis, plumes are more restricted; it may also be explained by other
pneumoconiosis and infections in the upper part of the factors such as atmospheric boundary layer height.
respiratory system. The influence of dust events on rhinitis and The spring is the second season with the most episodes and
respiratory system infections was identified by Goudie (2014) urgent hospitalizations. In terms of its months, according to
and UNEP et al. (2016). the APA inventory, June is part of the top 3 months with the
According to the data analyzed, during winter there are most episodes. According to the study inventory, there are 2
more hospitalizations compared to other seasons, although months in this season that are part of the top three with more
the emission and intrusion of dust into the atmosphere are episodes, April and June. In fact, as suggested by Escudero
lower (Cachorro et al. 2006; Pey et al. 2013; Querol et al. et al. (2005), the months when more dust intrusions are ob-
2010). This might be explained by some factors such as cold served are between May and August. Knippertz and Todd
temperatures and energy poverty. Some studies such as (2012) mention September as the limit instead of August.
Almendra et al. (2019a), Almendra et al. (2019b), Silva Escudero et al. (2005) state that April is a month with very
(2015) and Vasconcelos et al. (2013) focused on this associa- few episodes, although in the study inventory, this month was
tion and found important results. The emission of dust during well represented. As for urgent hospitalizations during this
the winter is associated with very severe storms with the pres- season, April registered the highest value. As for the dust
ence of cumulonimbus and vertical movements in the atmo- plumes identified in this season, they increased in number
sphere (Goudie and Middleton 2006). Therefore, winter’s ep- and their dimensions are also larger. Cachorro et al. (2006)
isodes affecting the Iberian Peninsula (Querol et al. 2010) are state that during spring, the dust plumes begin to be more
infrequent and do not last very long (Cachorro et al. 2006; Pey extensive and diluted (not as much as in the summer). ThisInt J Biometeorol
argument is validated through the plume areas shown. Thus, analysis, there was no visible trend of either increasing or de-
they covered 6 times more area than in winter, with the aver- creasing, although Goudie and Middleton (2006) mention that
age plume area increasing by about one million square North Africa has shown a trend of increasing particle emissions
kilometres. As for the concentration of PM10 particles, only for the atmosphere.
30% of the days recorded in this period had daily average
values above the permitted, while PM2.5 had only 9%.
As for hospitalizations in the summer, there are fewer hospi-
talizations. However, it is during summer that the greatest num- Conclusion
ber of episodes occurred (Prospero 1996; Goudie and Middleton
2001; Engelstaedter et al. 2006; Marconi et al. 2014), which are The relative risk of urgent hospitalizations due to respiratory
due to the strong emissions of particles into the atmosphere diseases in Central Alentejo is 12.6% higher during Saharan dust
caused by movement of the Intertropical Convergence Zone to intrusion days. Despite the limitations of this study, the results
the north, which allows the injection of dust in the free atmo- show the role of dust intrusions as an important health determi-
sphere and which is later transported with greater intensity to the nant for respiratory diseases in Alentejo highlighting the public
Iberian Peninsula, the Mediterranean and also to the Atlantic health need to address this factor. It has also been found that there
Ocean (Querol et al. 2010). Summer is, in fact, the season with are more hospitalizations in winter. This can be explained by
most episodes, according to both inventories. Regarding the climatic conditions, namely the temperature, and other factors
months, the most active are between May and August such as individual health behaviour, lifestyle, human physiology,
(Escudero et al. 2005) or between May and September higher levels of pollution or energy poverty. Thus, although there
(Knippertz and Todd 2012). According to the APA inventory, are more hospitalizations in winter, it also has fewer episodes of
the month with the most episodes is July, followed by August, dust intrusion. Despite the smaller number of episodes, in 45% of
while according to the study inventory, the most active month is them, an average daily value of PM10 surpassed the limit value
August, followed by September. As for hospitalizations in these imposed by the EU directive. Thus, in winter, dust may influence
months, it is noted that there are fewer hospitalizations in August. urgent hospitalizations by worsening air quality and aggravating
The overlap of plumes during the summer is quite noticeable, prevalent respiratory pathologies. During summer, the opposite
due to the large number of episodes, doubling its occupied area was shown. There are more intrusion events, although the per-
compared to spring. The average, maximum and minimum areas centage of days with mean PM10 above the limit was lower. One
of the plumes increased in summer. According to Cachorro et al. of the reasons for this may be due to the bigger extension of dust
(2006) and similarly to what was referred to for spring, during plumes, hence less concentration of particles.
this season, there are very extensive and less concentrated This study aims to boost other studies regarding the occur-
plumes. Regarding the concentration of PM10 particles, only rence of these phenomena in Portugal and their effects on
32% of the study inventory days had daily averages above the human health, namely in terms of hospitalizations or mortal-
limit. August registers half of the days above the limit. As for ity, since in other southern European countries, this research
PM2.5, the percentage of days in excess of the legal limit value is topic is much more developed.
very low. To conclude, it must be stressed that it is very important to
As for the hospitalizations during autumn, it is the second continue to monitor, predict and study the occurrence of Saharan
season with fewer hospitalizations. As for the emission of dust dust intrusions in Portugal, to prevent the harmful effects of air
at this time of year, it starts to become less intense, especially in quality deterioration. This is particularly relevant to ensure that
late autumn, which is already weak (Querol et al. 2010). Thus, the population, especially the most vulnerable age groups (>65
the results of the present investigation demonstrate that the au- years), are prepared for the occurrence of these events. It is im-
tumn is the third season with most episodes which is in agree- perative that studies in Portugal on this subject should be further
ment with Cachorro et al. (2006). The number of episodes during developed, not only on its effects on health and mortality, but
this period is mainly distributed between September and October also on soils and agriculture, in order to mitigate the human and
(during the autumn days), decreasing to very low values, after- the environmental impacts of dust intrusions.
wards. The number of hospitalizations is higher in November,
with signs of an increase as winter approaches. As for the
plumes, they are more intense but in less quantity (Cachorro
et al. 2006; Pey et al. 2013). This is confirmed by the plumes, Supplementary Information The online version contains supplementary
representing fewer episodes. However, their areas give other material available at https://doi.org/10.1007/s00484-021-02132-x.
indications considering that the medium, minimum and maxi-
mum areas show that they individually occupy larger areas. As Acknowledgements This study stems from the project “Saharan dust
for the particle’s concentrations, autumn has the lowest percent- events and impacts on health in Portugal and Morocco
(GEOSAHARA)”, Programme for Cooperation in Science between
age. Regarding the frequency of episodes over the years ofInt J Biometeorol
Portugal and Morocco (2019/2020). The research was also funded by in Madrid (Spain). Environmental Health : A Global Access Science
ZEPHYRUS/CEG/IGOT—Universidade de Lisboa (UIDB/00295/2020 Source 11(11):1–6. https://doi.org/10.1186/1476-069X-11-11
and UIDP/00295/2020). Díaz J, Linares C, Carmona R, Russo A, Ortiz C, Salvador P, Trigo RM
(2017) Saharan dust intrusions in Spain: health impacts and associ-
ated synoptic conditions. Environ Res 156:455–467. https://doi.org/
10.1016/j.envres.2017.03.047
Engelstaedter S, Tegen I, Washington R (2006) North African dust emis-
sions and transport. Earth Sci Rev 79(1–2):73–100. https://doi.org/
10.1016/j.earscirev.2006.06.004
Open Access This article is licensed under a Creative Commons Escudero M, Castillo S, Querol X, Avila A, Alarcón M, Viana MM et al
Attribution 4.0 International License, which permits use, sharing, adap- (2005) Wet and dry African dust episodes over eastern Spain.
tation, distribution and reproduction in any medium or format, as long as Journal of Geophysical Research D: Atmospheres 110(18):1–15.
you give appropriate credit to the original author(s) and the source, pro- https://doi.org/10.1029/2004JD004731
vide a link to the Creative Commons licence, and indicate if changes were Gasparrini, A. (2018). Distributed lag non-linear models in R: the pack-
made. The images or other third party material in this article are included age dlnm, 1–11. Retrieved from https://cran.r-project.org/web/
in the article's Creative Commons licence, unless indicated otherwise in a packages/dlnm/index.html
credit line to the material. If material is not included in the article's Gasparrini A, Armstrong B (2011) The impact of heat waves on mortal-
Creative Commons licence and your intended use is not permitted by ity. Epidemiology 22(1):68–73. https://doi.org/10.1097/EDE.
statutory regulation or exceeds the permitted use, you will need to obtain 0b013e3181fdcd99
permission directly from the copyright holder. To view a copy of this Gasparrini A, Armstrong B, Kenward M (2010) Distributed lag non-
licence, visit http://creativecommons.org/licenses/by/4.0/. linear models. Stat Med 29(21):2224–2234. https://doi.org/10.
1002/sim.3940
Gasparrini, A, Armstrong, B., & Scheipl, F. (2018). Distributed lag non-
linear models, 1–54. Retrieved from https://cran.r-project.org/web/
References packages/dlnm/dlnm.pdf
Goudie A (2014) Desert dust and human health disorders. Environ Int 63:
Alessandrini E, Stafoggia M, Faustini A, Gobbi G, Forastiere F (2013) 101–113. https://doi.org/10.1016/j.envint.2013.10.011
Saharan dust and the association between particulate matter and Goudie A, Middleton N (2001) Saharan dust storms: nature and conse-
daily hospitalisations in Rome, Italy. Occup Environ Med 70(6): quences. Earth Sci Rev 56(1–4):179–204. https://doi.org/10.1016/
432–434 Retrieved from http://oem.bmj.com/content/70/6/432. S0012-8252(01)00067-8
abstract Goudie, A., & Middleton, N. (2006). Desert dust in the global system. (D.
Almendra R, Perelman J, Vasconcelos J, Santana P (2019a) Excess win- Czeschlik & A. Schlitzberger, Eds.). Springer. https://doi.org/10.
ter mortality and morbidity before, during, and after the Great 1007/3-540-32355-4
Recession: the Portuguese case. Int J Biometeorol 63(7):873–883. Griffin D, Kellogg C (2004) Dust storms and their impact on ocean and
https://doi.org/10.1007/s00484-019-01700-6 human health: dust in Earth’s atmosphere. EcoHealth 1:284–295.
Almendra R, Santana P, Mitsakou C, Heaviside C, Samoli E, https://doi.org/10.1007/s10393-004-0120-8
Rodopoulou S, Katsouyanni K, Vardoulakis S (2019b) Cold- Griffin D, Kellogg C, Garrison V, Shinn E (2002) The global transport of
related mortality in three European metropolitan areas: Athens, dust. Am Sci 90(3):228–235. https://doi.org/10.1511/2002.3.228
Lisbon and London. Implications for health promotion. Urban Gyan K, Henry W, Lacaille S, Laloo A, Lamsee-Ebanks C, McKay S,
Clim 30:1–9. https://doi.org/10.1016/j.uclim.2019.100532 Antoine RM, Monteil MA (2005) African dust clouds are associated
Brunekreef B, Forsberg B (2005) Epidemiological evidence of effects of with increased paediatric asthma accident and emergency admis-
coarse airborne particles on health. Eur Respir J 26(2):309–318. sions on the Caribbean island of Trinidad. Int J Biometeorol 49(6):
https://doi.org/10.1183/09031936.05.00001805 371–376. https://doi.org/10.1007/s00484-005-0257-3
Brunekreef B, Holgate ST (2002) Air polution and health. Lancet 360: INE. (2018). População residente (N.o) por Local de residência (NUTS -
1233–1242. https://doi.org/10.1016/S0140-6736(01)92649-2 2013) Alentejo Central. Retrieved March 20, 2019, from https://
Cachorro V, Vergaz R, Frutos A, Vilaplana J, Henriques D, Laulainen N, www.ine.pt/xportal/xmain?xpid=INE&xpgid=ine_
Toledano C (2006) Study of desert dust events over the southwest- indicadores&contecto=pi&indOcorrCod=0008273&selTab=tab0
ern Iberian Peninsula in year 2000: two case studies. Annales Jiménez E, Linares C, Martínez D, Díaz J (2010) Role of Saharan dust in
Geophysicae, European Geosciences Union 24(6):1493–1510 the relationship between particulate matter and short-term daily mor-
Chien L, Yang C, Yu H (2012) Estimated effects of Asian dust storms on tality among the elderly in Madrid (Spain). Sci Total Environ
spatiotemporal distributions of clinic visits for respiratory diseases in 408(23):5729–5736. https://doi.org/10.1016/j.scitotenv.2010.08.
Taipei children (Taiwan). Environ Health Perspect 120(8):1215– 049
1220. https://doi.org/10.1289/ehp.1104417 Knippertz P, Todd M (2012) Mineral dust aerosols over the Sahara:
Chien L, Lien Y, Yang C, Yu H (2014) Acute increase of children’s meteorological controls on emission and transport and implications
conjunctivitis clinic visits by Asian dust storms exposure - a spatio- for modeling. Rev Geophys 50(1):1–94. https://doi.org/10.1029/
temporal study in Taipei, Taiwan. PLoS One 9(10):1–10. https://doi. 2011RG000362
org/10.1371/journal.pone.0109175 Linares C, Sánchez-Martínez G, Díaz J (2020) ¿Es mayor en España el
Couto F, Cardoso E, Costa M, Salgado R, Guerrero-Rascado J, Salgueiro impacto de la contaminación atmosférica química sobre la
V (2021) How a mesoscale cyclonic vortex over Sahara leads to a mortalidad atribuible por causas respiratorias o por causas
dust outbreak in South-western Iberia. Atmos Res 249:1–13. https:// circulatorias? Arch Bronconeumol 56(9):543–544. https://doi.org/
doi.org/10.1016/j.atmosres.2020.105302 10.1016/j.arbr.2019.11.014
Díaz J, Tobías A, Linares C (2012) Saharan dust and association between Mallone S, Stafoggia M, Faustini A, Gobbi G, Marconi A, Forastiere F
particulate matter and case-specific mortality: a case-crossover analysis (2011) Saharan dust and associations between particulate matter andInt J Biometeorol
daily mortality in Rome, Italy. Environ Health Perspect 119(10): (Italy). Occup Environ Med 68(6):446–451. https://doi.org/10.1136/
1409–1414 oem.2010.058156
Marconi M, Sferlazzo D, Becagli S, Bommarito C, Calzolai G, Chiari M, Salvador P, Artíñano B, Molero F, Viana M, Pey J, Alastuey A, Querol X
Di Sarra A, Ghedini C, Gómez-Amo J, Lucarelli F, Meloni D, (2013) African dust contribution to ambient aerosol levels across
Monteleone F, Nava S, Pace G, Piacentino S, Rugi F, Severi M, central Spain: characterization of long-range transport episodes of
Traversi R, Udisti R (2014) Saharan dust aerosol over the desert dust. Atmos Res 127:117–129. https://doi.org/10.1016/j.
centralMediterranean Sea: PM10 chemical composition and concen- atmosres.2011.12.011
tration versus optical columnar measurements. Atmospheric Chem Samoli E, Nastos P, Paliatsos A, Katsouyanni K, Priftis K (2011a) Acute
Phys 14(4):2039–2054. https://doi.org/10.5194/acp-14-2039-2014 effects of air pollution on pediatric asthma exacerbation: evidence of
Middleton N (2017) Desert dust hazards: a global review. Aeolian Res association and effect modification. Environ Res 111(3):418–424.
24:53–63. https://doi.org/10.1016/j.aeolia.2016.12.001 https://doi.org/10.1016/j.envres.2011.01.014
Middleton N, Yiallouros P, Kleanthous S, Kolokotroni O, Schwartz J, Samoli E, Kougea E, Kassomenos P, Analitis A, Katsouyanni K (2011b)
Dockery D et al (2008) A 10-year time-series analysis of respiratory Does the presence of desert dust modify the effect of PM10on mor-
and cardiovascular morbidity in Nicosia, Cyprus: the effect of short- tality in Athens, Greece? Sci Total Environ 409(11):2049–2054.
term changes in air pollution and dust storms. Environmental https://doi.org/10.1016/j.scitotenv.2011.02.031
Health: A Global Access Science Source 7(39):1–16. https://doi. Silva, S. (2015). Modelação do efeito do frio extremo na saúde da
org/10.1186/1476-069X-7-39 população de Lisboa: contributos para um sistema de vigilância e
Neophytou A, Yiallouros P, Coull B, Kleanthous S, Pavlou P, Pashiardis alerta. Universidade de Lisboa. Retrieved from http://repositorio.
S et al (2013) Particulate matter concentrations during desert dust insa.pt/bitstream/10400.18/3767/2/Modelação do efeito do frio
outbreaks and daily mortality in Nicosia, Cyprus. Journal Of extremo na saúde da população de Lisboa.pdf
Exposure Science And Environmental Epidemiology 23:275
Sousa P, Barriopedro D, Ramos A, García-herrera R (2019) Saharan air
Retrieved from. https://doi.org/10.1038/jes.2013.10
intrusions as a relevant mechanism for Iberian heatwaves: the record
Ortiz C, Linares C, Carmona R, Díaz J (2017) Evaluation of short-term
breaking events of August 2018 and June 2019. Weather and
mortality attributable to particulate matter pollution in Spain.
Climate. Extremes 26:1–13. https://doi.org/10.1016/j.wace.2019.
Environ Pollut 224:541–551
100224
Pérez L, Tobias A, Querol X, Künzli N, Pey J, Alastuey A et al (2008)
Coarse particles from Saharan dust and daily mortality. Stafoggia M, Samoli E, Alessandrini E, Cadum E, Ostro B, Berti G et al
Epidemiology 19(6):800–807. https://doi.org/10.1097/EDE. (2013) Short-term associations between fine and coarse particulate
0b013e31818131cf matter and hospitalizations in Southern Europe: results from the
Pérez L, Tobías A, Querol X, Pey J, Alastuey A, Díaz J, Sunyer J (2012) MED-PARTICLES project. Environ Health Perspect 121(9):
Saharan dust, particulate matter and cause-specific mortality: a case- 1026–1033. https://doi.org/10.1289/ehp.1206151
crossover study in Barcelona (Spain). Environ Int 48:150–155. Stafoggia M, Zauli-Sajani S, Pey J, Samoli E, Alessandrini E, Basagaña
https://doi.org/10.1016/j.envint.2012.07.001 X et al (2016) Desert dust outbreaks in Southern Europe: contribu-
Pey J, Querol X, Alastuey A, Forastiere F, Stafoggia M (2013) African tion to daily PM10 concentrations and short-term associations with
dust outbreaks over the Mediterranean Basin during 2001-2011: mortality and hospital admissions. Environ Health Perspect 124(4):
PM10 concentrations, phenomenology and trends, and its relation 413–419. https://doi.org/10.1289/ehp.1409164
with synoptic and mesoscale meteorology. Atmos Chem Phys Stein A, Draxler R, Rolph G, Stunder B, Cohen M, Ngan F (2015)
13(3):1395–1410. https://doi.org/10.5194/acp-13-1395-2013 NOAA’s HYSPLIT atmospheric transport and dispersion modeling
PIAAC-AC. (2018). O Plano Intermunicipal de Adaptação às Alterações system. Bull Am Meteorol Soc 96(12):2059–2077. https://doi.org/
Climáticas do Alentejo Central. Prevenção e Planeamento. 10.1175/BAMS-D-14-00110.1
Querol, X., Alastuey, A., Pey, J., Escudero, M., Castillo, S., Gonzalez Tobías A, Pérez L, Díaz J, Linares C, Pey J, Alastruey A, Querol X
Ortiz, A., … de la Rosa, J. (2010). Methodology for the identifica- (2011) Short-term effects of particulate matter on total mortality
tion of natural episodes in PM10 and PM2.5, and justification with during Saharan dust outbreaks: a case-crossover analysis in
regards to the exceedances of the pm10 daily limit value. Barcelona. Madrid (Spain). Sci Total Environ 412–413:386–389. https://doi.
Reyes M, Díaz J, Tobias A, Montero J, Linares C (2014) Impact of org/10.1016/j.scitotenv.2011.10.027
Saharan dust particles on hospital admissions in Madrid (Spain). UNEP, WMO, & UNCCD. (2016). Global assessment of sand and dust
Int J Environ Health Res 24(1):63–72. https://doi.org/10.1080/ storms. (United Nations Environment Programme, Ed.). Nairobi:
09603123.2013.782604 UNEP. Retrieved from http://library.wmo.int/opac/index.php?lvl=
Russo A, Sousa P, Durão R, Ramos A, Salvador P, Linares C et al (2020) notice_display&id=19638#.WCll6IVOIaE
Saharan dust intrusions in the Iberian Peninsula: predominant syn- Vasconcelos J, Freire E, Almendra R, Silva G, Santana P (2013) The
optic conditions. Sci Total Environ 717:137041. https://doi.org/10. impact of winter cold weather on acute myocardial infarctions in
1016/j.scitotenv.2020.137041 Portugal. Environ Pollut 183:14–18. https://doi.org/10.1016/j.
Sajani S, Miglio R, Bonasoni P, Cristofanelli P, Marinoni A, Sartini C envpol.2013.01.037
et al (2011) Saharan dust and daily mortality in Emilia-RomagnaYou can also read