Q1 2018 Investor Presentation - Amazon S3
←
→
Page content transcription
If your browser does not render page correctly, please read the page content below
Q1 2018 Investor Presentation
AGENDA

                                                                            Operational
       SODIC: Egypt’s                              Our
                                                                            & Financial                    Appendices
     Leading Developer                           Strategy
                                                                             Highlights

 •    Demand drivers for property     •   Forward Strategy            •   Performance Overview        •   Projects Portfolio
      in Egypt                        •   Prime Land Bank & Diverse   •   Project Profitability       •   Additional Information
 •    SODIC At a Glance                   Portfolio                   •   Delivery & Execution
 •    Our Unique Value Proposition                                    •   1Q18 – Results Highlights

              Q1 2018 Investor Presentation                                                                                        2
SODIC: Egypt’s
Leading Developer

                    3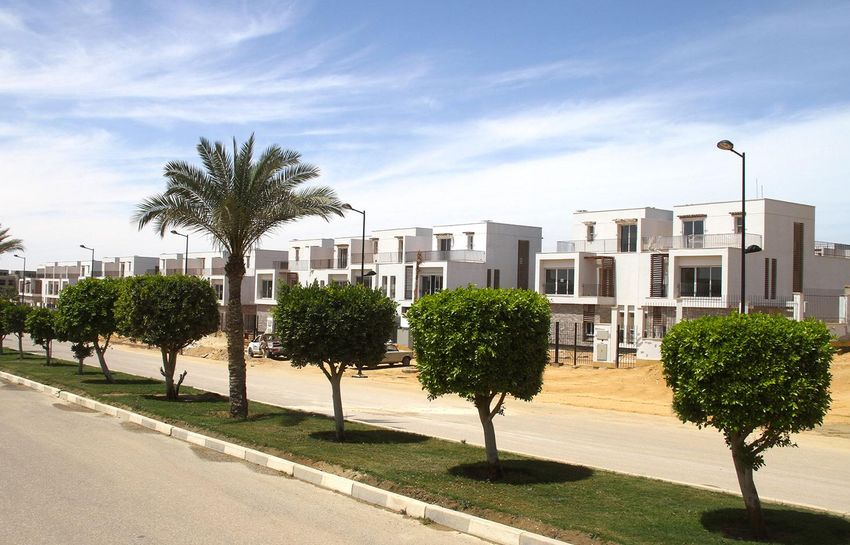
Demand drivers for residential real estate in new urban communities
Demographics Real demand backed by demographics
At 96mn the population is the largest in the region
01
Young population 70% under 35
936,000 marriages a year
2% population growth
Housing gap of 3 million units
SODIC estimates that its addressable upper middle income market accounts for 10%-15% of the population
Consumer Favoring gated communities in new cities
02
Quality of life and a secure gated community is driving tenants from the densely populated city center
preference East & West Cairo are autonomous satellite cities offering their residents all the amenities needed
With most of the organized office space as well as new school and university campuses located in these new
cities, these suburbs have become the destination of choice for most new home buyers
With most developers offering payment plans and in the absence of the mortgage market, off plan
purchases appeal to most buyers
Investment Healthy and predominantly non-speculative
Demand Demand continues post devaluation and despite high interest rates
03
Investment in real estate as an inflation hedge is a long term trend and deeply rooted in our culture
A familiar and tangible investment
Cultural norms: Parents often buying property for second generation tenants
With rental yields at 5-7% and historical property appreciation on SODIC developments estimated at 20-30%
annually, real estate has historically delivered attractive returns
Q1 2018 Investor Presentation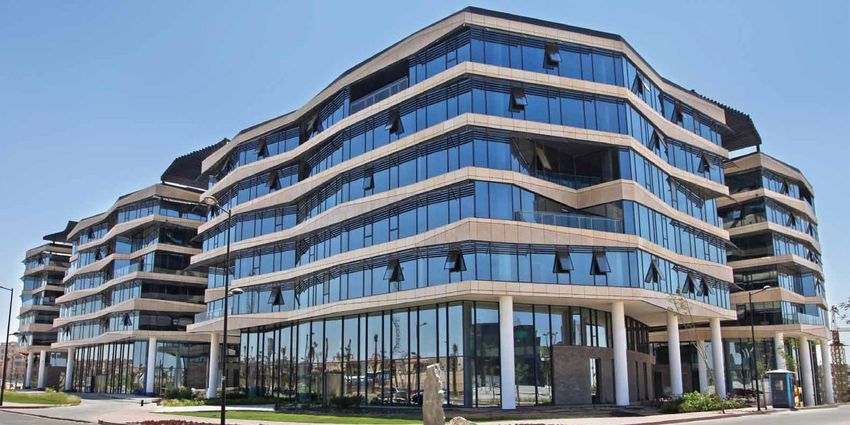
SODIC is at the Forefront of the Egyptian Real Estate Market
With a proven history of success in Egypt, SODIC is focused on expansion and growth
Brief Overview Key Highlights¹
Building on a history of over two decades of successful
operations in Egypt, SODIC is one of the country’s leading real Over 20 years of 17 projects
estate development companies, bringing to the market award-
operation launched
winning large scale developments to meet Egypt’s ever-growing
need for high quality housing, commercial and retail spaces.
Headquartered in Cairo and listed on the Egyptian stock
exchange (EGX), SODIC is one of the few non-family owned
Over 7 mn sqm over EGP 29bn
companies traded on the EGX, with a strong corporate Contracted Sales
governance framework. of land developed
c.13,000 units
Having invested in sixteen diverse real estate projects, SODIC
boasts a portfolio that has contributed more than 3 million
square meters of built-up area to Cairo’s new urban
communities¹. Over 8,000 5.8 mn sqm
Delivered Units Non-launched & Raw Land Bank2
90-95bn
1 SinceInception & including Beverly Hills
2As of 31st of March 2018 and includes owned land as well land to be developed under revenue share EGP
agreement s
Expected Sales from Non-Launched and Raw Land Bank
Q1 2018 Investor Presentation 5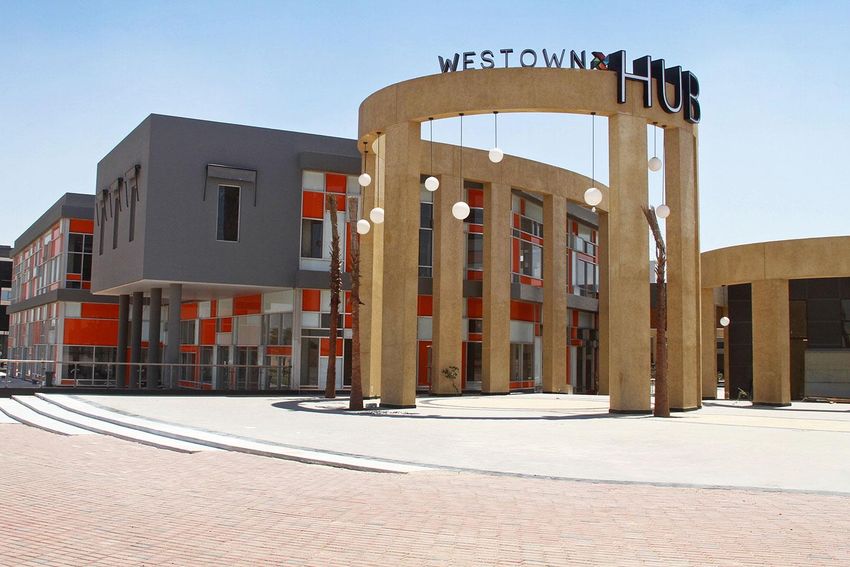
Our Unique Value Proposition

SODIC’s established brand, performance record and healthy financial position provide the perfect backdrop
for sustainable growth

            Significant Brand Equity                      Track Record & Management                              Scalable Operation

 •       Strong demand for SODIC products             •    Full cycle experience: Successful           • Significant in-house capacity with a team
 •       Pricing at a premium to the market                navigation through the downturn               of more than 650 professionals
 •       Reputation of timely deliveries              •    Strong operational performance &            • Ability to acquire and execute sizable
 •       Access to partnership deals through our           resilient financial results                   plots
         strong brand and ability to monetize land    •    16 successfully launched projects           • Capacity to raise the required funding to
                                                                                                         secure timely execution
                                                                                                       • Strong relationship with suppliers

                                                            Solid Growth Strategy
     •      Sales pipeline: EGP 90-95bn                                     •    Diversify locations: coastal and secondary cities
     •      Expand land bank: acquisitions and/or revenue share deals       •    Build up recurring income portfolio

                      Q1 2018 Investor Presentation                                                                                                  6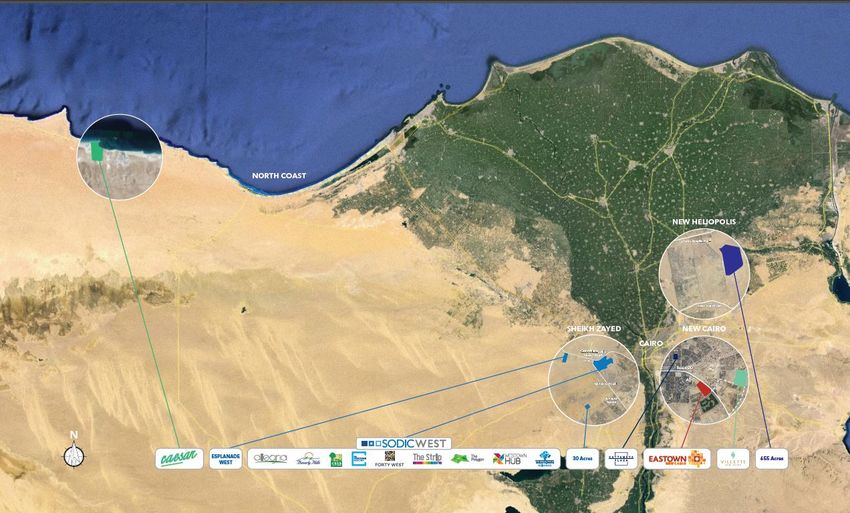
Our Strategy

               7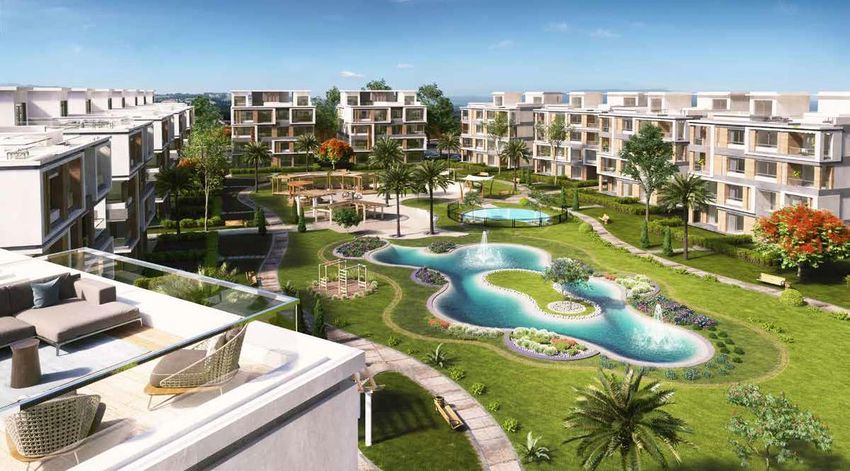
Forward Strategy

Against this backdrop — and with proven brand equity, performance and financial strength — SODIC is focused
on growth and expansion

                        •   Execution of EGP 90-95 bn worth of unlaunched inventory
  Execute existing      •   Deliver some 17,000 units from both sold and unlaunched inventory
      pipeline          •   Collect EGP 11.3 bn of receivables on existing sales while maintaining a collection ratio above 93%
                        •   Increase allowable foot print and monetize Al Yosr plot (300 acres in West Cairo)

                        • Locations of interest include:
                               • New, growing urban communities (East & West of Cairo)
      Expand                   • Second homes on coastal cities (significant cross selling opportunity & mitigating our current seasonality of primary
                                  homes sales)
     land bank                 • Secondary cities offering untapped opportunities in Egypt
                        • Explore joint ventures, co-development and other asset-light structures as a means to expand operations with a less capital
                          intensive approach

     Build up           • Gradual build up of our recurring income portfolio, targeting EGP 450 million of revenues
 recurring income       • Leverage our existing property and facility management company EDARA and further develop its expertise

  Other long-term       • Monetize Syria land (completely written off the balance sheet)
  upside potential

            Q1 2018 Investor Presentation                                                                                                                8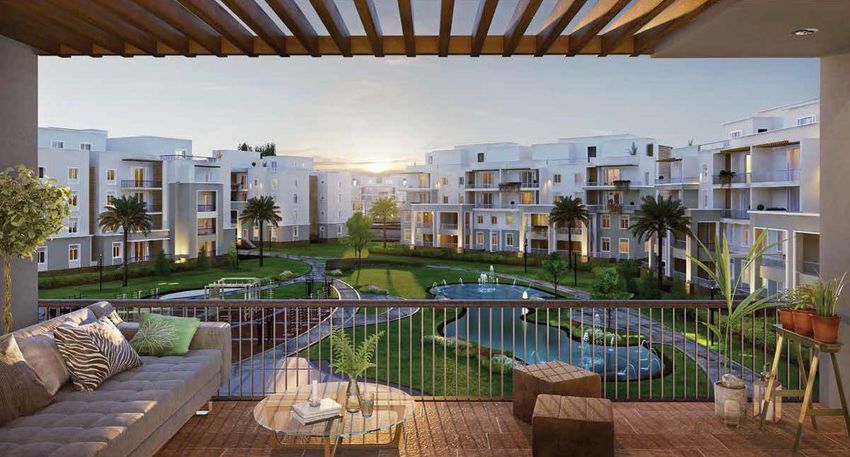
Prime Land Bank & Diverse Portfolio of Live Communities

With 5.8 mn
sqm of
unutilized land,
SODIC is
expected to
bring to the
market EGP 90
to 95bn1 of
inventory over
the coming 10
years from its
existing land
bank

    1   Includes estimated sales of over EGP 58 billion from the co-development agreement with Heliopolis Housing

                     Q1 2018 Investor Presentation                                                                  9
A Diversified Portfolio of Live Communities¹

                                       Residential      Upper Middle      Integrated         High-end                                            Retail stretch
                 Project                                                                                   Various Types of
                                      Single Family    Class Apartment mixed-use office     Apartments                       Residential Units       mall
                 description                                                                               Residential Units
                                          Units            Buildings          park

                 Gross land area
                                           2,428,283           126,000             54,727         52,934            584,331           725,813*             157,872
                 Gross BUA                   575,325           123,733             85,124         72,220            344,664           611,008               35,004
                 Launched as a
                 pct of project           100%
                                          100%              100%
                                                            100%             100%
                                                                             100%              100%
                                                                                              100%               100%
                                                                                                                100%               93%
                                                                                                                                   93%                67%
                                                                                                                                                     67%
                 gross land area

                 Value sold as a          99%               100%                               89%              100%               96%               100%
                                          99%               100%             94%
                                                                           94%
                                                                                               89%               100%               96%              100%
                 pct of launched

                                                                                 54%
                 Delivery                 96%
                                          96%               99%
                                                            99%              54%               57%
                                                                                               57%               99%
                                                                                                                99%                36%               100%
                                                                                                                                                    100%
                                                                                                                                   36%

                 Execution                94%
                                          94%               100%
                                                            100%             90%
                                                                             90%               82%
                                                                                               82%              99%
                                                                                                                99%                 50%              100%
                                                                                                                                                     100%
                                                                                                                                   50%

                 * Residential component excludes land allocated for commercial development

1 As   of 31st of March 2018

                            Q1 2018 Investor Presentation                                                                                                            10
A Diversified Portfolio of Live Communities¹
Entertainment Residential Upper Middle Secondary Homes Residential
Project Residential Multi Residential Multi
retail complex Single & Multi Class Apartment Stand-Alone & Single Family
description Family Units Family Units
Family Units and duplexes Chalets Units
Gross land area
50,090 1,055,515* 237,594 441,000 130,158 35,293 263,678
Gross BUA 13,254 628,381 164,637 103,241 126,564 22,865 99,638
Launched as a
pct of project 100%
100% 83%
83% 100% 1.00 100% 1.00 50% 0.50 100% 1.00 10% 0.10
gross land area
Value sold as a 59%
100% Leasable 69%
69% 100%
100% 86%
86% 59% 89%
89% 88%
88%
pct of launched
Operational Delivery starting Delivery starting Delivery starting Delivery starting Delivery starting
Delivery 26%
since 2Q15 2018 2018 2020 2020 2021
20%
Execution 99%
99% 27%
27% 75%
75% 58%
58% 16%
16% 20% 0%
0%
* Residential component excludes land allocated for commercial development
1 As of 31st of March 2018
Q1 2018 Investor Presentation 11Land Bank & Portfolio¹
A solid land bank providing strong sales visibility
Land Utilization Unlaunched & Raw Land Unlaunched & Raw Land
9%
26% 22%
22%
32%
14.3 5.9 mn 5.9 mn
mn sqm 59% sqm 16% sqm 62%
52%
Launched Unlaunched Raw West Cairo East Cairo North Coast Residential Retail & Commercial Secondary Homes
West Cairo Total Land Bank East Cairo Total Land Bank North Coast Total Land Bank
7.6mn sqm 5.0mn sqm 1,715k sqm
1. Launched Projects Land Area 2. Unlaunched Projects Land Area 1. Launched Projects Land Area 2. Unlaunched Projects Land Area 1. Launched Projects Land Area
Allegria 2,428k sqm Westown Residential 48k sqm Eastown Residences 674k sqm Eastown Residences 52k sqm Caesar 441k sqm
Forty West 53k sqm Westown Retail/ Commercial 72k sqm Kattameya Plaza 126k sqm Eastown Retail/ Commercial 127k sqm Total Launched Projects 441k sqm
Westown Residences 584k sqm The Strip Phase II 52k sqm Villette Residential 875k sqm Villette Residential 181k sqm
The Polygon 55k sqm October Plaza 65k sqm SODIC East 264k sqm Villette Retail/ Commercial 211k sqm 2. Raw Land Land Area
The Strip 106k sqm Total Unlaunched Projects 237k sqm Total Launched Projects 1,938k sqm SODIC East Residential 2,044k sqm New 300 acre plot 1,274k sqm
The Courtyards 238k sqm SODIC East Commercial 450k sqm Total Raw Land 1,274k sqm
Westown Hub 50k sqm Total Unlaunched Projects 3,065k sqm
CASA 294k sqm 3. Raw Land Land Area
Beverly Hills 1,900k sqm Al Yosr 1,260k sqm
One16 35k sqm Total Raw Land 1,260k sqm
October Plaza 65k sqm
WMC 4k sqm
Others² 260k sqm
Total Launched Projects 6,072k sqm
1 As of 31st of March 2018 2 Includes Designopolis, BISC and Infrastructure assets ³ Excluding Syria Land Bank (Fully Impaired)
Q1 2018 Investor Presentation 12Land Bank as at 31st of March 2018
Al Yosr SODIC EAST 655 acre plot
A presidential decree was issued Co-development agreement
during 1Q17 outlining the areas 300 acres
North Coast
signed in March 2016 with
to be annexed to the city of 22% Heliopolis housing
Sheikh Zayed and Six of October, This plot is strategically located
with Al Yosr plot falling within the Other in New Heliopolis off Cairo Suez
extension. launched
projects
Road
The decree brings the plot closer 14% Masterplan has been finalized
to monetization commencing the
process of rezoning and 5.8 mn sqm by SASAKI and approved by
Heliopolis Housing Company
increasing the allowable footprint of unlaunched land Successfully launched phase 1
for construction
c.EGP 90-95bn selling out EGP 1.7 billion
of future sales 300 acres
655 Acres New
Heliopolis West Cairo (El
North Coast 300 acres plot 43% Yosr) Remaining land
21%
(SODIC West, Villette,
Eastown & October Plaza)
Co-development agreement
signed in March 2018
This plot is strategically located 8 Continuing to monetize new
km East of Caesar phases of launched projects in
Total sales estimated at EGP 15
300 acres West Cairo (El Yosr) 655 Acres New Heliopolis East & West Cairo
billion over 7 years 300 acres North Coast Other launched projects
Q1 2018 Investor PresentationReplenishing inventory on the North Coast through 300 acre co-
development deal
Summary Key Commercial Highlights
In March 2018 SODIC signed two revenue share agreements for
two privately owned adjacent plots with a total land area of 1.3
million square metres on the Mediterranean North Coast of Egypt.
Over EGP 15bn 72% share of revenues
of potential sales to SODIC
The plots are located on kilometre 94 of Alexandria – Marsa
Matrouh road
The 1.3 million square metre plot is expected to generate total
sales of over EGP 15 billion over a period of seven years and 7 years No minimum
comes in line with SODIC’s growth strategy and expansion plans in Sales visibility on the North Coast guarantee
second home markets.
300 acre plot
8 Kilometers
East of Caesar
Q1 2018 Investor Presentation 14Operational &
Financial Performance
15Performance Overview
SODIC has exhibited impressive growth, growing by every metric since 2011
Gross contracted sales Cancellations Continuing to deliver on schedule
EGP million 5,918 5,872 Pct of Gross Sales Units Delivered
1,151
99.0% 1,060
4,641
684 721
3,238
2,730
491
424 399
1,819
1,212 1,310 259
741 11.0% 9.0% 167
5.0% 5.0% 4.6% 2.6% 4.8% 4.3%
2011 2012 2013 2014 2015 2016 2017 1Q17 1Q18 2011 2012 2013 2014 2015 2016 2017 1Q17 1Q18 2011 2012 2013 2014 2015 2016 2017 1Q17 1Q18
Receivables growing in line with sales growth Unrecognized revenues provide strong earnings
Collections continued to increase
with delinquencies at a low rate of 4% visibility
EGP million 11,22311,331 EGP million 3,843 Client 16,180
deposits 15,497
9,751
3,127 EGP million 12,619
6,886 2,390
2,044 2,049 8,914
4,859
1,292 6,097
3,604 1,081
896 4,294
2,452 750 3,332 3,528
1,742
2011 2012 2013 2014 2015 2016 2017 1Q18 2011 2012 2013 2014 2015 2016 2017 1Q17 1Q18 2011 2012 2013 2014 2015 2016 2017 1Q18
Q1 2018 Investor Presentation 16Project Profitability
Launched projects estimated to return a blended gross profit margin of 38%
Sellable Inventory Profitability1 Percentage Sold (Value)
Total Launched Development Sold Projects’
Project (EGP Mn) Sold Unsold
Inventory Cost2 Inventory GPM³
Allegria 4,440 2,742 4,380 38% 99%
Kattameya Plaza 655 444 655 32% 100%
Forty West (I-II) 1,009 796 898 21% 89%
WTR (I-X) 2,248 1,175 2,243 48% 100%
Polygon 1,427 931 1,342 35% 94%
The Strip 353 202 353 43% 100%
One16 498 236 441 53% 89%
October Plaza 902 564 528 37% 59%
ETR (I-XI) 5,964 3,685 5,723 38% 96%
The Courtyards (I-VI) 1,707 853 1,704 50% 100%
Villette (I - V) + Sky Condos 8,353 5,398 5,797 35% 69%
Caesar 1,760 1,068 1,505 39% 86%
SODIC East 1,409 861 1,236 39% 88%
Total 30,725 18,957 26,806 38%
1 All
figures in EGP unless otherwise stated 2 Excludes the investment cost of leasable assets 3 Expected gross profit margin, excluding NPV adjustments and estimated based on projects budget and reflects the estimated
profitability for the entire launched project (delivered and undelivered units) GPM illustration here excludes capitalized interest expense
SODIC East sales presented net of 30% revenue share of Heliopolis Housing
Q1 2018 Investor Presentation 17Delivery and Execution1
SODIC delivered 167 units in 1Q18
Delivery Execution
Number of Delivered Percent Delivery Delivery Investment Percent
Project
Units Units Delivered Start Date End Date Cost² Completion3
Allegria 1,249 1,230 98% 2010 2017 2,742 94%
Kattameya Plaza 488 469 96% 2013 2016 444 100%
Forty West (I-II) 221 120 54% 2012 2018 796 82%
WT Residences (I-X) 1,391 1374 99% 2013 2017 1,175 99%
The Polygon 303 256 84% 2013 2018 931 90%
The Strip 84 56 67% 2012 2017 202 100%
WT Hub 48 45 94% 2014 2015 89 99%
ET Residences (I-XII) 2,575 1234 48% 2016 2020 3,685 50%
The Courtyards (I-VI) 776 199 26% 2017 2019 853 75%
Villette (I-V) + Sky Condos 1,499 - - 2018 2011 5,398 27%
One16 125 - - 2020 2020 236 20%
October Plaza 207 - - 2020 2020 564 16%
CASA⁴ 63 62 98% 2013 2015 NA 100%
Caesar 353 - - 2018 2019 1,068 58%
SODIC East 387 - - 2020 2021 1,465 0%
Total 9,769 5,045 52% From 2010 to 2021 19,650 NA
9,769 launched units under development (52% delivered) with an investment cost of c. EGP 19.6 billion
1 Allfigures as of 31st of March 2018.
2 Investment cost represents the expected construction and land costs. Figures are in EGP million.
3 Percentage completion represents CAPEX paid. With the exception of Eastown, Villette and Allegria, all projects land cost has been fully paid.
4 CASA is a jointly owned project (80% Palm Hills subsidiary & 20% SODIC). SODIC owns 63 apartments
Q1 2018 Investor Presentation 181Q18— Operating Performance Highlights
Sales driven by non residential products while deliveries remain on schedule
SODIC recorded EGP 1.2 billion of net contracted sales up 9% on the same period Cancellations
last year. With limited release of residential inventory, sales for the quarter were
mainly driven by our non-residential developments which represented 78% of the
EGP 1.2 bn remained low
net contracted sales for the period. The quarter witnessed the launch of Eastown
contracted sales 4.3%
District New Cairo “EDNC” marking the monetization of this prime located
commercial development in the heart of New Cairo. With construction
commencing this year, the project is slated for completion in 2021 and is expected Delinquency
to be the cornerstone of SODIC’s recurring income portfolio in the future. remained low EGP 1.1 bn
Cancellations remained low at 4.3% in line with historical averages and slightly
below 4.8% recorded during the same period last year. 4% Collected +20%
Net cash collections increased by 20% to reach EGP 1.1 billion during the first
quarter 2018, while delinquencies remained low at 4%.
The company continues its strong commitment to timely deliveries, with 167 units
delivered on schedule across our projects during the quarter including debut
Delivered first units in
Caesar
161 units
deliveries in Caesar. This compares to 399 units that were delivered on schedule Delivered
during the same period last year. Deliveries during 2017 were exceptionally front
loaded towards the first quarter in which we delivered circa 35% of the units for
the year.
Q1 2018 Investor Presentation 191Q18— Financial Performance Highlights
Exceptionally strong profitability with net profit margins reaching 41%
• SODIC recorded revenues of EGP 512 million during the quarter, this compares to
EGP 703 million recorded for the same period last year. Revenues during 2017
were exceptionally front loaded towards the first quarter in which we delivered
52% EGP 266 mn
Gross profit margin Gross profit
circa 35% of the units for the year.
• Gross profit was up 26% to reach EGP 266 million, delivering a solid gross profit
margin of 52%. Our projects recorded exceptionally high profitability during the
quarter with almost all of our projects achieving a gross margin of over 40%. In
addition gross profit was buoyed by one off sale of land for sub-development in
SODIC West. Excluding the effect of this deal gross profit margin from our
38% EGP 193 mn
Operating profit margin Operating profit
developments was a solid 43%. Operating profits came in at EGP 193 million
reflecting a healthy operating margin of 38%, representing a marked improvement
of 712 bps over same period last year.
• Net profit amounted to EGP 212 million during the quarter recording a net profit
margin of 41%. Our bottom line continues to be positively impacted by the high
interest rate environment. Excluding the impact of net interest income our net
41% EGP 212 mn
net profit margin net profit
profit margin comes in at a solid 28%.
Q1 2018 Investor Presentation 201Q18— Financial Performance Highlights
Solid balance sheet prudently managed to support growth
Total cash and cash equivalents amounted to EGP 3.9 billion, reflecting the
strength of our balance sheet supporting our land bank expansion plans and our 1
EGP bn
0.3x debt to equity
projects execution. Cash earmarked for
leverage remains low
Bank leverage remains low with bank debt to equity at 0.3x. As of 31st of March growth
2018 our bank debts outstanding were EGP 1.5 billion reflecting a 45% utilization
rate for our EGP 3.3 billion facilities.
Land liabilities continued to decline to EGP 560 million as we remain committed to
the timely repayment of NUCA installment. EGP 3.9 bn EGP 11 bn
Receivables of EGP 11 billion provide strong cash flow visibility, with delinquency Cash balances receivables
rates remaining low at 4%.
Client deposits represents the backlog of unrecognized revenues from contracted
sales of units that are to be delivered over the coming three to four years. Our
client deposits as of the end of the quarter were EGP 16 billion providing strong
revenue visibility for the company. EGP 16 bn 4%
Net cash flows from operations were up 82% to reach EGP 241 million Revenue backlog Delinquency rate
Q1 2018 Investor Presentation 21Summary Financial Results
Summary Consolidated Income Statement Selected Consolidated Balance Sheet Items
EGP in mn 1Q18 1Q17 EGP in mn Mar-18 Dec-17
Total Revenue 512 703 Assets
Cost of Goods Sold (246) (445) Total Assets 25,484 24,671
Gross Profit 266 259 Work In Process 8,354 8,011
Gross Profit Margin 52% 37% Long Term & Short Term Net Trade and Notes Receivable 11,331 11,223
Operating Profit 193 215 Cash and cash equivalent 3,897 3,596
Operating Profit Margin 38% 31%
Net Profit Before Tax 282 281 Liabilities & Shareholder Equity
Taxes (70) (69) Bank Credit Facilities & Long Term Loans 1,535 1,497
Minority Interest (0) (1) Advances from Customers 16,180 15,497
Net Profit After Tax and Minority Interest 212 211 Total Equity 4,655 4,443
Net Profit Margin 41% 30%
Q1 2018 Investor Presentation 22Appendices Q1 2018 Investor Presentation 23
I. Project Portfolio

      Q1 2018 Investor Presentation   24
Project Portfolio
Project Description
Westown’s first residential neighborhood, offering townhouses, twin-houses, city villas, signature lofts, duplexes and apartments. The development brings
together themed gardens, parks, and open green spaces, set in a secure, gated community designed around the Pedestrian Green Spine.
Launch date 2011 Receivables outstanding (EGP mn) 205
Gross Land Area (sqm) 584,331 Development cost for launched¹ (EGP mn) 1,175
Total BUA (sqm) 344,664 Capex remaining for launched 1%
Launched BUA (sqm) 344,664 Delivery start 2014
Launched inventory value (EGP mn) 2,248 Delivery end 2017
Sold inventory (EGP mn) 2,243 Value of units delivered (EGP mn) 2219
Number of units launched 1,391 Number of units delivered 1374
1Including land cost.
All figures as of 31st of March 2018.
Q1 2018 Investor Presentation 25Project Portfolio
Project Description
The Courtyards is SODIC West’s newest residential neighbourhood. Designed by SODIC’s very own in-house design team, offering a variety of
apartments and duplexes
Launch date 2014 Receivables outstanding (EGP mn) 861
Gross Land Area (sqm) 237,594 Development cost for launched¹ (EGP mn) 853
Total BUA (sqm) 164,637 Capex remaining for launched 25%
Launched BUA (sqm) 164,637 Delivery start 2017
Launched inventory value (EGP mn) 1,707 Delivery end² 2019
Sold inventory (EGP mn) 1,704 Value of units delivered (EGP mn) 381
Number of units launched 776 Number of units delivered 199
1 Including land cost.
All figures as of 31st of March 2018.
²for launched phases.
Q1 2018 Investor Presentation 26Project Portfolio
Project Description
SODIC’s flagship project, Allegria, is an award-winning residential development offering high-end single-family units surrounding an 18-hole Greg
Norman golf course.
Launch date 2008 Receivables outstanding (EGP mn) 268
Gross Land Area (sqm) 2,428,283 Development cost for launched¹ (EGP mn) 2,742
Total BUA (sqm) 575,325 Capex remaining for launched 6%
Launched BUA (sqm) 575,325 Delivery start 2010
Launched inventory value (EGP mn) 4,440 Delivery end 2017
Sold inventory (EGP mn) 4,380 Value of units delivered (EGP mn) 4,186
Number of units launched 1,249 Number of units delivered 1,230
1Including land cost.
All figures as of 31st of March 2018.
Q1 2018 Investor Presentation 27Project Portfolio
Project Description
Forty West is an exclusive development with a cutting-edge design by acclaimed Boston-based Machado and Silvetti Architect. It is the coming together of a
vibrant community with spectacular fully-finished apartments, offices, boutiques, world-class restaurants, open spaces and a luxurious hotel.
Launch date 2009 Receivables outstanding (EGP mn) 307
Gross Land Area (sqm) 52,934 Development cost for launched¹ (EGP mn) 466
Total BUA (sqm) 72,220 Capex remaining for launched 18%
Launched BUA (sqm) 72,220 Delivery start 2012
Launched inventory value (EGP mn) 1,009 Delivery end 2018
Sold inventory (EGP mn) 898 Value of units delivered (EGP mn) 514
Number of units launched 221 Number of units delivered 120
1Including land cost.
All figures as of 31st of March 2018.
Q1 2018 Investor Presentation 28Project Portfolio
Project Description
The Polygon consists of eleven ‘Class A’ office buildings designed by multiple-award-winning UK-based architects Wilkinson-Eyre. The Polygon offers
over 90,000 sqm of state-of-the-art office space, designed to accommodate both small and large businesses.
Launch date 2009 Receivables outstanding (EGP mn) 599
Gross Land Area (sqm) 54,727 Development cost for launched¹ (EGP mn) 931
Total BUA (sqm) 85,124 Capex remaining for launched 10%
Launched BUA (sqm) 85,124 Delivery start 2013
Launched inventory value (EGP mn) 1,427 Delivery end³ 2016
Sold inventory (EGP mn) 1342 Value of units delivered (EGP mn) 723
Number of units launched - Number of units delivered 256
Gross Leasable Area² (sqm) 4,252 Estimated Lease Income² (EGP mn) 14
1Including land cost.
All figures as of 31st of March 2018.
³for launched phases.
Q1 2018 Investor Presentation 29Project Portfolio
Project Description
Designed by leading Egyptian architectural firm Hassan Abu Seda, the Hub consists of five multi-leveled buildings around one central piazza,
creating a truly unique retail space. Westown Hub is home to some of Cairo’s finest restaurants and cafés.
Launch date 2012 Development cost for launched¹ (EGP mn) 89
Gross Land Area (sqm) 50,090 Capex remaining for launched 1%
Total BUA (sqm) 13,254 Delivery start 2014
Launched BUA (sqm) 13,254 Delivery end 2015
Gross Leasable Area² (sqm) 13,254 Estimated Lease Income² (EGP mn) 34
1Including land cost.
All figures as of 31st of March 2018.
²Estimated lease income in 2022.
Q1 2018 Investor Presentation 30Project Portfolio
Project Description
With stores arranged side by side and linked by a walkway, The Strip offers mixed retail shops and personal services over seven zones in a relaxed
and contemporary environment.
Launch date 2010 Receivables outstanding (EGP mn) 7
Gross Land Area (sqm) 157,872 Development cost for launched¹ (EGP mn) 202
Total BUA (sqm) 35,004 Capex remaining for launched 0%
Launched BUA (sqm) 22,161 Delivery start 2012
Launched inventory value (EGP mn) 353 Delivery end³ 2015
Sold inventory (EGP mn) 353 Value of units delivered (EGP mn) 353
Number of units launched 56 Number of units delivered 56
Gross Leasable Area² (sqm) 4,187 Estimated Lease Income² (EGP mn) 12
1Including land cost.
All figures as of 31st of March 2018.
²Estimated lease income in 2022. ³for launched phases.
Q1 2018 Investor Presentation 31Project Portfolio
One16
A circlet of 16 contemporary buildings, the project is one of two remaining multifamily developments in SODIC West. This premium offering
provides homeowners privacy and comfort within the heart of SODIC West
Launch date 2017 Receivables outstanding (EGP mn) 323
Gross Land Area (sqm) 35,293 Development cost for launched¹ (EGP mn) 236
Total BUA (sqm) 22,865 Capex remaining for launched 80%
Launched BUA (sqm) 22,865 Delivery start 2020
Launched inventory value (EGP mn) 498 Delivery end² 2020
Sold inventory (EGP mn) 441 Value of units delivered (EGP mn) 0
Number of units launched 125 Number of units delivered 0
1Including land cost.
²of launched phases
All figures as of 31st of March 2018.
Q1 2018 Investor Presentation 32Project Portfolio
October Plaza
Our first apartment offering in West Cairo outside of SODIC West,
Launch date 2017 Receivables outstanding (EGP mn) 409
Gross Land Area (sqm) 130,158 Development cost for launched¹ (EGP mn) 564
Total BUA (sqm) 126,564 Capex remaining for launched 84%
Launched BUA (sqm) 62,764 Delivery start 2020
Launched inventory value (EGP mn) 902 Delivery end² 2020
Sold inventory (EGP mn) 528 Value of units delivered (EGP mn) 0
Number of units launched 186 Number of units delivered 0
1Including land cost.
²of launched phases
All figures as of 31st of March 2018.
Q1 2018 Investor Presentation 33Project Portfolio
Project Description
Kattameya Plaza is comprised of 474 apartments and is strategically located in the heart of New Cairo, five minutes away from Eastown and the
American University in Cairo. Kattameya Plaza is designed and master-planned by ArchGroup — the distinguished firm that designed the Grosvenor
House in Dubai — and landscaped by Evergreen.
Launch date 2010 Receivables outstanding (EGP mn) 99
Gross Land Area (sqm) 126,000 Development cost for launched¹ (EGP mn) 444
Total BUA (sqm) 123,733 Capex remaining for launched 0%
Launched BUA (sqm) 123,733 Delivery start 2012
Launched inventory value (EGP mn) 655 Delivery end 2015
Sold inventory (EGP mn) 655 Value of units delivered (EGP mn) 619
Number of units launched 488 Number of units delivered 469
1Including land cost.
All figures as of 31st of March 2018.
Q1 2018 Investor Presentation 34Project Portfolio
Project Description
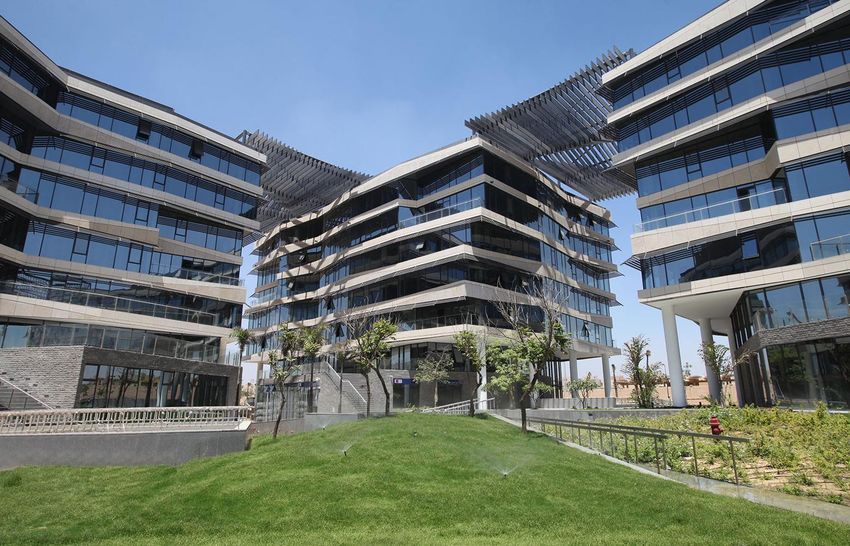
Strategically located on Road 90, adjacent to the American University in Cairo and just a short drive from Cairo International Airport, Eastown will
provide premium residential, retail and office space all set in a secure, gated community.
Launch date 2013 Receivables outstanding (EGP mn) 2,435
Gross Land Area (sqm) 852,758 Development cost for launched¹ (EGP mn) 3,685
Total BUA (sqm) 675,207 Capex remaining for launched 50%
Launched BUA (sqm) 570,008 Delivery start 2016
Launched inventory value (EGP mn) 5,964 Delivery end² 2017
Sold inventory (EGP mn) 5,723 Value of units delivered (EGP mn) 2,082
Number of units launched 2,575 Number of units delivered 1,234
1 Including land cost.
All figures as of 31st of March 2018.
²for launched phases.
Q1 2018 Investor Presentation 35Project Portfolio
Project Description
Villette marks SODIC’s first time to offer single family units in New Cairo. The development offers a range of standalone villas, townhouses and
twin-houses with unique architectural designs. The project was master planned by the renowned SWA Group and launched in a record 6 months
from acquisition of the 301 acre plot. 2Q17 marked the launch of SKY CONDOS, our multiple family offering in Villette
Launch date 2014 Receivables outstanding (EGP mn) 3,150
Gross Land Area (sqm) 1,266,215 Development cost for launched¹ (EGP mn) 5,398
Total BUA (sqm) 628,381 Capex remaining for launched 73%
Launched BUA (sqm) 432,651 Delivery start 2018
Launched inventory value (EGP mn) 8,353 Delivery end² 2019
Sold inventory (EGP mn) 5,797 Value of units delivered (EGP mn) -
Number of units launched 1,499 Number of units delivered -
1 Including land cost.
All figures as of 31st of March 2018.
²for launched phases.
Q1 2018 Investor Presentation 36Project Portfolio
Project Description
Caesar marks SODIC’s first secondary home development on the Mediterranean North Coast. The project offers a community of homes built on
terraced levels with unobstructed sea views and a beachfront of over 1km, Caesar will offer one of the most exclusive residential communities on
the North Coast
Launch date 2015 Receivables outstanding (EGP mn) 800
Gross Land Area (sqm) 441,000 Development cost for launched¹ (EGP mn) 1,068
Total BUA (sqm) 103,241 Capex remaining for launched 42%
Launched BUA (sqm) 103,241 Delivery start 2018
Launched inventory value (EGP mn) 1,760 Delivery end² 2019
Sold inventory (EGP mn) 1,505 Value of units delivered (EGP mn) -
Number of units launched 353 Number of units delivered -
1 Including land cost.
All figures as of 31st of March 2018
²for launched phase.
Q1 2018 Investor Presentation 37II. Additional Information
Q1 2018 Investor Presentation 38Board of Directors
Hani Sarie El Din
Chairman (Non-Executive)
Dr. Hani Sarie El Din is a prominent legal practitioner in Egypt and the Middle East with over 25 years of experience in corporate, banking, and capital market. In addition to his private professional career, Dr.
Sarie El Din has served in executive and non-executive public positions including, Chairman of Capital Market Authority, Board Member of the Central Bank of Egypt, General Authority for Investment, and
the first official US-Egyptian Fund to promote investment in Egypt. Dr. Sarie El Din holds a Ph.D. in International Business Law from Queen Mary and Westfield College, University of London.
Magued Sherif
Board Member (Executive)
Magued Sherif is SODIC’s Managing Director, appointed September 2015. Sherif enjoys almost 30 years of professional experience, including several leadership positions with prominent companies in the
industry. Past positions include Egypt Country Head and Properties Chief Executive Officer at Majid Al Futtaim Properties Egypt as well as General Manager and Senior Vice President at Palm Hills
Developments for a 10-year period starting from the company’s inception. More recently Sherif was Chief Executive Officer and Managing Director at Hyde Park Properties for Development from 2012-14.
Sherif was most recently the co-founder and managing director of The Venturers LLC in Orlando, Florida, as well as the co-founder of AA Investments LLC, Orlando. Earlier in his career Sherif worked as the
Head of Privatization Unit at Arthur Anderson, in addition to spending 7 years at Bechtel Egypt and Bechtel Limited. He began his career as a Site Engineer with Orascom Construction Industries in 1986.
Sherif holds a Bachelor’s degree in Architecture from Cairo University, Egypt, in addition to an MBA from the American University in Cairo.
Walid Abanumay
Board Member (Non-Executive)
Dr. Walid Sulaiman Abanamay has been the Managing Director of Al-Mareefa Al –Saudia Company since 1997. Prior to this, he served in the Treasury and Corporate Banking Departments of SAMBA Financial
Group. Dr. Abanamay has been serving the Board of Directors of several listed companies, private equity and equity funds including, Joussour, Beltone Financial, UGIC, Mena Capital Fund and GB Auto. He
also served in the Boards of SAFCO, Nasr City, Al-Inmaia, Al Raya Holdings and Al Masafi. Dr. Abanamay holds a B.Sc. degree in Computer Science from Southern Illinois University, a Master’s degree in
Management Information Systems from the University of Illinois and a Ph.D. in Business Administration majoring in Finance from Southern Illinois University.
Sabah Barakat
Board Member (Non-Executive)
Sabah Taysir Barakat is the Vice President of Olayan Financing Company, based in Riyadh, and is responsible for overseeing a portfolio of wholly owned and joint venture companies in the fields of energy,
construction, and real estate development. From 2003-2008, Barakat was Vice President of Bechtel Group. From 1998-2003, Barakat was the Regional Vice President of National Grid Plc. From 1986-1998,
Sabah worked for the Costain Group Plc., a leading international contracting firm, specializing in infrastructure, energy, and building construction. Barakat graduated in 1986 with an Engineering degree from
London University as a Chartered Engineer, and a member of the UK’s Institute of Civil Engineers. Barakat holds an MBA in Engineering Management and is a member of the UK’s Chartered Institute of
Management.
Yezan Haddadin
Board Member (Non-Executive)
Yezan Haddadin is currently the Chief Investment Officer of the Capital Bank Group, a financial services group with operations in Jordan, Iraq and UAE. Haddadin has over 15 years of investment and
investment banking experience. In 2013, he co-founded HCH Partners, a private equity investment company focused on East Africa, where he currently serves on the Board and is a member of the investment
committee. Prior to that, Haddadin acted as Advisor at Ripplewood Holdings LLC., following his post of Managing Director at Perella Weinberg in New York from 2007 to 2012 and his work with JPMorgan's
M&A group in New York from 2000 to 2007. Haddadin received a Bachelor of Science degree from Georgetown's School of Foreign Service and a Juris Doctor from Northwestern University School of Law. He
was admitted to the New York bar and is a licensed pilot. Throughout his career, Haddadin has developed an extensive experience across a range of industries and advised on approximately $100 billion in
M&A transactions in North America, Latin America, Europe, the Middle East and Africa.
Q1 2016 Investor Presentation 39Board of Directors
Omar Salah Bassiouny
Board Member (Non-Executive)
Omar S. Bassiouny is the co-founder and Executive Partner of Matouk Bassiouny and the head of the company’s Corporate and M&A group. Bassiouny has a strong track record in the areas of corporate law
and mergers and acquisitions, most recently representing Emirates NBD on the acquisition of BNP Paribas S.A.E. and representing Abraaj in the acquisition of Al Mokhtabar in 2012. Bassiouny is a prominent
member of several chambers of commerce and business associations including the American Chamber of Commerce, the Egyptian Malaysian Business Council and the British Egyptian Business Association.
Bassiouny’s achievements have been recognized with numerous awards such as Leading Lawyer in Mergers & Acquisitions in Egypt in 2014 by IFLR 1000 and leading lawyer in Egypt in 2013 by Chambers &
Partners. Bassiouny received a B.A in Public and International Law from the American University Cairo and a Licence en Droit from the faculty of Law at Cairo University.
Omar Elhamawy
Board Member (Executive)
Omar Elhamawy is the Chief Financial Officer of SODIC, as well as, the Managing Director of SODIC’s fully owned company SOREAL for Real Estate Investment. Since joining SODIC in May 2013, Elhamawy has
overseen the successful completion of SODIC’s EGP 1 billion capital increase, as well as, the signing of several medium term facilities. Prior to joining SODIC, Elhamawy spent eight years as a Director within
Beltone’s Investment Banking Division, where he highly focused on the real estate sector through his close involvement in both M&A and Capital Market transactions. His most notable transactions include
advising Mena for Touristic and Real Estate Investments on a capital increase, advising Beltone Private Equity on the tender offer and acquisition of Nasr City Housing and Development, and advising Amer
Group on its IPO, among many others. Elhamawy holds a bachelor’s degree of Business Administration from the American University in Cairo and is a CFA Charterholder.
Hisham El-Khazindar
Board Member (Non-Executive)
Hisham El-Khazindar is the Managing Director and Co-Founder of Qalaa Holdings. El-Khazindar also serves on the board of several leading regional companies including El Sewedy Electric and Magrabi Retail,
and on the Advisory Committee of the Emerging Markets Private Equity Association. He also serves as a Trustee of the American University in Cairo, a Trustee of the Cairo Children’s Cancer Hospital, and as a
Fellow of the Aspen Institute’s Middle East Leadership Initiative. Prior to co-founding Qalaa Holdings in 2004, El-Khazindar held the position of Executive Director of Investment Banking at EFG Hermes
where he advised on landmark M&A and IPO transactions in the region. During the period 1999-2000, El-Khazindar was on secondment to Goldman Sachs in London. El-Khazindar holds a BA in Economics
from the American University in Cairo and an MBA from Harvard Business School.
Hussein Choucri
Board Member (Non-Executive)
Hussein Choucri is the Chairman and Managing Director of HC Securities & Investment. Choucri is also a Board Member of the Holding Company for Tourism and Cinema (HOTAC), Edita Food Industries,
Integrated Diagnostics Holdings (IDH), and the Egyptian British Business Council (EBBC). In addition, Choucri is the Chairman of the Board of Trustees of Shefaa Charity Foundation. Choucri held the position
of Managing Director at Morgan Stanley, New York from 1987 to 1993, before serving as an Advisory Director until December 2007 where he was responsible for business activities in the emerging markets
of the Middle East and the Indian Subcontinent as well as taking part in a number of privatization projects in Turkey, India and Argentina. Prior to joining Morgan Stanley, Choucri worked with Abu Dhabi
Investment Company and participated in arranging several Euroloan and Eurobond financings for sovereigns and private sector companies. Choucri received a Management Diploma from the American
University in Cairo and a B.A. from the Faculty of Commerce, Ain Shams University.
Q1 2018 Investor Presentation 40Management
Magued Sherif
Managing Director
Magued Sherif is SODIC’s Managing Director, appointed September 2015. Sherif enjoys almost 30 years of professional experience, including several leadership
positions with prominent companies in the industry. Past positions include Egypt Country Head and Properties Chief Executive Officer at Majid Al Futtaim Properties
Egypt as well as General Manager and Senior Vice President at Palm Hills Developments for a 10-year period starting from the company’s inception. More recently
Sherif was Chief Executive Officer and Managing Director at Hyde Park Properties for Development from 2012-14. Sherif was most recently the co-founder and
managing director of The Venturers LLC in Orlando, Florida, as well as the co-founder of AA Investments LLC, Orlando. Earlier in his career Sherif worked as the Head
of Privatization Unit at Arthur Anderson, in addition to spending 7 years at Bechtel Egypt and Bechtel Limited. He began his career as a Site Engineer with Orascom
Construction Industries in 1986. Sherif holds a Bachelor’s degree in Architecture from Cairo University, Egypt, in addition to an MBA from the American University in
Cairo.
Omar Elhamawy
Chief Financial Officer
Omar Elhamawy is the Chief Financial Officer of SODIC, as well as, the Managing Director of SODIC’s fully owned company SOREAL for Real Estate Investment. Since
joining SODIC in May 2013, Elhamawy has overseen the successful completion of SODIC’s EGP 1 billion capital increase, as well as, the signing of several medium term
facilities. Prior to joining SODIC, Elhamawy spent eight years as a Director within Beltone’s Investment Banking Division, where he highly focused on the real estate
sector through his close involvement in both M&A and Capital Market transactions. His most notable transactions include advising Mena for Touristic and Real Estate
Investments on a capital increase, advising Beltone Private Equity on the tender offer and acquisition of Nasr City Housing and Development, and advising Amer
Group on its IPO, among many others. Elhamawy holds a bachelor’s degree of Business Administration from the American University in Cairo and is a CFA
Charterholder.
Ahmed Labib
Chief Commercial Officer
Ahmed Labib is the Chief Commercial Officer of SODIC. Labib is responsible for setting and achieving company-wide commercial objectives, as well as, setting and
overseeing the execution of SODIC’s marketing strategy. In his capacity, Labib collaborates with the development team, heavily contributing to the creation,
positioning and pricing of SODIC’s products. Labib joined SODIC in 2007 as a Sales Manager whose success quickly earned him the title of Sales Director and later
Executive Sales Director. His previous experience includes working in the Marketing Department at McDonalds and spending seven years in the Marketing and
Consumer Relations Platform at British American Tobacco (BAT) where he held various positions, the last of which was Multiple Category Brand Manager. Alongside
his professional experience Labib co-founded several successful ventures in the entertainment industry. Labib holds a bachelor degree in Psychology with a minor in
Mass Communication from the American University in Cairo.
Q1 2018 Investor Presentation 41Management
Ayman Amer
Executive Director Supply Chain
With more than 16 years of experience in the real estate, project management & construction in Egypt & North Africa, Amer is responsible for setting & monitoring
SODIC’s procurement strategy among all functions as well as expanding the land bank & find new opportunities for company’s growth & development. Amer Joined
SODIC in 2010 as Procurement Manager; prior to this he spent 4 years as Procurement & Cost Control Manager at Turner International Middle East (TIME) following
his post as Senior Procurement Engineer at Orascom Construction Industries (OCI). Amer holds a diploma in the project management from the American University in
Cairo, Certified International Procurement Professional & a Bachelor degree of Architectural Engineering from Cairo University.
Ramy Raafat
Executive Director of Development
With over 18 years of experience in the entire real estate development and investment lifecycle. In his capacity, he is responsible for SODIC’s real estate portfolio
with the vision and mission to revitalize existing communities and revolutionize new profitable destinations. Since Raafat joined SODIC in 2015, he successfully
introduced new innovative offerings and added 2.7 million sq.m to the company’s land bank.
Prior to joining SODIC, Raafat worked with Palm Hills Developments, where he managed the company’s entire real estate portfolio with full P&L accountability as
Portfolio Management Director. He also worked for GSSG Holding, YMM Investments-Dubai & MEINHARDT Consulting Engineers and Project Managers –Dubai and
successfully managed international flagship developments such as Burj Dubai Development, the Dubai Mall and the Address Hotel, JAL twin Towers and Agha Khan
Center in Dubai. Ramy holds BSc in Civil Engineering, Master's degree in Real Estate Development and Management from Heriot Watt University in the UK and
acquired the Project Management Professional “PMP” certification from PMI in USA.
Hisham Salah
Chief Information Officer
Hisham Salah is the Chief Information Officer of SODIC. Salah has 25 years of professional experience in the areas of information technology and corporate systems
including founding the first in-house residential fiber-to-the-home project in Egypt in 2009. Salah’s previous experience includes serving for eight years as Vice
President of Technology at Palm Hills Developments, in addition to spending seven years with Microsoft as the Head of Communications sector and later, the Head of
Government sector in Egypt, where he was responsible for sales and key strategic initiatives supporting the company’s growth. Before joining Microsoft, he
contributed in establishing the Commercial International Life Insurance Company (CIL) as Head of Information Technology. Salah began his career in Commercial
International Bank (CIB), where he held various positions in Information Technology and Operations. Salah holds a Master of Science degree in Information
Technology from Middlesex University in London.
Yasser Elsaid
Executive Director of Technical Department
With 26 years of experience in the real estate, project management & construction in Egypt and Gulf area, Eng Yasser is managing and overlooking the portfolio’s
Management team , control team and design team. Yasser joined SODIC in 2010 as Senior Projects Manager. He previously spent four years as a Project Manager
in Gulf area ( Dubai ) based Nakheel Co. as well as having held the post of Construction Manager at Hill International Project Management Firm. In addition Yasser
has spent nine years with ABB SUSA working in USAID projects all over Egypt and started his career working with Arab Contractors. Yasser holds a Bachelor degree
of Civil Engineering from Mansoura University on 1991.
Q1 2018 Investor Presentation 42Awards
With a history of almost two decades of successful operations in Egypt , SODIC is a globally recognized
developer
EUROMONEY CITYSCAPE
• 2013: Best Residential Project – Built (Allegria)
• 2016: Best Office Business Developer in Egypt (The Polygon) • 2013: Best Commercial and Mixed Use Project – Future (The
• 2014: Best Office Business Developer in Egypt (The Polygon) Polygon)
• 2013: Best Office Business Developer in Egypt (The Polygon) • 2015: Best Mixed Use Project (SODIC West)
• 2017: Best Commercial Project (The Polygon)
• 2017: Best Community, Culture & Tourism Project Westown
Medical Clinics
EUROMONEY MINISTRY OF TRADE & INDUSTRY
• 2016: Best Residential Developer – Egypt • 2010: Enterprise Innovation Award for registering all of its
• 2011: Best Developer Overall – Egypt trademarks with the Internal Trade Development Authority, an
• 2011: Best Mixed Use Developer – MENA affiliate of the Ministry of Trade and Industry
• 2011: Best Residential Developer – MENA
BUSINESS TODAY EUROMONEY
• 2011: “Best Company by BT100 Rank Change” at the BT100 • 2010: Best Developer Overall – Egypt
Crystal Awards • 2010: Best Mixed Use Developer – MENA
CNBC PROPERTY AWARDS EUROMONEY
• CNBC Arabian Property 2009: Best Architecture (Allegria) • 2007: Award of Merit (Allegria) from the American Society
• CNBC Property 2008: Best Development in Egypt with a 5-Star of Landscape Architects (ASLA) for its master plan,
Award (Allegria) developed by world-renowned master planners EDAW
• CNBC Property 2008: Best Golf Course Development with a 4-
Star Award (Allegria)
Q1 2018 Investor Presentation 43Diverse Shareholding Structure
Shareholders by Region Shareholders by Type Shareholders Breakdown
(as at 31st of March 2018) (as at 31st of March 2018) (as at 31st of March 2018)
2%
8% 13%
1% 20%
27%
11%
48%
9%
41%
8%
21% 80%
4%
3% 4%
Olayan Saudi Investment Company
Individuals Institutional
Abanumay Family
Egypt Europe Ripplewood Advisors L.L.C.
Middle East Africa
North America Others Share Information RIMCO
Number of outstanding shares: 342.3 million EFG Hermes Holding
Norges Bank
Symbol: Index Inclusion:
EGX: OCDI.CA EGX 30 Juma Al Majid Group
Reuters: OCDI>CA EGX 100 Others
Q1 2018 Investor Presentation 44Disclaimer
This Presentation is intended for information purposes only and does not constitute or form part of an offer for sale or subscription or an invitation or solicitation of an offer to
subscribe for or purchase securities of any kind and neither this document nor anything contained herein shall form the basis of any contract or commitment from any party
whatsoever. Information, including but not limited to financial information, in this presentation should not be considered as a recommendation in relation to holding, purchasing
or selling shares, securities or any other instruments in or, in entities related to, SODIC or any other company.
This Presentation contains important and privileged information on SODIC which is solely owned by SODIC and may not be relied on or used by any person whosoever for any
purpose, and therefore shall be kept secret and confidential by any receiving party.
This document includes forward-looking statements. The words "believe", "anticipate", "expect", "intend", "aim", "plan", "predict", "continue", "assume", "positioned",
"may", "will", "should", "shall", "risk" and other similar expressions that are predictions of or indicate future events and future trends identify forward-looking
statements. These forward-looking statements include all matters that are not historical facts. In particular, the statements regarding strategy and other future events or
prospects are forward-looking statements. Recipients of this document should not place undue reliance on forward-looking statements because they involve known and
unknown risks, uncertainties and other factors that are in many cases beyond the control of the Company. By their nature, forward-looking statements & projections involve
risks and uncertainties because they relate to events and depend on circumstances that may or may not occur in the future. Forward-looking statements are not guarantees of
future performance and the Company's actual results of operations, financial condition and liquidity, and the development of the industry in which the Company operates may
differ materially from those made in or suggested by the forward-looking statements contained in this document. The cautionary statements set forth above should be
considered in connection with any subsequent written or oral forward-looking statements that the Company, or persons acting on its behalf, may issue. Various factors could
cause actual results to differ materially from those expressed or implied by the forward-looking statements in this document including worldwide economic trends, the
economic and political climate of Egypt, the Middle East and changes in business strategy and various other factors.
All information contained in this presentation, including but not limited to information relating to the Egyptian real estate and financial markets, are compiled from sources
known to be reliable and/or publicly available data reasonably assumed to be accurate (the “Source Data”). The Source Data may contain errors and/or inaccuracies; SODIC
provides no warranties or guarantees of any kind, expressed or implied, and accepts no responsibility whatsoever, with regard to the accuracy, completeness or correctness of
the Source Data used in the Presentation.
This disclaimer is to be considered an integral part of the Presentation and SODIC’s liability in respect of this Presentation and is to be governed by Egyptian law under the
jurisdiction of Egyptian courts.
Q1 2018 Investor Presentation 45SODIC Investor Relations
Contact Information
Heba Makhlouf
hmakhlouf@SODIC.com
Tel: +202 3827 0300
IR Website
ir.SODIC.com
Corporate Website
SODIC.com
46You can also read