Sportfishing in Panama: Size, Economic Impacts and Market Potential - The Billfish Foundation
←
→
Page content transcription
If your browser does not render page correctly, please read the page content below
Sportfishing in Panama: Size, Economic
      Impacts and Market Potential

     Rob Southwick, Southwick Associates, Inc. Fernandina Beach, FL, USA
    Russell Nelson, PhD, Nelson Resources Consulting, Oakland Park, FL, USA
   Ruben Lachman, PhD, Intracorp Estrategias Empresariales, Chiriquí, Panama

                                February 5, 2013

Conducted with support from the Secretaría Nacional de Ciencia, Tecnología e
                   Innovación (SENACYT) of Panama

                                       1
ACKNOWLEDGMENTS

This study estimates the economic contributions of anglers visiting Panama. The authors were
Rob Southwick of Southwick Associates, Inc., Fernandina Beach, Florida; Russell Nelson, Ph.D.
of Nelson Resources Consulting, Oakland Park, Florida; and Ruben Lachman, Ph.D., Intracorp
Estrategias Empresariales, Chiriquí, Panama. Sigma Dos Centroamérica, S. A., of Panama City,
Panama conducted the airport survey and was led by Jaime Dreyfus. Majority funding was
provided by the Secretaría Nacional de Ciencia, Tecnología e Innovación (SENACYT) with
additional support from The Billfish Foundation, Fort Lauderdale, Florida. Matt Shilling of
OCEARCH played an important role in making this work possible and helping to further the
researchers’ understanding of Panama’s sportfisheries and related economy.
This is a first-ever project for this region. Economic models, expenditure data, and even a basic
understanding of the local economy had to be developed from scratch. None of this would have
been possible without the assistance of many individuals, especially the many anonymous
businesses and people in Panama and elsewhere who took time to provide us with completed
surveys, trade information, advice and input.
A special thank you is extended to Trey Bohn whose contacts throughout Panama plus his
diligence and determination opened many doors and led to this project’s success. His insights and
knowledge of the Panama sportfishing sector and the economy in general was a significant factor
in the successful completion of this project. Regardless of the contributions of many, the authors
remain responsible for all contents.

                                                2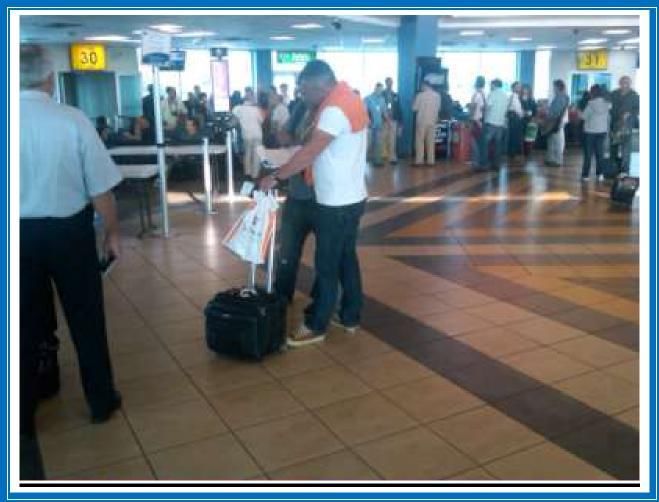
Executive Summary
In recent years, Panama has experienced rapid growth as a major North American tourist
destination. Based on Panama’s quality fisheries and natural environment, sportfishing has been
a major part of this growth. Information regarding the size and economic contributions of
sportfishing is needed to help Panamanian authorities understand the policies and actions needed
to ensure the short and long term economic returns from Panama’s fisheries continue to grow in a
sustainable manner. n
In 2011 and 2012, a comprehensive study was conducted to
1) better understand Panama’s sportfishing ecotourists,
2) the dollars they bring into the economy,
3) their resulting economic impacts, and
4) the reasons why foreign anglers choose – or not choose – Panama as their fishing
destination.
A series of surveys were conducted of visitors, both anglers and non-anglers, to gain an
understanding of the number of people who fish in Panama and the dollars they spend.
Additional surveys were conducted of various Panamanian fishing and tourism businesses to
assist in the development of an economic model of the Nation’s sportfishing economy. Dozens of
interviews were conducted with business, sportfishing, political and tourism leaders to learn
about the nuances of the regional economy and how it supports sportfishing visitors. In addition,
a survey was conducted in the U.S. to help learn more about the motivations and preferences that
cause many anglers to select or not select Panama as their sportfishing destination.
In 2011, an estimated 86,250 visitors to Panama fished. Many of these came as part of larger
travel groups with members who did not fish. Most spent a mean of eight days in Panama, and
left a total of $97 million in Panama for lodging, charter boats, food, transportation, tackle, fuel,
and much more. Tuna followed by billfish (marlin and sailfish) were the top species caught.
Measured using an economic model developed as part of this project, the $72 million introduced
into Panama by sportfishing tourists were found to create:
US $170.4 million in total retail and business-to-business sales within Panama,
9,503 Panamanian jobs,
US $3.1 million in new tax revenues, and
Increased Panama’s Gross Domestic Product by US $48.5 million.
Every 10 sportfishing visitors to Panama supports 1.1 Panamanian jobs. Plus every visiting
angler increases Panama’s GDP by $562.
Panama’s sportfishing tourists report 87% satisfaction rates. Even though just over six percent of
visitors fished while in Panama, 30% reported fishing would be of interest to them if they were to
return. Over two thirds of Panama’s visiting anglers have an income greater than $75,000, are
over 40 years of age and tend to have visited Panama an average of nearly six times each. Fishing
is not their only interest, with many reported having taken time to go on nature tours or view
wildlife, hike and enjoy other activities. Nature-oriented activities such as fishing and wildlife
viewing define these visitors.
3
The survey of U.S. anglers who have previously fished in other countries provides valuable
marketing insights. Not including U.S. anglers who fished in Canada, 3.2 million U.S. anglers
fished outside the U.S. at least once in the past five years. Panama is competing with other
countries for these anglers’ attention and dollars. This is considered a minimum estimate as many
U.S. visitors who fish in Panama may not fish in the U.S. and are excluded from these estimates.
Anglers have choices, and currently Costa Rica hosts 2.5 times more U.S. anglers than Panama.
On the positive side, for every angler who has actually visited Panama, there are eight more
interested in visiting, representing hundreds of millions of potential new dollars for Panama’s
economy.
Nearly two-thirds of American anglers who fish outside the U.S. stated that the most important
reason for selecting a particular angling destination was the quality of fishing. This clearly
underlines the importance of maintaining abundant stocks of the target fish species to provide
high quality and sustainable sportfisheries that can attract more anglers and keep them coming
back. Panama’s natural setting and climate is also a major draw, with many anglers also wanting
to see Panama’s wildlife and natural areas during their visit. Price is important, but only has half
the importance as providing quality sportfishing. Nice amenities such as quality resorts, safety
and other factors are also important to address when trying to boost sportfishing in Panama.
Most U.S. anglers who fished in other countries report high levels of satisfaction with their trips.
These satisfaction levels are very similar to the satisfaction levels reported by Panama’s visiting
anglers, indicating the fishing experiences offered by Panama are not viewed by U.S. anglers as
being different than in other popular fishing destinations. If U.S. anglers perceive that the quality
of Panama’s fisheries has declined below other countries, sportfishing tourism may decrease.
Likewise, an increased perception among anglers that Panama’s sportfishing is better than other
destinations will likely result in increased tourism.
Anglers are not concerned about bringing home large amounts of fish, if any. The reverse is true:
a greater number of visiting anglers would be encouraged to return if limits were tightened,
meaning anglers would be required to keep less fish, thus increasing the perception that fishing is
good and the catch-and-release ethic is responsible for more fish being returned to the water to be
caught again. Knowing that commercial fishing was reduced for species popular with
sportfishermen would also encourage over half of anglers to return again. Over half of U.S.
anglers said they were not likely to return, or not sure if they would, if they learned commercial
harvests were increased.
Providing quality fishing is the most important task Panama can do to boost the jobs and
economic contributions from sportfishing ecotourism. Fisheries policies that boost and sustain
healthy fisheries are critical. Likewise, effectively communicating these policies and the quality
of Panama’s fisheries to U.S. anglers is critical to maintain and grow the sportfishing economy.
This report provides some of the information needed to make informed decisions regarding the
long term health of Panama’s fisheries and tourism economy.

                                                  4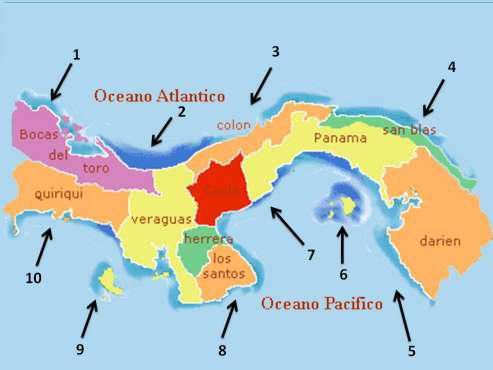
CONTENTS

Acknowledgments                                                                       2
Executive Summary                                                                     3
Introduction                                                                          6
I.    Methods                                                                         7
II. Results                                                                           12
     II.A Number of Anglers and Characteristics of Their Panama Activities            12
     II.B Angler Expenditures and Spending Characteristics                            15
     II.C Economic Impacts Created by Sportfishing Tourists in Panama                 18
     II.D Characteristics, Motivations and Preferences of Panama’s Visiting Anglers   19
  II.E Preferences and Motivations Among All U.S. Anglers Who Fish
         Internationally                                                              24
Conclusion                                                                            30
Bibliography                                                                          31
Appendix A: Tocumen Survey Questionnaire                                              32
Appendix B: Tocumen Airport Survey Methods                                            38
Appendix C: Development of the Panama Sportfishing Economic Model                     50

                                                 5
Introduction
Over the past decade, Panama’s tourism sector has grown significantly. Between 1999 and 2009,
the number of visitors to Panama has nearly tripled (Autoridad de Tourismo Panama). Many of
these visitors are attracted by Panama’s outdoor and nature-oriented opportunities. With a long
coastline and abundant sportfishing opportunities, Panama is positioned to grow its sportfishing
industry. However, threats to Panama’s fisheries resources can reduce the quality of its
sportfishing opportunities, potentially pushing many tourists towards other international fishing
destinations. These threats include reduced catch rates and poor transportation infrastructure. To
help better understand the current and potential size of the Panamanian sportfishing sector and its
contributions to the general economy, SENACYT, an agency of the Panamanian government,
with United Nations funding, sponsored this two-year investigation.

The relationship between sportfishing and jobs, tax revenues, and other economic contributions
in Panama has been poorly understood. This project measured the economic impacts of
nonresident anglers to Panama and the motivations and factors that cause visitors to choose
Panama or other locations when planning their trips. Surveys of visitors and Panama’s business
community were conducted, and an economic model was developed mapping how anglers’
dollars benefit the Panamanian economy. Economic impacts are defined as the total economic
activity resulting from the new dollars introduced into the Panamanian economy by these visiting
anglers. These visitors can also be referred to as sportfishing ecotourists, given their interest and
attraction to Panama’s natural offerings. The results of this study will allow resource managers
and tourism officials to better evaluate the allocation and alternative uses of valuable marine
resources for the long-term betterment of Panama’s marine environment and economy.

                                                  6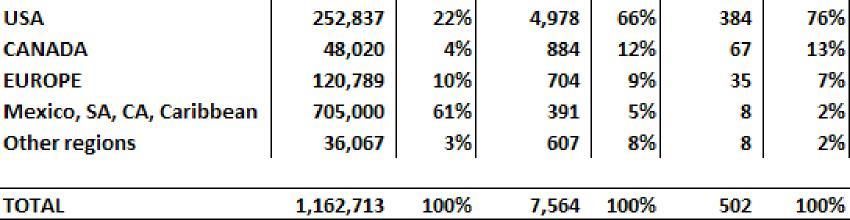
I.    Methods
I.A. Synopsis of the Approach Used
An economic model was developed to estimate the economic impacts in Panama from
sportfishing. The key data required are estimates of total angler expenditures and information
explaining the paths taken by anglers’ dollars as they move through the Panamanian economy.
The three primary data sources for this project were:
    1) In-person interviews with sportfishing and tourism-related businesses in Panama to obtain
        existing sportfishing and tourism data; to identify the information needed by government
        and businesses to enhance tourism, business and environmental planning policies; and to
        secure participation in the various surveys.
    2) Surveys of local businesses were conducted to provide the information needed to develop
        an economic model and to develop an understanding of how and when businesses
        receive and re-spend angler dollars. These surveys also identified when angler dollars
        leave the local economy, and
    3) Visitor surveys were conducted to collect expenditure data from anglers and non-angler
        visitors who have visited Panama and to estimate the total level of fishing activity in
        Panama.
Additional surveys were conducted to learn more about anglers’ motiviations and preferences
regarding international travel and sportfishing. The results are provided to help Panama boost its
sportfishing marketing activities and environmental planning efforts.
Once all data were obtained, the two principle analytical tasks were:
    4) Develop sportfishing expenditure estimates based on the survey results and existing data
        sources regarding the number of annual visitors to Panama and the percentage who fish
        while in Panama; and
    5) Construct an economic model of the Panamanian sportfishing economy.

I.B. Data Sources Used
I.B.1 Existing Data and In-Person Interviews
A substantial effort was made to identify existing data before investing resources into producing
new data. A series of interviews were held in Panama City with state and federal government
representatives, business associations and private companies. Additional interviews were conducted
with businesses in various sportfishing destinations across Panama. The purpose of the interviews
was to inquire about available data of possible use to this project. As a result, information obtained
included passenger arrival data to the Panama airport, information on the economic size and trends
of general tourism in Panama, Panama’s tourism marketing strategies, statistical data on the size
and operations of various economic sectors in Panama and more. All published and unpublished
sources are listed in the Bibliography and were considered for use in this project, if not directly
utilized in the economic model or expenditure calculations.
                                                  7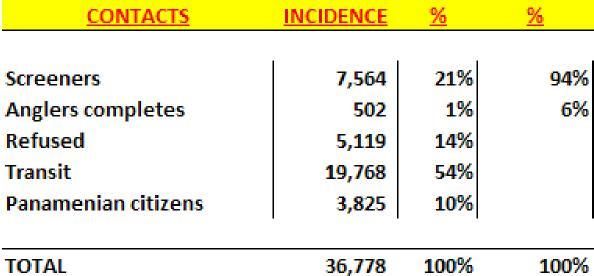
I.B.2 Business Surveys
Surveys were conducted of Panama’s business sectors. Business survey results were used to provide
the information necessary to develop the Panama sportfishing economic model. The results helped
explain how expenditures move from anglers’ pockets through the Panamanian economy, creating
jobs, tax revenues and other impacts along the way. To maximize response rates, surveys did not
inquire about exact business revenues as initial input from businesses revealed that direct
questions about revenues would likely reduce cooperation and survey completion. Therefore, the
questions focused on “percentage” terms, such as “What percentage of your revenues come from
anglers?” Surveys were developed jointly by Southwick Associates and IntraCorp of Chiriqui,
Panama to match angler expenditure data. The surveys were conducted by phone and via
personal interviews. Businesses were assured their individual responses would remain
confidential and protected. Businesses were encouraged to participate via a letter signed by the
Panamanian Presidency. All responses remain in strict confidence and only aggregated, averaged
results are incorporated into this report. The surveys were conducted by IntraCorp. IntraCorp
used the results to develop the economic impact model, as described later. Businesses were
identified through multiple sources, including TBF membership roles, during government and
business interviews, while visiting various sportfishing destinations in Panama and from business
lists in the possession of IntraCorp.
It is important to note that not all data used in the economic model came from the surveys. Much
of the data came from established government statistical data, as explained later in this
document.

I.B.3 Airport Survey
The purpose of this survey was to quantify the average amount spent in Panama per visitor. Panama
is primarily served by a single international airport, Tocumen International Airport (Aeropuerto
Internacional de Tocumen) outside of Panama City. Interviews with Panamanian sportfishing
businesses report nearly all anglers arrive via Tocumen. A few anglers arrive by private boat and
rarely will a cruise ship passenger go fishing based on extremely limited sportfishing services at
cruise ports. Therefore, it was assumed all anglers arrived and departed from Tocumen, thus
providing an ideal place to survey anglers.
Surveys were contracted to Sigma Dos Centroamérica, S. A., a survey research firm located in
Panama City and experienced in conducting tourism surveys at the international airport. Surveys
were conducted in the winter (dry) and summer (wet) seasons to account for variability in fishing
participation and expenditures between the time periods. The survey questionnaires were
developed by Southwick Associates and were modeled after their similar sportfishing surveys
conducted within the Central American region. A copy of the questionnaire is presented in
Appendix A and a detailed report on survey procedures written by Sigma Dos is presented in
Appendix B.
Departing tourists were intercepted at the boarding gate inside the airport’s secure zone prior to
boarding for their return flights. Access to the airport’s boarding areas was arranged by
Autoridad de Tourismo Panama, Panama’s government tourism agency. Before finalizing the
                                                 8
survey, pre-tests were conducted and the questionnaire and survey procedures were modified. All
flights departing for the United States were surveyed from February 17 to July 22, 2012, and all
passengers were approached. The survey was divided into two parts. The first part inquired about
the purpose of the visitors’ trip to Panama. If visitors acknowledged fishing at least once during
their visit, they were then presented with the detailed sportfishing survey. Standard quality
controls, surveyor training and observation/monitoring were implemented by Sigma Dos
Centroamérica, S. A. In all, 36,778 surveys were attempted:
14% refused to respond (5,119)
54% were transit passengers, meaning they were in Tocumen airport to transfer
from aircraft arriving from outside of Panama to flights bound for the U.S.
(19,768)
10% were Panamanian citizens and not part of the target audience (3,825)
21% completed the screener surveys but did not fish (7,564, 157 who reported
fishing while in Panama but refused to complete the detailed sportfishing
survey1)
1% completed the fishing survey (502). Considering just non-Panamanian
visitors and excluding transit passengers, 6.22% of visitors fished.
I.C. Economic Modeling
Economic input-output models (I-O models) are statistical simulations of a regional or national
economy. Using information regarding the flow of products and dollars from consumers to
businesses, I-O models help explain the increase or decrease in economic activity occurring as a
result of dollars being injected into an economy, a change in employment, and more. I-O models
applicable to sportfishing were not available for Panama. It was necessary to develop a model to
estimate the economic impacts of sportfishing on Panama’s economy.
The economic model was developed by IntraCorp of Chiriqui, Panama, led by Dr. Ruben
Lachman. A detailed report explaining the model’s data sources and development are provided in
Appendix C.
The primary information sources used to construct the economic model include:
A. Economic sectors and preliminary statistics as listed in Panama’s National Institute of
Statistics and Census;
B. Surveys of businesses within Panama’s tourism and sportfishing sectors to identify and
document various sources of income and expenditures in various economic sectors
associated with anglers’ expenditures;
C. An Economic Census of non-financial companies in Panama, conducted by Panama’s
Comptroller General of the Republic, and also Panama’s agricultural census; and
1
Of all departing visitors who responded they fished, 157 (23.8% of all anglers) refused to answer further questions. Considering the sportfishing
expenditures estimated in this report requires dividing anglers into those who visiting for the primary purpose of fishing and those who would have
visited even if they could not fish, it was not possible to include these 157 in the calculations not knowing the motivations of these anglers. Simply
increasing the estimates by 23.8% is possible, but this study elected to err on the side of conservatism and not include these anglers.
9D. Interviews with key businesses and business leaders within the sportfishing sector to fill
in the gaps not covered in the information sources described above and to verify and
adjust results as needed to ensure greater precision in the model’s results.
The Economic Census collects information regarding intermediate consumption, income, wages
and taxes, and helped determine the gross value of production. In addition to these categories, the
Economic Census also provided information on employment, fixed assets and company balance
sheet statistics. This information is published by the Comptroller in aggregate terms, i.e. averages
for all companies, to protect individual company’s private data and maintain confidentiality for
all reporting Panamanian companies.
The base of the model was an input-output model of Singapore’s economy, based on its
similarity to the economy of Panama. The statistics and metrics within were adjusted using the
data sources listed above. All results were validated by experts representing enterprises within
each sector that have relatively high shares of their respective markets (between 25% and 50%).
The model was built representing 2010 as its base year as data for 2011 were not always
available. References were made to the sportfishing models developed for The Billfish
Foundation by the University of Costa Rica.
The detailed report in Appendix C was developed using preliminary survey results. From the
draft results presented in Appendix C, the following multipliers are derived based on simply
dividing the reported impacts by the retail sales estimate used in the appendix ($72 million, page
18 of Appendix C). The resulting multipliers, listed below, were used to generate the final
economic impact estimates presented later in this report. For each dollar spent by a visiting
angler to Panama, the impacts to the Panamanian economy are:
Sales impact: $1.75694
GDP contribution: $0.50000
Tax revenue: $0.03194
Direct tax revenue: $0.01667
Indirect tax revenue: $0.01528
Income: $0.68889
Direct income: $0.16528
Indirect income: $0.52361
Employment (reported as jobs per million in retail sales):
Total employment (jobs per million: 97.972
Direct employment: 13.889
Indirect employment: 84.083
I.C.1 Economic Measures Reported in this Study
The model generates estimates for the following economic measures:
Total Sales: This figure, also frequently reported as production impacts, reports the amount of
retail and business sales within Panama that occurs as a result of each dollar spent by anglers.
10This figure is generally regarded as the total economic impact on the economy created by
visiting anglers.
GDP Contribution: the total contribution made by anglers to the Panamanian economy. This is
also referred to as “value added” as it represents the new growth or value remaining after all
costs of inputs and materials have been deducted.
Employment: the full and part time jobs supported by anglers’ expenditures in Panama. These are
divided into direct jobs (jobs that directly interact and support anglers such as charter boat
crews, restaurant staff, hotel employees, transportation jobs, etc.), plus the “indirect” jobs that
support the “direct” jobs such as wholesalers, mechanics, accountants, pilots, and more. Also
included are jobs supported by direct and indirect employees when they spend their pay
checks, such as grocery stores, various manufacturers, entertainment services, and much
more.
Tax Revenues: this figure represents all forms of tax receipts received by the Panamanian
government as a result of the economic activity stimulated by anglers’ expenditures. This
measure is divided into direct and indirect amounts. Direct tax revenues are those paid
directly by anglers in the form of sale or hospitality taxes, etc. Indirect taxes are generated as
a result of the rounds of spending created by anglers’ original expenditures.
Income: the wages, salaries and business owner profits are reported via the income measurement.
Included is the direct and indirect income generated within Panama.
I.D Angler Motivations and Preferences Regarding International Travel
To learn more about the types of policies and infrastructure needed to sustainably boost
sportfishing tourism in Panama, a survey of U.S. anglers who have previously fished outside of
the U.S. was conducted. Southwick Associates’ AnglerSurvey panel of approximately 5,000
anglers was used. This panel is surveyed online on a bi-monthly basis. This survey gathers
information relating to angler expenditures, activities and preferences. In April, 2012, eight
questions were asked relating to angling trips taken outside of the U.S., such as which countries
were selected and why, overall satisfaction and preferred future destinations. Panama was one of
the destinations tested in the suvey. Respondents did not know Panama was the subject of the
survey. It should be noted that, even with measures taken to weight the survey to represent all
U.S. anglers, given the greater motivation of active anglers to respond to surveys, some bias is
expected in the results towards avid anglers.
11II. Results
II.A Number of Anglers and Characteristics of Their Panama Activities
Considering all departing passengers (with the exception of) who were willing to complete the
survey, excluding Panama citizens and transfer passengers, 6.22% went fishing prior to departing
the country. Of these, 18% visited Panama specifically to fish (Table 1).
Table 1. If you could not have fished, would you have still visited Panama?
Count Percent
Yes 378 75%
No 89 18%
Not sure 35 7%
Total 502 100%
According to the Tocumen Airport Authority, in 2011 1,788,918 individuals departed from
Tocumen airport, visitors and citizens of Panama. This figure excludes transfer passengers who
were simply changing planes at Tocumen and did not visit Panama. Of these visitors, 22.49%
were Panama residents and are removed from further consideration in this study as residents’
fishing dollars are not within the study’s scope. Of the remaining individuals, 6.22% were
tourists who reported fishing while in Panama. Therefore, in 2011, Panama hosted 86,250
anglers (6.22% of 1,386,662 visitors).
Only a minority of visiting anglers made their trip to Panama for the primary purpose of fishing.
Specifically, 75% reported they would have still visited Panama even if they could not fish
(Table 1). Another 7% were not sure. To maintain conservatism in the study, those who reported
“not sure” were counted as having said they would have visited even if they could not fish.
Therefore:
64,687 anglers = visitors who fished while in Panama but did not come for the
primary purpose of fishing, and
21,563 = arrived specifically to fish.
86,250 = total visitors to Panama who fished in 2011
Most survey respondents did not travel alone. Two-thirds traveled with a partner, friends, family
or co-workers, while one-third traveled alone (Table 2).
12Table 2.Who traveled with you, in your direct travel party?
Count Percent
I traveled alone 164 32.7%
Spouse 141 28.1%
Kids 25 5.0%
Other family members 49 9.8%
Girlfriend or boyfriend 18 3.6%
Other friends, co-workers, etc 149 29.7%
Most respondents went fishing in groups, with just about four people fishing per group, including
the survey respondent (Table 3).
Table 3.How many other members of your party also went sportfishing?
Mean* Median Minimum Maximum* N
# of people in your travel party who fished in
addition to yourself 2.7 2.0 0 15 362
*Values greater than the total party count were excluded
Most survey respondents stayed longer than a week on their visit to Panama, with many staying
longer than two weeks (Table 4a and 4b).
Table 4a. How many days did you spend in Panama during this trip?
Mean* Median Minimum Maximum* N
Days in Panama 17.2 8.0 1 150 485
*Values greater than "150" not included in the average calculation. And, the twelve cases where a "99" is recorded were
treated as missing values.
Table 4b. How many days did you spend in Panama during this trip?
Count Percent
1 to 7 230 45.8%
8 to 14 130 25.9%
15 to 21 42 8.4%
22 to 30 34 6.8%
31 to 50 14 2.8%
51 to 75 8 1.6%
76 to 100 29 5.8%
101 to 150 10 2.0%
Greater than 150 5 1.0%
Total 502 100.0%
13Sportfishing distribution is not clustered in one or two regions as commonly found in other
countries (Table 5.1). Table 5.2 shows the typical days of fishing within each region are
consistent across regions.
Table 5a: Referring to our map, in what regions did you go?
Count Percent
Region 1 & 2: BOCAS DEL TORO 91 18.1%
Region 10. CHIRIQUI GULF 122 24.3%
Region 9. COIBA 69 13.7%
Region 8. PEDASI 61 12.2%
Region 7. PACIFIC COAST - Beaches 90 17.9%
Region 6. LAS PERLAS 104 20.7%
Region 3 & 4. COLON - SAN BLAS 49 9.8%
Region 5. PIÑAS BAY 41 8.2%
Table 5b. How many days did you fish in each region?
Mean* Median Minimum Maximum Count
BOCAS DEL TORO 5.1 2 1 90 82
CHIRIQUI GULF 5.0 4 1 35 117
COIBA 5.0 3 1 90 65
PEDASI 4.9 3.5 1 21 58
PACIFIC COAST - Beaches 5.1 2 1 60 87
LAS PERLAS 5.5 2 1 150 102
COLON - SAN BLAS 6.8 2 1 120 46
PIÑAS BAY 4.3 4 1 7 37
*Cases where the total number of reported fishing days was greater than the total number of trip days were excluded
from average. And similar to above, cases where total trip days greater than 150 were also excluded. And, recorded
values of "99" were treated as missing values.
14Table 6 shows the species caught while fishing in Panama. Whether these species were targeted
or not when anglers first departed on their trip, the results show which species drive the majority
of Panama’s sportfishing business. Tuna, or atun, was the top catch, followed by billfish (marlin
and sailfish). Dorado (mahi), snapper and mackerel are also important, as are peacock bass for
anglers targeting freshwater.
Table 6. Which species did you actually catch while fishing here?
Count Percent
Marlin (any species of marlin) 86 17.1%
Sailfish 60 12.0%
Dorado - mahi-mahi - dolphin (fish) 137 27.3%
Tuna (atún: yellowfin, big eye, albacore) 222 44.2%
Wahoo 63 12.5%
Tarpon (sábalo) 31 6.2%
Sierra mackerel 103 20.5%
Roosterfish 72 14.3%
Grouper, amberjack 112 22.3%
Robalo – snook 59 11.8%
Shark 46 9.2%
Cubera snapper, mullet snapper 111 22.1%
Bonefish 7 1.4%
Peacock bass - cichlids – Oscars 77 15.3%
Freshwater trout 7 1.4%
Other 54 10.8%
I don’t know- do not remember 36 7.2%
I didn t fish anything 34 6.8%
II.B Angler Expenditures and Spending Characteristics
II.B.1 Adjustments Made
Angler expenditures were estimated using the results of the Tocumen airport survey. Several
adjustments were needed to generate accurate estimates:
Group vs individual expenditures: Many travel expenditures are spent at the group level versus
individual level. Examples would include a family’s restaurant or hotel bill, and fuel for
transportation. Economic research by the U.S. Forest Service (Stynes and White, 2006) showed
that people often will report group expenditures when asked for their individual shares.
Therefore, all expenditure questions were clearly worded, and surveyors instructed to be attentive
and only record expenditures on a per-person basis to help ensure correct amounts were reported.
In-country vs out-of-country expenditures: Only dollars brought into Panama can be included in
the analysis. Dollars spent at home before departing for Panama were excluded as best as
possible. These items can include pre-paid tours, lodging, fishing trips and more. In all, 72.9% of
all visitors to Panama reported purchasing various services in advance of departing home (Table
157). Part of these expenditures can be reasonably assigned to Panamanian businesses and
individuals who provided the pre-paid services once the visitor arrived in Panama. No suitable
source of information was located showing how much of these expenditures were received by
Panama. Based on responses from businesses interviewed in Panama, the amounts listed in the
last column of Table 8 are considered reasonable for inclusion within this study ($1,011.89).
Considering that 72.9% of survey respondents reported making such purchases before leaving
home, when these adjusted expenditures ($1,011.89) were multiplied by the total number of
visitors, only 72.9% of the total was applied to this study, which is equivalent to $737.67.
Table 7. Did you spend money at home, before you left for Panama, for travel packages,
transportation, fishing or services while here?
Count Percent
Yes 366 72.9%
No 136 27.1%
Total 502 100%
Table 8. How much was spent for the following items BEFORE you arrived in Panama. Please only
report how much you spent for your share of travel expenses, and not the amount spent for any
others in your travel party.
% Assigned to Adjusted
Raw Mean
Panama Mean
Package trips or tours $1,329.12 50% $664.56
Airfare (commercial airlines, not including air
taxis to your fishing site) $839.16 25% $209.79
Charterboats (advance deposits) $207.20 50% $103.60
Other Panama-related purchases made prior
to departing home. $67.88 50% $33.94
$1,011.89
Primary purpose vs. Non-primary purpose trips: If a tourist would have still visited Panama even
if he or she could not fish, then only their expenditures directly related to sportfishing can be
assigned to this study. All other dollars likely would have been spent in Panama even if fishing
were not possible. Therefore, for visitors who would have visited Panama anyways, only their
expenditures for fishing-specific items such as charterboats, bait, boat fuel, tips to crew, etc. were
included in this analysis. For anglers who reported the primary purpose of their visit to Panama
was for Panama, all of their dollars spent within Panama were included. Adjustments for this
issue are presented next.
II.B.2 Expenditures Per Angler:
For primary-purpose anglers, the average expenditure within Panama was $2,266.34 (Table 9)
plus $737.67 spent before they left home, as presented in the previous section. For other visitors
who fished while in Panama, their average expenditure per trip was $424.51 which includes only
their “charterboat/fishing guide” and “fishing expenses”. For these individuals who did not visit
16for the primary reason to fish, recognizing 72.9% of them spent an average of $207.20 on
charters before departing for Panama, and just half of these funds are expected to accrue to
Panama, only $75.52 each can be assigned to this study as pre-paid fishing-related expenditures
per visitor.
Table 9.Approximately how much did you spend for the following items while IN Panama, or others spent for you?
Please do not report any expenditures made outside of Panama, or expenditures you made for others in your
travel party. Only report your share.
Mean Median Minimum Maximum Count
Transportation (car rental, taxis, buses, gasoline,
local flights, etc.) $400.67 $200.00 $0.00 $5,000.00 501
Charterboat fees, fishing guides $306.93 $30.00 $0.00 $10,000.00 501
Lodging: hotels, rental, camping, etc. $452.40 $95.00 $0.00 $10,000.00 502
Restaurants, bars, carry-out food $313.82 $200.00 $0.00 $5,000.00 502
Groceries, food, liquor bought in stores (not in
restaurants or bars) $225.41 $50.00 $0.00 $5,000.00 501
Gifts & souvenirs of any type $130.26 $25.00 $0.00 $3,000.00 502
Entertainment and amusement/admission fees $80.05 $0.00 $0.00 $2,000.00 502
Fishing expenses (except charters): tackle, ice, sun
screen, bait, and any other expenses
associated with your fishing trips $117.58 $0.00 $0.00 $5,000.00 501
Personal items (toiletries, clothes, medicine, etc.) $64.11 $0.00 $0.00 $2,000.00 502
Any other expenses made in Panama? (boating,
maintenance for a private house, etc.) $175.11 $0.00 $0.00 $15,000.00 501
TOTAL: $2,266.34
Considering the expenditures presented above, the average amounts spent per Panama angler are:
Anglers who visited for the primary reason to fish:
Proportion of expenditures made outside Panama that accrue to Panama = $ 737.67
Expenditures made in Panama = $2,266.34
Total, per visitor = $3,004.01
Anglers who would have visited Panama even if fishing was not accessible:
Proportion of expenditures made outside Panama that accrue to Panama = $ 75.52
Expenditures made in Panama = $424.51
Total, per visitor = $500.03
II.B.3 Total Expenditures in Panama by Visiting Anglers
The total expenditures attributable to Panama were next quantified. This was done by
multiplying the average expenditures per angler by the total number of anglers:
Visitors who fished while in Panama but did not come for the primary purpose of
fishing:
64,687 x $500.03 = $32,345,440
17Visitors who arrived specifically to fish:
21,563 x $3,004.01 = $64,775,468
TOTAL = $97,120,908 spent in Panama as a result of
sportfishing in 2011.
Recognizing the variances and various rounding errors associated with this estimate and the
economic model, $97 million was eventually assigned to the economic model.
II.C Economic Impacts Created by Sportfishing Tourists in Panama
The $97 million in estimated angler spending was applied to the economic model. Table 10
presents the results, which report sportfishing’s impacts to Panama’s economy. Table 11 reports
the size of Panama’s overall economy. By comparing both, sportfishing provides about 0.2% of
Panama’s GDP. Efforts to retain a greater portion of anglers’ dollars within Panama, rather than
let them leave the country to foreign suppliers, will help increase sportfishing’s GDP
contributions. This estimate can serve as a benchmark to track future enhancements to Panama’s
future sportfishing marketing and infrastructure improvements.
Table 10. Impact of the Sportfishing Sector on the National Economy
(in millions of dollars)
Purchases
Sales Impact GDP
Made in Direct Indirect
(retail and Contribution Tax Direct Indirect
Panama by Tax Tax Income
business-to- (Value Revenues Income Income
Visiting Revenues Revenues
business) Added)
Anglers
$97.0 $170.423 $48.500 $3.098 $1.617 $1.482 $66.82 $16.032 $50.790
(number of people)
Total Employment Direct Indirect
Employment Employment
9,503 1,347 8,156
Table 11. The Panamanian National Economy
(in millions of dollars) (number of people)
Total
Total Sales (retail GDP
Economic Retail Sales Tax
and business-to- Contribution Income Direct Employment
Multiplier Revenues
business) (Value Added)
1.6 $29,667.2 $50,326.4 $24,753.7 $2,525.5 $12,457.9 1,388,177
In summary, the $97 million spent in Panama by visiting anglers in 2011 generated significant
economic impacts:
o Total economic activity, or sales, generated within the economy = $170.4 million
o GDP contributions = $48.5 million
o Tax revenues = $3.1 million
Revenues earned from businesses directly serving anglers: $1.6 million
Revenues from those who support companies serving anglers: $1.5 million
18o Income (salaries, wages, income to business owners) = $66.8 million
Income earned by those directly serving anglers: $16.0 million
Income to those who support companies serving anglers: $50.8 million
o Employment = 9,503
Employment in companies that directly serve anglers: 1,347
Employment in companies who support businesses serving anglers: 8,156
II.D Characteristics, Motivations and Preferences of Panama’s Visiting Anglers
This section describes Panama’s sportfishing ecotourists, their motivations and preferences
driving their choice of sportfishing destinations. This type of information is critical when
developing marketing strategies and identifying the fisheries policies and infrastructure
improvements necessary to sustainably grow Panama’s sportfishing industry. Please note that the
survey targeted North American flights. To the extent anglers flew other routes they are not
included in this study. Surveys of non-North American flights found very low rates of angling
participation among its passengers.
Please note that “N”, when listed in the header of the tables below, refers to the number of people
who answered to each item during the airport survey.
More than three-quarters of all Panama visitors (not just anglers) surveyed were from the United
States (Table 12). Please note that surveys concentrated on flights to North America, based on
feedback during the interview stage that the vast majority of anglers in Panama are North
American.
Table 12. What is your country or region of citizenship?
N Percent
U.S. 4,978 66%
Canada 884 12%
Mexico 88 1%
Central America 187 2%
South American 415 5%
Europe 704 9%
Caribbean: 86 1%
Other 222 3%
Total 7,564 100%
Table 13 shows us that a percentage of travelers to Panama visit frequently. Note that the mean is
nearly three times larger than the median number of previous visits, indicating a minority visit
frequently and likely own real estate or time share in Panama. This topic is explored later. A
distribution of responses is provided in Table 14.
19Table 13. Prior to this trip, how many times have you visited Panama?
Mean* Median Minimum Maximum N
3.76 1 0 100 7,547
*Values greater than 100 were not included in this average calculation
Table 14. Number of anglers by number of previous trips to Panama
Percent Cumulative %
None 37.9% 37.9%
1 to 5 44.5% 82.4%
6 to 10 9.6% 92.0%
11 to 20 5.2% 97.2%
21 to 30 1.2% 98.4%
31 to 40 0.4% 98.8%
41 to 50 0.4% 99.2%
51 to 75 0.2% 99.4%
76 to 100 0.4% 99.8%
Greater than 100 0.2% 100.0%
Total 100%
Table 15 shows the variety of ways visitors spend their time and money while in Panama, with a
breakout showing the countries of residence for Panama’s visting anglers. Sportfishing is
common with 8.7 percent of visitors, comparable with surfing.
Table 15. Please mark all activities you participated in during this trip
Count Percent
Shopping 3,766 49.8%
Relaxed on a beach 3,384 44.7% Country of origin distribution
Nature tours - wildlife viewing 2,944 38.9% among those reporting sport
Family - Friends - Wedding 2,086 27.6% fishing as an activity?
Business 1,900 25.1% Count Percent
Hiking 1,394 18.4% U.S. 106 67.5%
Other 851 11.3% Canada 20 12.7%
Sailing-boating (not fishing) 704 9.3% Mexico 2 1.3%
Sportfishing 659 8.7% C. America 9 5.7%
Surfing 657 8.7% S. America 5 3.2%
SCUBA diving 365 4.8% Europe 13 8.3%
Zip lining 314 4.2% Caribbean: 1 0.6%
Golf 296 3.9% Other 1 0.6%
Horseback riding 274 3.6% Total 157 100%
20Though the rate of sportfishing participation is low, nearly 85% of those surveyed expressed an
interest in angling during future visits to Panama (Table 16), indicating a huge potential to
increase sportfishing in Panama and its associated dollars and jobs.
Table 16. On a future trip to Panama, would sport fishing be of interest to you?
Count Percent
Yes 2,271 30%
No 3,645 48%
Not sure 1,521 20%
I do not plan to visit Panama again 127 2%
Total 7,564 100%
The rest of the information in this section covers only anglers. The data were taken from the
section of the Tocumen Airport survey that was only administered to people who reported fishing
on the trip to Panama.
Table 17 shows that approximately 10% of visiting anglers either own a house or condo in
Panama, or own timeshare, while nearly the same percentage own a boat (Table 18). These
results indicate a high level of interest and investment potential Panama provides to foreign
anglers. This minority of anglers likely stays long periods of time and help increase the mean
number of visits reported in Table 13.
Table 17. Do you use timeshare or own a house in Panama?
N Percent
No 450 89.6%
Yes 52 10.4%
Total 502 100%
Table 18. Do you own or maintain a boat in Panama?
N Percent
Yes 53 10.6%
No 449 89.4%
Total 502 100%
Panama is providing visitors with quality fishing experiences. Upon leaving Panama, over 87%
of visiting anglers reported being satisfied or very satisfied with their fishing experience (Table
19). This number will be useful in helping convince other anglers to visit Panama.
21Table 19. How satisfied were you with your fishing experience in Panama?
N Percent
Very satisfied 226 45.0%
Satisfied 213 42.4%
Unsatisfied 51 10.2%
Very unsatisfied 12 2.4%
Total 502 100%
Recommendations from friends and family are the best way to increase the number of anglers
visiting Panama. The previous chart showed high rates of satisfaction, which is the most
important way to ensure positive recommendations are given to potential new anglers. Increasing
media coverage of Panama’s sportfishing opportunities is the second most important way to
attract more sportfishing ecotourists to Panama (Table 20).
Table 20. Which sources of information do you think influenced you?
N Percent
Friends or family recommendations 344 68.5%
Articles in outdoor or fishing media, including internet sites 121 24.1%
Articles in non-outdoor, non-fishing media and internet sites 18 3.6%
Travel agent 30 6.0%
Fishing club - other social or recreational group I belong to 33 6.6%
Other 45 9.0%
Tables 21-23 present demographic data on Panama’s visiting anglers. As might be expected, the
anglers surveyed tended to have higher incomes. The majority of survey respondents were
middle-aged, with 64.9% between the ages of 40 and 65, and 87% were male.
Table 21. Angler total annual household income, before taxes.
N Percent
Less than $20,000 19 3.8%
$20,000 - $50,000 51 10.2%
$50,000 - $75,000 85 16.9%
$75,000 - $100,000 101 20.1%
$100,000 - $150,000 110 21.9%
$150,000 - $250,000 70 13.9%
More than $250,000 63 12.5%
Other Currency 3 0.6%
Total 502 100%
22Table 22. Age Group
N Percent
Under 21 9 1.8%
21 to 39 102 20.3%
40 to 55 168 33.5%
55 to 65 159 31.7%
65+ 64 12.7%
Total 502 100%
Table 23. Gender of Respondent
N Percent
Male 437 87.1%
Female 65 12.9%
Total 502 100%
Compared to all visitors to Panama (Tables 13 vs Table 24), anglers are much more likely to
return to Panama again (3.76 visits for all visitors versus 5.9 visits for anglers), indicating anglers
may provide higher long term returns on tourism marketing investments. Table 25 reports the
distribution of anglers across different numbers of trips.
Table 24. Prior to this trip, how many times have you visited Panama?
Mean* Median Minimum Maximum* N
Visits 5.9 2 0 100 501
*Keeping consistency with screener question outliers, values greater than 100 were not
included in this average
Table 25. Prior to this trip, how many times have you visited Panama?
N Percent
None 154 30.7%
1 to 5 213 42.5%
6 to 10 62 12.4%
11 to 20 52 10.4%
21 to 30 8 1.6%
31 to 40 4 0.8%
41 to 50 3 0.6%
51 to 75 1 0.2%
76 to 100 4 0.8%
Total 501 100%
23Table 26 shows that anglers want to do more than just fish while in Panama. Sportfishing
promotions should show and explain the other recreational activities available to anglers and,
recognizing not all members of anglers’ travel parties will fish, activities available to all.
Relaxing and enjoying Panama’s nature and wildlife are the top two activities enjoyed by anglers
after sportfishing. Anglers are attracted to Panama’s nature-based opportunities, making them
ecotourists.
Table 26. Other activities enjoyed by Panama's visiting anglers
N Percent
Nature tours / wildlife viewing 227 45.2%
Shopping 221 44.0%
Horseback riding 35 7.0%
Sport fishing 502 100.0%
Sailing/boating (not fishing) 93 18.5%
SCUBA diving 58 11.6%
Surfing 67 13.3%
Hiking 120 23.9%
Relaxed on a beach / Enjoy sun & weather 278 55.4%
Golf 29 5.8%
Zip lining 29 5.8%
Business 65 12.9%
Family / Friends / Wedding 158 31.5%
Other 20 4.0%
II.E Preferences and Motivations Among All U.S. Anglers Who Fish Internationally
The previous section described the characteristics and economic impact from anglers who have
already visited Panama. This section explores how Panama can increase visits from U.S. anglers
who have not yet visited Panama. The results were derived from a survey of U.S. anglers
conducted in 2012 by Southwick Associates, as described in Section I.
According to the U.S. Fish and Wildlife Service, 33.1 million Americans fished in 2011, which
is 9.5 times larger than the population of Panama (CIA World Factbook). Of these anglers, only
about 17%, or 5.6 million, have fished at least once outside of the U.S. in the past five years
(Table 27), with 43% having fished in Canada (Table 28). Excluding the visitors to Canada, the
pool of traveling U.S. anglers is at least 3.2 million anglers. Two and a half times more of these
anglers fished in Costa Rica compared to Panama, despite the similarities in each country’s size
and fisheries.
Table 27. Have you fished outside of the U.S. within the past five years?
Percent
Yes 17.3%
No 82.7%
Total 100.0%
N=2636
24Table 28. The country most recently fished
Location Percent
Canada 43.6%
Mexico 33.6%
Costa Rica 6.5%
Caribbean 5.3%
Europe (including the United Kingdom) 5.2%
Bahamas 5.1%
Other Central American countries 3.6%
Panama 2.6%
South America (ex Brazil, listed below) 2.2%
Africa 2.0%
Australia/New Zealand 2.0%
Asia 1.1%
Pacific islands (except Hawaii) 1.0%
Brazil 0.7%
Russia 0.5%
Bermuda 0.3%
Other, not listed here* 6.3%
Total number of responses N=444
Nearly two-thirds of respondents stated that the most important reason for selecting a particular
angling destination was the quality of fishing (Table 29). Maintaining high stock abundance is a
key manner of achieving high fishing quality. This clearly underlines the importance of
maintaining abundant and sustainable sportfisheries above all else in the quest to attract more
anglers and keep them coming back. Panama’s natural setting and climate is also a major draw.
Price is important, but only has half the importance as providing quality sportfishing. Nice
amenities, safety and other factors are also important to address when trying to boost sportfishing
in Panama.
25Table 29. Regarding your most recent fishing trip in another country, please rate how important each one of
the following reasons was in your selection of that country:
Major
reason why
Not a ------------------------------------ you
reason selected Average
at all this country Rating N
1 2 3 4 5
Quality of local fishing
opportunities 6.5% 3.6% 9.8% 14.6% 65.4% 4.29 N=438
Climate, natural
environment (wildlife,
scenery, landscape) 10.9% 7.6% 19.4% 20.8% 41.3% 3.74 N=432
Price 13.6% 11.5% 25.5% 19.3% 30.1% 3.41 N=429
Resort/lodge amenities
(beach, natural setting,
bars, etc ) 22.9% 10.7% 21.6% 16.6% 28.2% 3.17 N=416
Feeling of security and
safety 20.8% 14.0% 20.5% 18.5% 26.2% 3.15 N=424
Local culture 25.4% 17.7% 24.4% 12.5% 20.0% 2.84 N=430
Quality and availability
of good charter boats
and crew, or guides 32.6% 15.0% 12.6% 16.6% 23.1% 2.83 N=413
Other outdoor activities
besides fishing 35.8% 15.5% 14.3% 13.9% 20.5% 2.68 N=410
Had friends or family
there 62.8% 5.3% 9.3% 6.4% 16.3% 2.08 N=383
Nightlife 63.6% 13.0% 10.0% 5.3% 8.2% 1.81 N=401
American anglers who fished outside of the U.S. report high levels of satisfaction (Table 30).
These satisfaction levels are very similar to the satisfaction levels reported by Panama’s anglers
(Table 19), indicating the fishing experiences offered by Panama are no better or worse than in
other common fishing destinations. A perception among U.S. anglers that the quality of
Panama’s fisheries has declined below other countries may cause a drop in sportfishing tourism,
based on the importance of quality fishing as a reason for selecting a country to visit.
Table 30. Considering the time and expense required for your recent trip, please rate
how satisfied you were with your overall experience.
Rating Percent
1 (Not satisfied at all) 2.3%
2 2.3%
3 9.4%
4 37.3%
5 (Very satisfied) 48.7%
Total 100.0%
Average Rating 4.28
Total number of responses N=435
26The survey examined the potential impacts that various fisheries management approaches, both
commercial and sport, would have on anglers’ decisions to return to their preferred fishing
destination (Table 31). Granting anglers more fish via increased limits would only increase
interest in returning for a minority of anglers. The reverse is actually more effective: a greater
number of anglers would be encouraged to return if limits were tightened, meaning anglers
would be required to keep less fish. Knowing that commercial fishing was reduced for species
popular with visiting anglers would encourage just over half to return again. Increased
commercial harvests are not as large a factor, but over half of U.S. anglers said they were not
likely to return or not sure if they would if they knew commercial harvests were increased. These
responses emphasize the importance of traveling anglers’ perceptions of what is occurring in a
given destination. Attracting more visting anglers can be a product of changing their impressions
of how Panama is maintaining healthy and abundant sport fishing resources.
Table 31. Would you be more or less likely to return if you knew:
Commercial Bag limits for Bag limits for
Commercial harvest of gamefish were gamefish were
harvest of gamefish was recently recently
gamefish recently recently tightened, loosened,
began or restricted or meaning fewer meaning you
increased since stopped are being can keep more
your last visit completely harvested fish than before
Not likely to return 37.1% 6.8% 11.5% 8.2%
Would not affect my decision 33.4% 34.5% 46.1% 51.9%
Likely to return 12.5% 50.6% 34.5% 26.4%
Not sure 17.0% 8.2% 7.9% 13.5%
Column Total 100.0% 100.0% 100.0% 100.0%
Total number of responses N=443 N=442 N=442 N=441
Table 32 shows Panama’s primary competition for the respondents’ angling travel dollar.
Anglers were asked which country they currently prefer to visit and fish. Table 28 reported only
2.6% of U.S. anglers who have visited other countries to fish had actually visited Panama.
However, Table 32 shows eight times more are interested in visiting Panama. If expenditures per
angler remained consistent, this would represent $776 million more in new dollars for the
Panamanian economy that potentially exists in the international angling tourism market.
27Table 32. Of the following locations only, which one would you prefer to fish if you had
the opportunity:
Location Percent
South Florida 35.5%
Costa Rica 28.6%
Panama 16.0%
Mexico 18.9%
Bahamas 14.2%
No preference 10.2%
I would not fish any of these locations 4.3%
Total number of responses N=446
Table 33 shows the reasons why anglers preferred some destinations over others. As seen before,
the perception that the fishing is good is the most important reason why an angler chooses to visit
a specific location, and is cited three times more frequently than the second ranked reason (travel
costs). This finding emphasizes the need to maintain healthy and sustainable fisheries.
Table 33. Please tell us why you chose that location as your preferred destination?
Reason Percent
I understand the fishing is great 68.1%
Cost of travel 23.0%
Less hassle to get there and fish there 20.7%
I would feel more comfortable and more secure there 17.3%
I have friends there or other reasons to travel there 15.9%
Other, please tell us why* 15.5%
I understand it has stronger conservation laws and practices 7.1%
Total number of responses N=428
Not all anglers have the same preferences. Anglers who are more concerned about costs, hassles
and secrurity in large will stay in the U.S. and fish in South Florida and to a degree, the Bahamas
(Table 34). The other traveling U.S. anglers, which represent roughly half of the U.S.
sportfishing market available to Panama (approximately 3 million anglers), overwhelmingly base
their choice on how they perceive the quality of fishing and are more likely to visit Panama and
other regional countries. Even if Panama’s fishing is better than other locations, perception is the
key. If anglers hear from others the fishing is not good, they will likely choose to visit and fish
somewhere else.
28Table 34. Characteristics of Panama's Sportfishing Tourism Industry Compared to Other Nations
Of the following locations only, which one would you prefer
to fish if you had the opportunity:
Please tell us why you chose that location as your South Costa
preferred destination? Florida Rica Panama Mexico Bahamas
Cost of travel 40.9% 8.5% 9.4% 26.0% 21.0%
Less hassle to get there and fish there 40.6% 7.2% 7.3% 19.1% 18.5%
I would feel more comfortable and more secure
there 29.2% 15.3% 3.9% 8.1% 21.8%
I understand the fishing is great 57.8% 79.9% 71.5% 82.9% 68.1%
I understand it has stronger conservation laws and
practices 5.2% 8.5% 10.3% 0.8% 10.0%
I have friends there or other reasons to travel there 20.2% 12.9% 15.9% 20.5% 6.6%
Other, please tell us why:* 14.2% 7.5% 18.3% 22.4% 25.5%
Total number of responses N=163 N=133 N=56 N=71 N=58
29You can also read