STATE OF THE CLIMATE IN 2019 - Special Supplement to the Vol. 101, No. 8, August 2020 - American ...
←
→
Page content transcription
If your browser does not render page correctly, please read the page content below
Downloaded from http://journals.ametsoc.org/bams/article-pdf/101/8/S1/4988915/2020bamsstateoftheclimate_intro.pdf by guest on 16 September 2020
STATE OF THE CLIMATE

                                                                                                                                                                    Bulletin of the American Meteorological Society
                                                                                                                                                                              Vol. 101, No. 8, August 2020
                                                                                                                                                                               Special Supplement to the
       IN 2019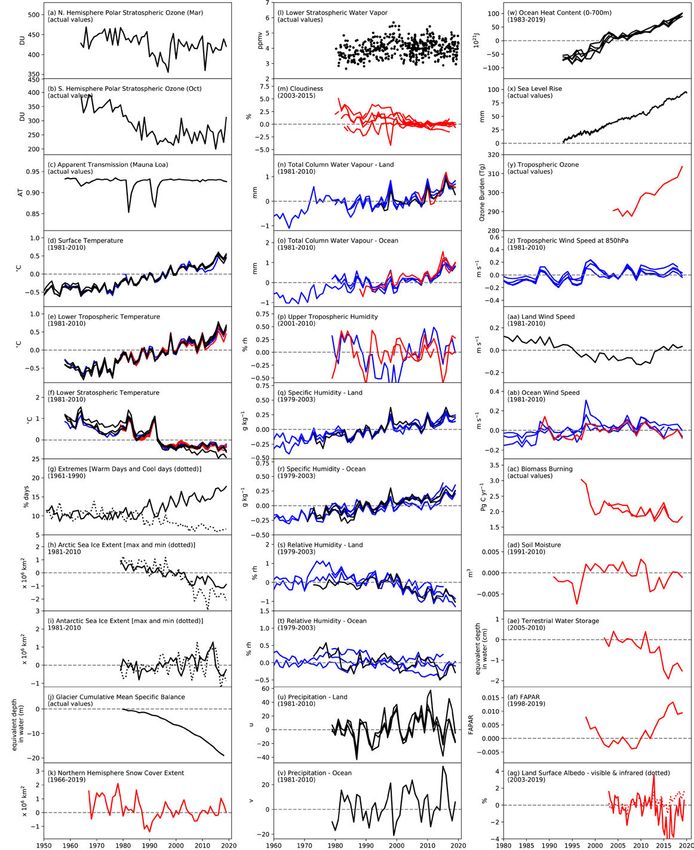
Cover credit: Kangaroo silhouette looking a fire in Australia forests. Australian wildlife in bushfires
2019 and 2020. Credit: Benny Marty iStock / Getty Images Plus; Location: Australia / via Getty Images

How to cite this document:                                                                                                  Downloaded from http://journals.ametsoc.org/bams/article-pdf/101/8/S1/4988915/2020bamsstateoftheclimate_intro.pdf by guest on 16 September 2020

Citing the complete report:
Blunden, J. and D. S. Arndt, Eds., 2020: State of the Climate in 2019. Bull. Amer. Meteor. Soc.,
101 (8), Si–S429 https://doi.org/10.1175/2020BAMSStateoftheClimate.1

Special Online Supplement to the Bulletin of the American Meteorological Society, Vol.101, No.
8, August, 2020

https://doi.org/10.1175/2020BAMSStateoftheClimate.1
Corresponding author: Full report: Jessica Blunden / jessica.blunden@noaa.gov
©2020 American Meteorological Society
For information regarding reuse of this content and general copyright information, consult the AMS Copyright Policy.

   AU G U S T 2 0 2 0 | S t a t e o f t h e C l i m a t e i n 2 0 1 9                                                  Si
STATE OF THE CLIMATE IN 2019
                                       TABLE OF CONTENTS
Abstract ..........................................................................................................Siii

1. Introduction....................................................................................................S1

                                                                                                                                Downloaded from http://journals.ametsoc.org/bams/article-pdf/101/8/S1/4988915/2020bamsstateoftheclimate_intro.pdf by guest on 16 September 2020
2. Global Climate................................................................................................S9

3. Global Oceans............................................................................................ S129

4. The Tropics .................................................................................................S185

5. The Arctic ...................................................................................................S239

6. Antarctica and the Southern Ocean.........................................................S287

7. Regional Climates.......................................................................................S321

8. Relevant Datasets and Sources ................................................................S421

   AU G U S T 2 0 2 0 | S t a t e o f t h e C l i m a t e i n 2 0 1 9                                                     Sii
ABSTRACT—J. BLUNDEN AND D. S. ARNDT
In 2019, the dominant greenhouse gases released into mean sea ice extent record. The Antarctic ice sheet continued
Earth’s atmosphere continued to increase. The annual global to lose mass, with the highest rates of loss occurring in West
average carbon dioxide concentration at Earth’s surface was Antarctica and Wilkes Land, East Antarctica.
409.8 ± 0.1 ppm, an increase of 2.5 ± 0.1 ppm over 2018, and Across the cryosphere, alpine glaciers continued to lose mass
the highest in the modern instrumental record and in ice core for the 32nd consecutive year. Permafrost temperatures in the
records dating back 800 000 years. Combined, greenhouse European Alps were slightly below the record temperatures
gases and several halogenated gases contributed 3.14 W m−2 measured in 2015, while record high permafrost temperatures
to radiative forcing, representing a 45% increase since 1990. were observed at a majority of the observation sites across the
Carbon dioxide is responsible for about 65% of this radiative high northern latitudes. For the first time in the observational
forcing. The annual net global uptake of ~2.4 billion metric record at 26 sites in interior Alaska and the Seward Peninsula,
Downloaded from http://journals.ametsoc.org/bams/article-pdf/101/8/S1/4988915/2020bamsstateoftheclimate_intro.pdf by guest on 16 September 2020
tons of carbon dioxide by oceans was the highest in the record the active layer did not freeze completely, a result of long-term
dating to 1982 and 33% higher than the 1997–2017 average. permafrost warming and back-to-back relatively mild and
A weak El Niño at the beginning of 2019 transitioned to snowy winters.
ENSO-neutral conditions by mid-year. Even so, the annual In March, when Arctic sea ice reached its annual maximum
global surface temperature across land and oceans was still extent, thin, first-year ice comprised ~77% of all ice, compared
among the three highest in records dating to the mid- to late to about 55% in the 1980s. In September, the minimum sea ice
1800s. July 2019 was Earth’s hottest month on record. Well extent tied for the second smallest extent in the 41-year satel-
over a dozen countries across Africa, Europe, Asia, Australia, lite record. In the Bering Sea, increasing ocean temperatures
and the Caribbean reported record high annual temperatures. and reduced sea ice—which was the lowest on record there
In North America, Alaska experienced its warmest year on for the second consecutive winter—are leading to shifts in fish
record, while the high northern latitudes that encompass the distributions within some of the most valuable fisheries in the
Arctic were second warmest, behind only 2016. Stations in world. Larger and more abundant boreal species, as opposed
several countries, including Vietnam, the Netherlands, Belgium, to smaller and less abundant Arctic species, dominated a large
Luxembourg, France, and the United Kingdom, set new all-time portion of the Arctic shelf in 2018 and 2019.
daily high temperature records for their nations. Australia set During the 2019 melt season, the extent and magnitude of
a new nationally averaged daily maximum temperature record ice loss over the Greenland ice sheet rivaled 2012, the previous
of 41.9°C on 18 December, breaking the previous record set in year of record ice loss. Melting of glaciers and ice sheets, along
2013 by 1.6°C. Daily temperatures surpassed 40°C for the first with warming oceans, account for the trend in rising global
time in Belgium and the Netherlands. mean sea level.
Lake temperatures increased on average across the globe In 2019, global mean sea level set a new record for the eighth
in 2019; observed lakes in the Northern Hemisphere were consecutive year, reaching 87.6 mm above the 1993 average
covered in ice seven days fewer than the 1981–2010 average, when satellite measurements began, with an annual average
according to phenological indicators. Over land, the growing increase of 6.1 mm from 2018. Ocean heat content measured
season was an average of eight days longer than the 2000–10 to 700 m depth was record high, and the globally averaged
average in the NH. sea surface temperature was the second highest on record,
Above Earth’s surface, the annual lower troposphere tem- surpassed only by the record El Niño year of 2016. In October,
perature was third highest to record high, and the lower strato- the Indian Ocean dipole exhibited its greatest magnitude since
sphere temperature was third lowest to record low, depending 1997, associated with dramatic upper ocean warming in the
on the dataset analyzed. Middle- and upper-stratospheric western Indian Ocean basin.
temperatures were lowest on record since satellite records be- While ENSO conditions during 2019 appeared to have limited
gan in 1979. In September, Antarctica experienced a dramatic impacts, many climate events were influenced by the strong
upper-atmosphere warming event that led to the smallest ozone positive IOD, which contributed to a large rainfall deficit from
hole since the early 1980s. the eastern Indian Ocean to the South Pacific Ocean east of
Below-average Antarctic sea ice extent persisted throughout Australia. Record heat and dryness in Australia intensified
2019, continuing a trend that began in September 2016. Net drought conditions already in place following below-average
sea ice extent was below the 1981–2010 average for all days rainfall in 2017 and 2018, leading to severe impacts during late
of the year, and January and June each set a new low monthly austral spring and summer, including catastrophic wildfires.
AU G U S T 2 0 2 0 | S t a t e o f t h e C l i m a t e i n 2 0 1 9 SiiiSmoke from these wildfires, along with the volcanic eruptions scorched vast areas of the southern Amazonian forests in
of Raikoke (Russia) and Ulawun (Papua New Guinea), helped Bolivia, Brazil, and Peru, as well as in northern Paraguay, later
load the stratosphere with aerosol levels unprecedented since in 2019. Millions of trees and animals perished, with some local
the post-Mt. Pinatubo era of the early 1990s. Indonesia also extinctions reported. In Siberia, fire activity during the sum-
suffered severe drought and extreme wildfires toward the end mer was both strong and farther north than usual. This led to
of 2019; no rainfall was observed in the East Sumba District of a new record of 27 teragrams (1012 g) of carbon emitted from
the East Nusa Tenggara Province for 263 days. fires in the Arctic, which was more than twice as high than in
Conversely, the positive IOD also contributed to excess any preceding year.
rainfall over the Horn of Africa from August through December, Closer to the equator, 96 named tropical storms were ob-
resulting in widespread flooding across East Africa. Elsewhere, served during the Northern and Southern Hemisphere storm
India experienced one of its heaviest summer monsoon rains seasons, well above the 1981–2010 average of 82. Five tropical
since 1995 despite a delayed and suppressed monsoon during cyclones reached Saffir–Simpson scale Category 5 intensity.
Downloaded from http://journals.ametsoc.org/bams/article-pdf/101/8/S1/4988915/2020bamsstateoftheclimate_intro.pdf by guest on 16 September 2020
June. In the United States, rapid snowmelt in the spring, as well In the North Atlantic basin, Hurricane Dorian caused unprec-
as heavy and frequent precipitation in the first half of the year, edented and tremendous devastation, with over 70 fatalities
contributed to extensive flooding in the Midwest throughout and damages totaling $3.4 billion (U.S. dollars) in The Bahamas.
spring and summer, notably the Mississippi and Missouri basins. Tropical Cyclones Idai and Kenneth severely impacted south-
Dry conditions persisted over large parts of western South eastern Africa in March and April, respectively. Idai resulted in
Africa, in some locations having continued for approximately total damages of at least $2.2 billion (U.S. dollars), the costli-
seven years. Antecedent dry conditions and extreme summer est storm on record for the South Indian Ocean basin, as well
heat waves pushed most of Europe into extreme drought. as the deadliest with over 1200 fatalities across Mozambique,
Due in part to precipitation deficits during December 2018 Zimbabwe, Malawi, and Madagascar.
to January 2019—the peak of the rainy season—wildfires
AU G U S T 2 0 2 0 | S t a t e o f t h e C l i m a t e i n 2 0 1 9 SivSTATE OF THE CLIMATE IN 2019
INTRODUCTION
Downloaded from http://journals.ametsoc.org/bams/article-pdf/101/8/S1/4988915/2020bamsstateoftheclimate_intro.pdf by guest on 16 September 2020
The countries highlighted in blue indicate each of the 61 nations contributing an author and/or chapter editor to the State
of the Climate in 2019.
Citing this chapter: Arndt, D. S., J. Blunden, and R. J. H. Dunn. 2020: Introduction [in “State of the Climate in 2019"].
Bull. Amer. Meteor. Soc., 101 (8), S1–S8, https://doi.org/10.1175/2020BAMSStateoftheClimate_Intro.1.
Special Supplement to the Bulletin of the American Meteorological Society, Vol.101, No. 8, August, 2020
The Introduction is one chapter from the State of the Climate in 2019 annual report. Compiled by NOAA’s National
Centers for Environmental Information, State of the Climate in 2019 is based on contributions from scientists from
around the world. It provides a detailed update on global climate indicators, notable weather events, and other
data collected by environmental monitoring stations and instruments located on land, water, ice, and in space. The
full report is available from https://doi.org/10.1175/2020BAMSStateoftheClimate.1.
https://doi.org/10.1175/2020BAMSStateoftheClimate_Intro.1
Corresponding author, Introduction: Jessica Blunden / jessica.blunden@noaa.gov
©2020 American Meteorological Society
For information regarding reuse of this content and general copyright information, consult the AMS Copyright Policy.
AU G U S T 2 0 2 0 | S t a t e o f t h e C l i m a t e i n 2 0 1 9 1. INTRODUCTION S1STATE OF THE CLIMATE IN 2019
Introduction
Editors
Jessica Blunden
Derek S. Arndt
Downloaded from http://journals.ametsoc.org/bams/article-pdf/101/8/S1/4988915/2020bamsstateoftheclimate_intro.pdf by guest on 16 September 2020
Chapter Editors
Peter Bissolli
Howard J. Diamond
Matthew L. Druckenmiller
Robert J. H. Dunn
Catherine Ganter
Nadine Gobron
Rick Lumpkin
Jacqueline A. Richter-Menge
Tim Li
Ademe Mekonnen
Ahira Sánchez-Lugo
Ted A. Scambos
Carl J. Schreck III
Sharon Stammerjohn
Diane M. Stanitski
Kate M. Willett
Technical Editor
Andrea Andersen
BAMS Special Editor for Climate
Richard Rosen
American Meteorological SocietyEditor and Author Affiliations (alphabetical by name)
Arndt, Derek S., NOAA/NESDIS National Centers for Environmental
Information, Asheville, North Carolina
Blunden, Jessica, NOAA/NESDIS National Centers for Environmental
Information, Asheville, North Carolina
Dunn, Robert J. H., Met Office Hadley Centre, Exeter, United Kingdom
Editorial and Production Team
Andersen, Andrea, Technical Editor, Innovative Consulting Management Misch, Deborah J., Graphics Support, Innovative Consulting Management
Services, LLC, NOAA/NESDIS National Centers for Environmental Services, LLC, NOAA/NESDIS National Centers for Environmental
Information, Asheville, North Carolina Information, Asheville, North Carolina
Downloaded from http://journals.ametsoc.org/bams/article-pdf/101/8/S1/4988915/2020bamsstateoftheclimate_intro.pdf by guest on 16 September 2020
Griffin, Jessicca, Graphics Support, Cooperative Institute for Satellite Earth Riddle, Deborah B., Graphics Support, NOAA/NESDIS National Centers for
System Studies, North Carolina State University, Asheville, North Carolina Environmental Information, Asheville, North Carolina
Hammer, Gregory, Content Team Lead, Communications and Outreach, NOAA/ Veasey, Sara W., Visual Communications Team Lead, Communications and
NESDIS National Centers for Environmental Information, Asheville, North Outreach, NOAA/NESDIS National Centers for Environmental Information,
Carolina Asheville, North Carolina
Love-Brotak, S. Elizabeth, Lead Graphics Production, NOAA/NESDIS National
Centers for Environmental Information, Asheville, North Carolina
AU G U S T 2 0 2 0 | S t a t e o f t h e C l i m a t e i n 2 0 1 9 1. INTRODUCTION S31. INTRODUCTION—D. S. Arndt, J. Blunden, and R. J. H. Dunn
This is the 30th edition of what is now known as the State of the Climate report, marking a
30-year period of record for a document that routinely uses 30-year base periods to help contex-
tualize today’s climate. Compared to that 30-year record, this 2019 edition is the richest report in
the series, well above climatological averages, and indeed setting records for climate variables
tracked and for author participation. This year, 528 authors and editors contributed to the report,
Downloaded from http://journals.ametsoc.org/bams/article-pdf/101/8/S1/4988915/2020bamsstateoftheclimate_intro.pdf by guest on 16 September 2020
together representing 61 countries, including for the first time in this series’ history authors from
the nations of Georgia and Vietnam.
One of the touchpoints of 2019’s climate—the Indian Ocean—may turn the globe upside-down
for our North American readership. The body of water, cleaved into distinct halves marked by
the strongest Indian Ocean Dipole in more than two decades, behaved as something of a center
of gravity in this report, as many of the extremes and related phenomena seemed to emanate
from it. The strength of its signal was seen throughout the system and throughout this report: in
nuisance flooding and unusual chlorophyll concentrations in and around the basin; in unprec-
edented tropical cyclone activity in the Arabian Sea; as historic fire and drought in Australia;
and in back-to-back devastating tropical cyclones in southeast Africa.
In early 2020, our community was likewise turned upside-down, but on a personal level,
with the passing of New Zealand’s Brett Mullan, himself an accomplished contributor to the
understanding of Southern Hemisphere climate and variability, but also a beloved contributor
to the Tropics chapter for many years. Its editors have memorialized his contributions and their
appreciation in the chapter introduction.
It was also in early 2020 when a global contagion turned upside-down the professional worlds
of our many authors and editors, who crafted and shaped their contributions in a much differ-
ent way, and from much different settings, than anticipated. In an era for which “isolation” took
on widespread new contexts, we are forever thankful for the connections among these authors,
editors, their expertise, and their dedication to publishing this most comprehensive annual di-
agnostic of the climate system available.
In service to them, the State of the Climate report has taken several steps to acknowledge the
importance of our diverse authorship. The report will now be catalogued as independent chap-
ters, allowing for more full recognition of authorship in the various citation indices. Each of
these chapters now has its own cover image, most of which were provided by an author in that
very chapter. Finally, the public rollout of this manuscript in the Northern Hemisphere summer
of 2020 will consciously attempt to increase awareness of the authors and chapter editors that
drive this report.
As is the case every year, several chapter editors have chosen to make adjustments to their
chapter’s roster and organization of content. This may be to take advantage of analyses made
newly available to this report, such as the global lake water levels section and marine heat waves
analyzed in Chapter 2; and the polar chapters’ commissioning of sections on non-Greenlandic ice
in the Arctic, and changes and trends in the Antarctic ice sheet. In some cases, data availability
does not allow every-year analysis in this report, requiring occasional appearances. These fac-
tors explain the return of the Mauna Loa solar transmission record to the global chapter and the
Atlantic Meridional Overturning Circulation to the oceans chapter, and this year’s exclusion of
Arctic-specific river discharge.
AU G U S T 2 0 2 0 | S t a t e o f t h e C l i m a t e i n 2 0 1 9 1. INTRODUCTION S4This year, for the first time in the supplement’s 30-year history and in the spirit of minimizing
our own impact on climate change, the report is published in digital format only. The general
layout, however, remains largely the same. An overview of findings is presented in the Abstract,
Fig. 1.1, and Plate 1.1. Chapter 2 features global-scale climate variables; Chapter 3 highlights the
global oceans; and Chapter 4 discusses tropical climate phenomena including tropical cyclones.
The Arctic and Antarctica respond differently through time and are reported in separate chapters
(5 and 6, respectively). Chapter 7 provides a regional perspective authored largely by regional
government climate specialists. A list of relevant datasets and their sources for all chapters is
provided as an Appendix. Authors, acknowledgments, and references are now listed with each
individual chapter.
Time series of major climate indicators are again presented in this introductory chapter. Many
of these indicators are essential climate variables, originally defined in GCOS (2003) and updated
Downloaded from http://journals.ametsoc.org/bams/article-pdf/101/8/S1/4988915/2020bamsstateoftheclimate_intro.pdf by guest on 16 September 2020
again by GCOS (2010). As their name indicates, these variables are essential for a full understand-
ing of the changing climate system. However, some of them are not available on the immediate
timescales of this report, and others, particularly those dealing with the living world, are outside
the scope of this report.
Acknowledgments
The editors thank the BAMS editorial staff, in particular Bryan Hanssen, who provided technical guidance,
oversaw publication of the report, and helped us shepherd the report into a new digital publishing era, Hannah
Kleppner, who provided peer review support, and Nicole Rietmann, who oversaw the hundreds of citations
and references this year, and the NCEI Graphics team for facilitating the construction of the report and execut-
ing the countless number of technical edits needed. We thank our technical editor Andrea Andersen for her
dedication and attention to detail. We also express our gratitude to Dr. Rick Rosen, who again served as the
AMS special editor for this report. Finally, we thank all of the authors and chapter editors who provide these
valuable contributions each year, always with an aim to improve and expand their analyses for the readers.
AU G U S T 2 0 2 0 | S t a t e o f t h e C l i m a t e i n 2 0 1 9 1. INTRODUCTION S5Essential Climate Variables—D. S. ARNDT, J. BLUNDEN, AND R. J. H. DUNN
The following variables are considered fully monitored in this report, in that there are sufficient spatial and temporal data, with
peer-reviewed documentation to characterize them on a global scale:
• Surface atmosphere: air pressure, precipitation, temperature, water vapor, wind speed and direction
• Upper atmosphere: Earth radiation budget, temperature, water vapor, wind speed and direction
• Atmospheric composition: carbon dioxide, methane and other greenhouse gases, ozone
• Ocean physics: ocean surface heat flux, sea ice, sea level, surface salinity, sea surface temperature, subsurface salinity,
subsurface temperature, surface currents, surface stress
• Ocean biogeochemistry: ocean color
• Ocean biogeosystems: plankton
Downloaded from http://journals.ametsoc.org/bams/article-pdf/101/8/S1/4988915/2020bamsstateoftheclimate_intro.pdf by guest on 16 September 2020
• Land: albedo, river discharge, snow
The following variables are considered partially monitored, in that there is systematic, rigorous measurement found in this report,
but some coverage of the variable in time and space is lacking due to observing limitations or availability of data or authors:
• Atmospheric composition: aerosols properties, cloud properties, precursors of aerosol and ozone
• Ocean physics: subsurface currents
• Ocean biogeochemistry: inorganic carbon
• Land: above-ground biomass, anthropogenic greenhouse gas fluxes, fire, fraction of absorbed photosynthetically active
radiation, glaciers, groundwater, ice sheets and ice shelves, lakes, permafrost, soil moisture
The following variables are not yet partially covered in this report, or are outside the scope of it.
• Surface atmosphere: surface radiation budget
• Upper atmosphere: lightning
• Ocean physics: sea state
• Ocean biogeochemistry: nitrous oxide, nutrients, oxygen, transient tracers
• Ocean biogeosystems: marine habitat properties
• Land: anthropogenic water use, land cover, land surface temperature, latent and sensible heat fluxes, leaf area index, soil
carbon
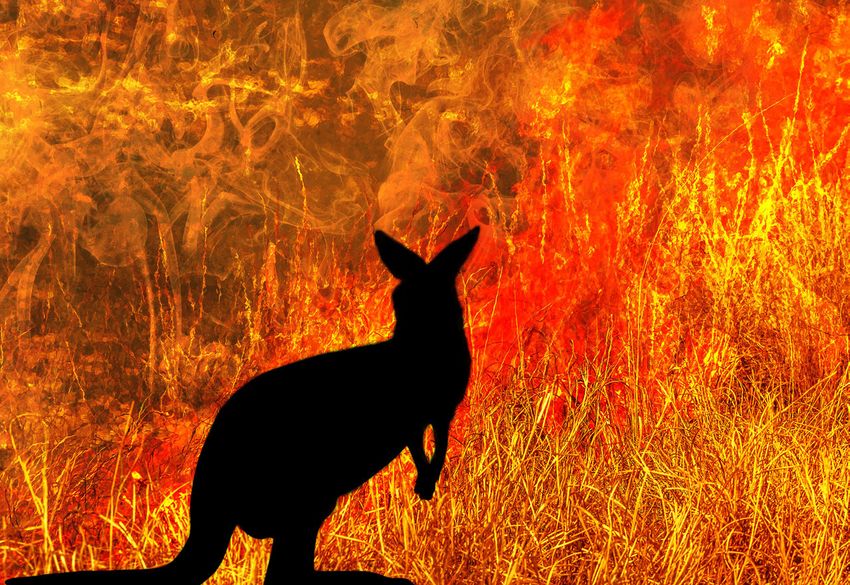
Plate 1.1. (next page) Global (or representative) average time series for essential climate variables through 2019. Anomalies
are shown relative to the base period in parentheses although base periods used in other sections of the report may differ.
The numbers in the square brackets that follow in this caption indicate how many reanalysis (blue), satellite (red), and in
situ (black) datasets are used to create each time series in that order. (a) NH polar stratospheric ozone (Mar) [0,0,1]; (b) SH
polar stratospheric ozone (Oct) [0,0,1]; (c) apparent transmission (Mauna Loa) [0,0,1]; (d) surface temperature [3,0,4]; (e)
lower tropospheric temperature [3,2,3]; (f) lower stratospheric temperature [3,3,3]; (g) extremes (warm days (solid) and
cool days (dotted)) [0,0,1]; (h) Arctic sea ice extent (max [solid]) and min [dashed]; [0,0,1]); (i) Antarctic sea ice extent (max
[solid] and min [dashed]; [0,0,1]); (j) glacier cumulative mean specific balance [0,0,1]; (k) NH snow cover extent [0,1,1]; (l)
lower stratospheric water vapor [0,0,1]; (m) cloudiness [0,10,0]; (n) total column water vapor – land [3,1,1]; (o) total column
water vapor – ocean [3,2,0]; (p) upper tropospheric humidity [1,2,0]; (q) specific humidity – land [4,0,1]; (r) specific humid-
ity – ocean [4,0,2]; (s) relative humidity – land [3,0,4]; (t) relative humidity – ocean [3,0,1]; (u) precipitation – land [0,0,3]; (v)
precipitation – ocean [0,0,1]; (w) ocean heat content (0–700 m) [0,0,6]; (x) sea level rise [0,0,1]; (y) tropospheric ozone [0,1,0];
(z) tropospheric wind speed at 850 hPa for 20°–40°N [4,0,0]; (aa) land wind speed [0,0,1]; (ab) ocean wind speed [3,1,0];
(ac) biomass burning [0,2,0]; (ad) soil moisture [0,1,0]; (ae) terrestrial groundwater storage [0,1,0]; (af) fraction of absorbed
photosynthetically active radiation (FAPAR) [0,1,0]; (ag) land surface albedo – visible (solid) and infrared (dashed) [0,1,0].
AU G U S T 2 0 2 0 | S t a t e o f t h e C l i m a t e i n 2 0 1 9 1. INTRODUCTION S6Downloaded from http://journals.ametsoc.org/bams/article-pdf/101/8/S1/4988915/2020bamsstateoftheclimate_intro.pdf by guest on 16 September 2020
S7 1. INTRODUCTION
AU G U S T 2 0 2 0 | S t a t e o f t h e C l i m a t e i n 2 0 1 9Downloaded from http://journals.ametsoc.org/bams/article-pdf/101/8/S1/4988915/2020bamsstateoftheclimate_intro.pdf by guest on 16 September 2020
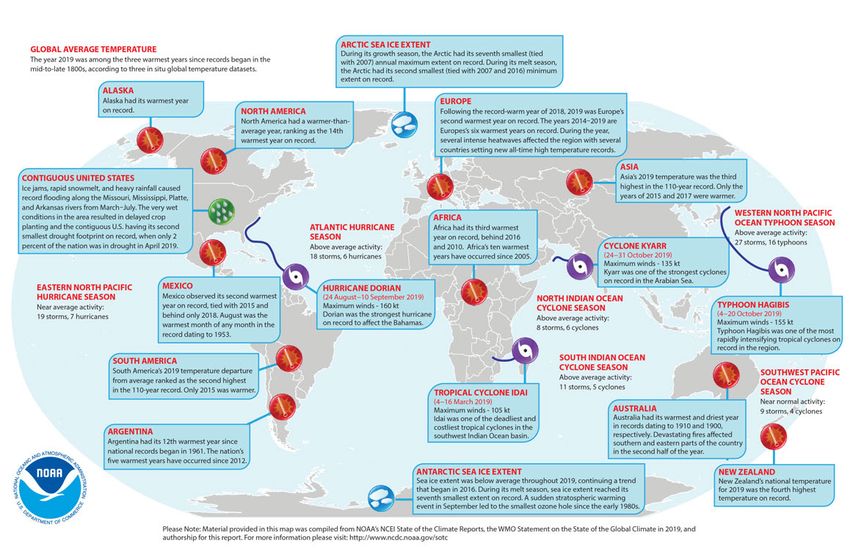
Fig. 1.1. Geographical distribution of selected notable climate anomalies and events in 2019.
References
GCOS, 2003: The second report on the adequacy of the global —, 2010: Implementation plan for the global observing system
observing systems for climate in support of the UNFCCC. for climate in support of the UNFCCC (2010 Update). GCOS-138
GCOS-82 (WMO/TD-1143). World Meteorological Organization, (GOOS-184, GTOS-76, WMO/TD-1523). World Meteorological
74 pp., http://www.wmo.int/pages/prog/gcos/Publications/gcos Organization, 180 pp., http://www.wmo.int/pages/prog/gcos/
-82_2AR.pdf. Publications/gcos-138.pdf.
AU G U S T 2 0 2 0 | S t a t e o f t h e C l i m a t e i n 2 0 1 9 1. INTRODUCTION S8You can also read