Student Managed Fund 2019 Analyst Report - TEAM STAMFORD Anshul Manglani Karthik Gurusamy
←
→
Page content transcription
If your browser does not render page correctly, please read the page content below

Student Managed Fund 2019 Analyst Report
              Anshul Manglani
              Karthik Gurusamy

             TEAM STAMFORD
Table of Contents

1. Business Description ..................................................................................................... 3
2. Business Segments ....................................................................................................... 4
   2.1 Fragrances (Scent) ................................................................................................... 4
   2.2 Flavors (Taste).......................................................................................................... 5
   2.3 Frutarom ................................................................................................................... 5
3. Industry Overview and Competitive positioning ............................................................. 5
4. Investment Thesis .......................................................................................................... 6
   4.1 Wide Economic Moat ................................................................................................ 6
   4.2 Vision 2020 ............................................................................................................... 7
   4.3 Frutarom Acquisition ................................................................................................. 8
5. Capital Allocation Plans ............................................................................................... 10
6. Valuation Assumptions and Key Financials ................................................................. 10
   6.1 Sensitivity Analysis (Base Case) ............................................................................ 11
7. Investment Risks.......................................................................................................... 11
8. ESG Highlights............................................................................................................. 12
9. Management ................................................................................................................ 13
10. Stock Ownership ........................................................................................................ 13
   10.1 Top 5 Institutional Holders .................................................................................... 13
11. Appendix .................................................................................................................... 14
   11.1 DCF Model ........................................................................................................... 14
   11.2 Comps .................................................................................................................. 15
   11.3 References ........................................................................................................... 15

                                                               2
Date: Oct 15, 2018                      Ticker: IFF        Sector: Basic Materials - Specialty Chemicals

  Fair Value: $152                    TTM P/E: 34.82            52 Week High: $157.4
  Current Price: $130.92              EPS: $3.76                52 Week Low: $121.11    Recommendation: BUY
  Market Cap: $13.96B                 Dividend Yield: 2.1%

1. Business Description
International Flavors and Fragrances (IFF) is a leading innovator of sensory experiences, co-
creating unique products that consumers taste, smell, or touch. The company operates in 3
business segments: Taste (previously "Flavors"), Scent (previously "Fragrances") and Frutarom. In
2018, net sales of IFF and Frutarom as reported was $3.9 billion. On a proforma basis, combined
sales of IFF and Frutarom, was approximately $5.1 billion which makes it the second largest
company in the taste, scent and nutrition industry. Taste business represented 44% of the sales,
Scent business represented 47% of the sales and Frutarom represented 9% of the sales. The
business is geographically diverse with sales to customers in four regions: Europe, Middle East and
Africa (35%), Greater Asia (25%), North America (25%), Latin America (15%). Sales in emerging
markets represented 48% of 2018 sales.

In the last 12 years, the company has outperformed both the S&P 500 and the Basic Materials
sector significantly. The company’s total return and annual return from October 2006 to October
2018 has been 310.77% and 12.49% per annum respectively. During the same time, the S&P 500
returned 161.80% and 8.34% per annum. Basic Materials sector returned 118.44% and 6.72% per
annum.

* Business Description is updated with 2018 Sales figures

                                                            3
Last 12 Year Total Return                       Last 12 Year Annual Return
                     Oct 2006 - 2018                                  Oct 2006 - 2018

2. Business Segments
2.1 Fragrances (Scent)
Fragrance business derives revenue from two sources, Fragrance Compounds and Ingredients.
Fragrance Compounds are unique and proprietary combinations of multiple ingredients that are
ultimately used by customers in their consumer goods. Fragrance Compounds are organized into
two broad categories, Fine Fragrances and Consumer Fragrances.
Fine Fragrances focuses on perfumes and colognes.
Consumer Fragrances include five end-use categories of products:
   i.      Fabric Care - laundry detergents, fabric softeners and specialty laundry products;
   ii.     Home Care - household cleaners, dishwashing detergents and air fresheners;
   iii.    Personal Wash, including bar soap and shower gel;
   iv.     Hair Care; and
   v.      Toiletries.
Fragrance Ingredients business is a vertically integrated operation, originating with the
development in research laboratories of naturals, synthetic and proprietary molecules and
innovative delivery systems, progressing to manufacturing facilities that produce these ingredients
in a consistent, high-quality and cost-effective manner and transitioning to creative centers and
application laboratories where perfumers partner with the customers to create unique fragrance
compounds for use in a variety of end-use products.
Fragrance Ingredients consist of active and functional ingredients that are used internally and sold
to third parties, including customers and competitors, for use in preparation of compounds.
Fragrance Ingredients also include cosmetic active and functional ingredients, which provide
biologists and cosmetic chemists with innovative solutions to address cosmetic challenges such as
skin aging and hair protection.

                                               4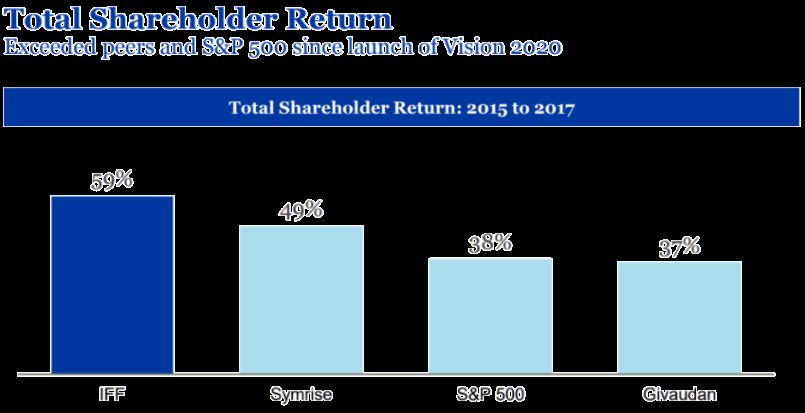
2.2 Flavors (Taste)
Flavors are the key building blocks that impart taste experiences in food and beverage products.
Flavor Compounds are ultimately used by customers in the following four end-use categories of
consumer goods:
   i.      Savory, for use in soups, sauces, condiments, prepared meals, meat, fish and poultry,
           potato chips and other savory snacks;
   ii.     Beverages, for use in juice drinks, carbonated beverages, flavored waters and spirits;
   iii.    Sweet, for use in bakery products, candy, chewing gum and cereal; and
   iv.     Dairy, for use in all dairy products such as yogurt, ice cream and cheese and other
           products that have a creamy flavor.

2.3 Frutarom
Frutarom’s products are focused on three principal areas:
   i.      Savory Solutions - Savory Solutions are blends of flavors, natural colors, seasonings,
           functional ingredients and natural anti-oxidants that are primarily designed for the meat
           and fish industry.
   ii.     Natural Product Solutions - Natural Product Solutions include the use of natural health
           ingredients, colors and shelf life extenders.
           a. Natural Health Ingredients - Natural functional food and supplement nutraceutical
               ingredients are derived from plants and herbs, which provide, or are perceived as
               providing, health benefits.
           b. Natural Color - Wide array of natural colors and fruit and vegetable concentrates for
               food, beverage, and cosmetics.
           c. Natural Food Protection - Natural antioxidants and anti-microbials used for natural
               food preservation and shelf life extension to beverages, cosmetic and healthcare
               products, and pet food and feed additives.
   iii.    Taste Solutions - Flavor compounds and foods.
   iv.     Specialty Fine Ingredients - specialty fine ingredients market includes natural flavor
           extracts, specialty essential oils, citrus products, aromatic chemicals, and natural gums
           and resins.

3. Industry Overview and Competitive positioning
The global market for flavors and fragrances has expanded consistently, primarily as a result of an
increase in demand for, and an increase in the variety of, consumer products containing flavors and
fragrances. Management estimates that in 2017 the flavors and fragrances market was
approximately $24.8 billion, and is forecasted to grow approximately 4.2% by 2022, primarily driven
by expected growth in emerging markets. IFF has a global footprint that helps it land supply
agreements with large global consumer packaged goods (CPG) companies. The company holds
the 2nd highest market share in terms of the total sales in the global flavors and fragrances market.

We believe that the future growth drivers for this industry are
  i.      Increasing disposable income among middle class
  ii.     Changing consumer preferences
  iii.    Growing awareness for products with natural ingredients

                                               5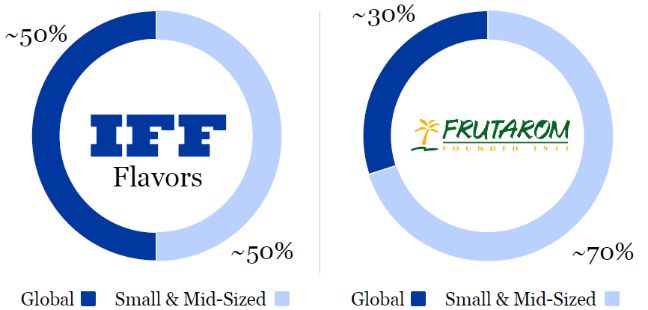
4. Investment Thesis
4.1 Wide Economic Moat
IFF spends close to 8% of its sales on Research and Development, which helps it to remain very
competitive in identifying and serving new customer trends. The biggest assets of the company are
its proprietary formulas which provide significant pricing power. With more than 300 patents in the
US post 2000, IFF is part of the Core Suppliers List for majority of the CPG companies. The clients
tend to be very sticky because IFF provides customized solutions to its customers and these flavors
and fragrances are tough to replicate.

Major customers for IFF are:

                   Flavors                                         Fragrances
                     P&G                                               P&G
                    Nestle                                            L’Oréal
                  Unilever                                            Colgate
                    Heinz                                             Gillette
                     Coke                                          Estee lauder
                Campbell Soup                                      Ralph Lauren
                  Hershey                                              Avon
                 McDonalds                                          Hugo Boss
                  PepsiCo                                            Davidoff
                   Kellogg                                          Calvin Klein
                 Yum Brand                                           Valentino
                 Philip Morris

Also, flavors and fragrances are the key drivers for consumer repurchase decisions. They have a
critical contribution towards customer decision making despite being a low-cost component. The
share of F&F ingredients in Cost of Goods Sold (COGS) is only 4% to 6% in fine fragrances, but
scent contributes close to 78% in customer repurchase decision. Similarly, for flavors and consumer
fragrances, the share of F&F ingredients in COGS is only 0.5% to 2%, but smell and taste contribute
45% in the customer repurchase decision. This gives IFF the pricing power with its customized
products to their customers.

                                              6
.

4.2 Vision 2020

The four pillars of IFF's Vision 2020 strategy originally announced in 2015 and refreshed in 2017
focuses on building differentiation and accelerating growth to create shareholder value. The
company is more than halfway through its Vision 2020 strategy and has significantly outperformed
its competitors during this time with a total shareholder return of 59%. During the same time
Symrise, S&P 500 and Givaudan had a return of 49%, 38% and 37% respectively.

                                             7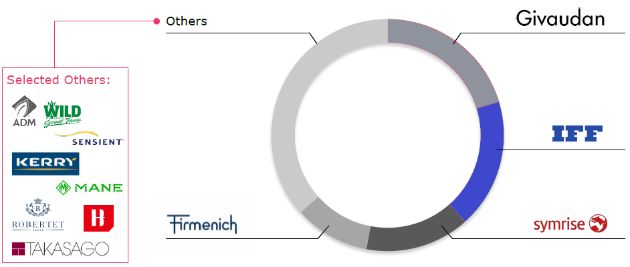
4.3 Frutarom Acquisition
On October 4, 2018, IFF completed the acquisition of Frutarom Industries Ltd. IFF acquired 100%
of the equity of Frutarom pursuant to a definitive agreement and plan of merger entered on May 7,
2018. The transaction was valued, based on IFF stock price as of October 4, 2018, at approximately
$7 billion, including the assumption of approximately $695 million of Frutarom's net debt, which was
repaid concurrent with the closing of the transaction.

Frutarom is an Israeli company which has a suite of natural product offerings, serving to fast-
growing, small, mid-sized & private label customers. The company is an acquisitive company
serving 30000 customers in more than 150 countries. 43% of its sales are from the emerging
markets.

This acquisition establishes IFF as a global leader in natural taste, scent and nutrition.

Also, it strengthens IFF’s exposure to fast-growing small and mid-sized customers. Current CPG
customer dynamics indicate that smallest companies are capturing more clean label growth than
largest and mid-sized companies. Before the acquisition, IFF had 50% global customers and 50%
small and mid-sized customers. But, after the acquisition, IFF currently has 40% global customers
and 60% small and mid-sized customers. This acquisition increases the exposure of IFF in fast-
growing segments.

                                                8
This acquisition also brings new opportunities in attractive and fast-growing adjacencies, including
enzymes, antioxidants, health ingredients and natural colors. It also diversifies IFF’s portfolio
offering to its customer base.

Synergies from Frutarom Acquisition

Frutarom acquisition is expected to generate synergies for IFF due to cross selling, broader
customer base, strong product offerings and deepest market penetration.

A total of $145 million in synergies is expected to be realized from this acquisition.

                                                9
5. Capital Allocation Plans
Dividends have grown 13.9% CAGR over the last six years. The capital expenditure is expected to
reduce going forward except for the current year. The company expects to spend 3% of its sales
on capital expenditure in the long run.

The company also plans to reduce the Net Debt/ EBITDA from 3.6x to 3x within 18-24 months to
retain Investment Grade rating. Management incentives are aligned with repayment of debt metrics.

6. Valuation Assumptions and Key Financials
Organic revenue growth for 2018 is 4%, 6% for 2019-2021, 5% for 2022-2023. Raw material
inflation is assumed to be 6% for 2019 and 2020, and 4.5% thereon. Management estimates the
run rate cost synergies of about $145 million arising from Frutarom acquisition. Being conservative,
we assume the company will realize only 50% of the synergies. Tax rate is assumed to be 21%.
Capex is 5% for 2018 and 2019 and 3.5% thereon. WACC is 7.27% and Exit EBITDA multiple is
15. Terminal growth is 2%. Based on these assumptions, we arrived at the target price of 142.72
and 166.59 using the perpetuity growth method and the terminal EBITDA method respectively. With
60% weight to DCF and 40% weight to EBITDA method, we arrived at the target price of $152.28.
The valuation exercise was repeated for bull and bear case to arrive at the target price of $184.57
and $119.80 respectively. Finally, with 25% probability to each bull and bear case and 50%
probability to base case, our fair value estimate of the company is $152.23. Refer Appendix for
further details.

                                              10
6.1 Sensitivity Analysis (Base Case)
7. Investment Risks
i. Unexpected failure in Frutarom Integration and synergy realization
IFF has not done any acquisitions of this scale in the past. Integration represents a
source of uncertainty as Frutarom per se has been highly acquisitive in the recent years.
Any unanticipated failure in the integration or failure to realize the synergies will
significantly impact the financial performance of IFF.
ii. Disruption in supply chain or manufacturing operations, volatility and increases
in the price of raw materials, energy and transportation will adversely impact the
operating performance of the company
IFF purchases raw materials from many sources all over the world. Disruptions in the
supply chain or quality of ingredients or rising prices for ingredients purchased could
adversely impact company’s results of operations and profitability. Historically, company
has experienced the greatest amount of volatility in natural products that represent
approximately 50% of raw material purchases. To reduce the sourcing risk, the company
11maintains strategic stock levels covering multiple periods for critical items and/or time
purchases to capitalize on favorable market conditions.
iii. Impact of currency fluctuation or devaluation in the international markets
IFF operates on a global basis and is exposed to currency fluctuation related to the
manufacture and sale of its products in currencies other than the U.S. dollar. The major
foreign currencies involve the markets in the European Union, Great Britain, Mexico,
Brazil, China, India, Indonesia, Australia and Japan, although all regions are subject to
foreign currency fluctuations versus the U.S. dollar. The company actively monitors the
foreign currency exposure by employing a variety of techniques, including foreign
currency hedging activities. They also enter into foreign currency forward contracts to
reduce the exposure to cash flow volatility associated with foreign currency receivables
and payables, and with anticipated purchases of certain raw materials used in
operations.
iv. Effect of legal and regulatory requirements, as well as restrictions imposed on
operations by foreign and domestic governmental entities
The manufacture and sale of IFF’s products are subject to regulation in the United States
by the Food and Drug Administration, the Department of Agriculture, the Bureau of
Alcohol, Tobacco and Firearms, the Environmental Protection Agency, the Occupational
Safety and Health Administration, the Drug Enforcement Administration and state
authorities. In addition, they are subject to product safety and compliance requirements
established by other industry oversight bodies. The foreign operations are subject to
similar substantial governmental regulation and oversight standards in several countries,
including extensive requirements within the European Union. Additional costs or
investments necessary to maintain compliance with existing or future governmental
regulations may adversely impact the financial condition, results of operations or
liquidity.
8. ESG Highlights
➢ CDP Climate A List for the 3rd year in a row
➢ Life social responsibility certification for blackcurrant buds from France
➢ Organic certification at three operating locations
➢ Industry first Green Circle Certified LLC - Zero Waste to Landfill certification at S.
Brunswick, New Jersey, U.S. flavors facility
➢ CDP Water Leadership Status
➢ Gold Status with Eco Vadis
➢ Barron’s 100 most sustainable companies
➢ CSR ranking of 79%
➢ Joined the WBCSD’s food reform for sustainability and health
129. Management
Andreas Fibig is the CEO since September 2014 and is also the chairman of the board. This
dynamic is generally not well received from a corporate governance standpoint. Excluding this, we
are comfortable with the overall corporate governance structure. Eleven of the 12 board members
are independent, and each board member is elected for a term of only one year. This means that
the entire board can be changed annually if the shareholders desired so.
10. Stock Ownership
As per the most recent 13F Filing, Institutional Holdings account for 82.94%. Total number of
holders is 647. Total shares held are 88,437,999.
10.1 Top 5 Institutional Holders
NAME SHARES HELD
WINDER INVESTMENT PTE LTD 19,536,858
VANGUARD GROUP INC 12,292,106
BLACKROCK INC 6,794,818
STATE STREET CORP 4,100,591
CAPITAL RESEARCH GLOBAL INVESTORS 3,617,095
1311. Appendix
11.1 DCF Model
Market cap (in billions) 14
Total debt outstanding (in billions) 4.5
Debt ratio 24.3%
Equity ratio 75.7%
Levered beta 0.91
Treasury rate 3.1%
Market risk premia 6.00%
Cost of equity (CAPM) 8.6%
Cost of debt 4.10%
Tax rate 21%
WACC 7.27%
1411.2 Comps
11.3 References
i. https://www.iff.com
ii. Bloomberg
iii. Morning Star
iv. SEC EDGAR
v. https://www.csrhub.com
15You can also read