Study of seed system in Uttarakhand
←
→
Page content transcription
If your browser does not render page correctly, please read the page content below
Study of seed system in Uttarakhand

Ainitial seed study was conducted in the mid-hills agro-ecological conditions of Kumaon region
of Uttarakhand. Agriculture in this region is mainly rainfed and farmers follow terrace farming
due to uneven topography or mountainous ecology. Since ancient times the in lowland area of
the region fields were irrigated mainly through diverting water from nearby streams through
channels called guls. In mid-high hills rice/wheat crop system is prevalent in lowlands, while dry
rice, millets and pulses are cultivated in kharif season (i.e. June–October) replaced by wheat and
barley in rabi (i.e. October–April) in uplands. Recently, vegetables and fruits have been
introduced as cash crops. Farmers practice low input agriculture. They depend on varietal
mixtures, multiple crops, intercropping, home gardens and polycultures, as well as on genetically
diverse landraces of individual crops. Rainfed agriculture is practiced on almost two equal halves
of agricultural land (locally called as ‘sar’ with different crop compositions) in 50% of villages
of Nainital. To maintain soil fertility, the tradition is to keep the land fallow for one half in the
uplands during one winter season for 6 months (October–March) over a period of 2 years. In
Bageshwar, farmer fields are mainly irrigated, use agrochemicals as inputs for fertility
management and have shorter fallow periods. The main features of the region and sample design
are represented in Table 1.
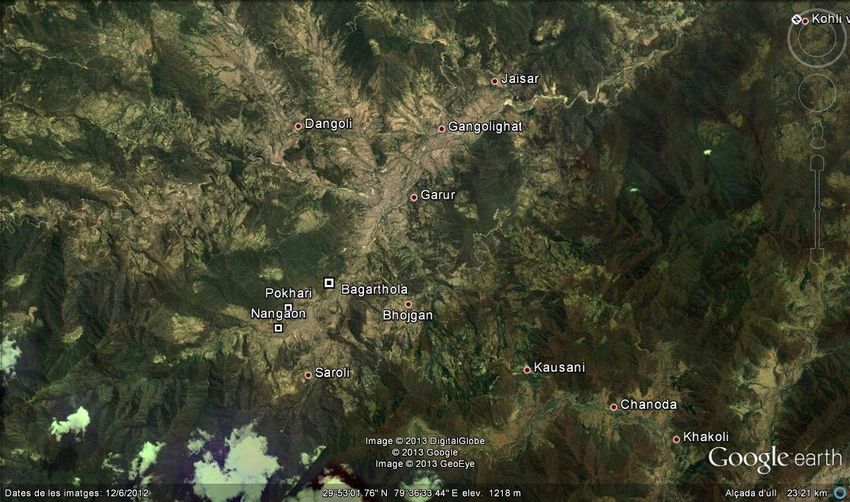
Table 1Main features of the two districts studied -

Features                    Unit                 Uttarakhand

                                                 Nainital                                        Bageshwar

Elevation range             Meters a.s.l.        1300-1600                                       1200-1400

agroecological zone                              mid-high hills                                  mid-high hills

agroecological subzone      %                    70% upland; 30%                                 30% upland; 70% upland
                                                 lowland

Cropping pattern                                 Upland                lowland                   upland            lowland

                            Kharif season        Millets/pulses/dry    Rice/vegetable (5%)       Millets/pulses/   Rice
                                                 rice versus fruits                              dry rice

                            Rabin season         Wheat/barley          Wheat/barley/vegetables   Wheat/barley      wheat,
                                                                                                                   vegetables,
                                                                                                                   barley

                            Jaid season

Land management                                  Crop rotation and     Crop rotation and         rotation, no      irrigation;
                                                 intercropping;        intercropping; use of     intercropping,    partial use of
                                                 fallow lands, no      irrigation,no use of      fallow lands      agrochemical,
                                                 agrochemical use;     agrochemical, only 1      after millet,     only 1 month
                                                 mixed agriculture -   month of rest             use of urea       of rest
                                                 livestock                                       only with rain
                                                 management;
                                                 common grazing

Total number of HH per      Number               400                                             550
village (mean)

Presence of external        High/moderate/low    Low                                             moderate
interventions

Collection institutions     yes/no               yes (SAR system)                                no

Market access (distance)    good/moderate/poor   Poor                                            moderate

sampled household           Number               96                                              40
1. Material and methods
1.1. Sample design :
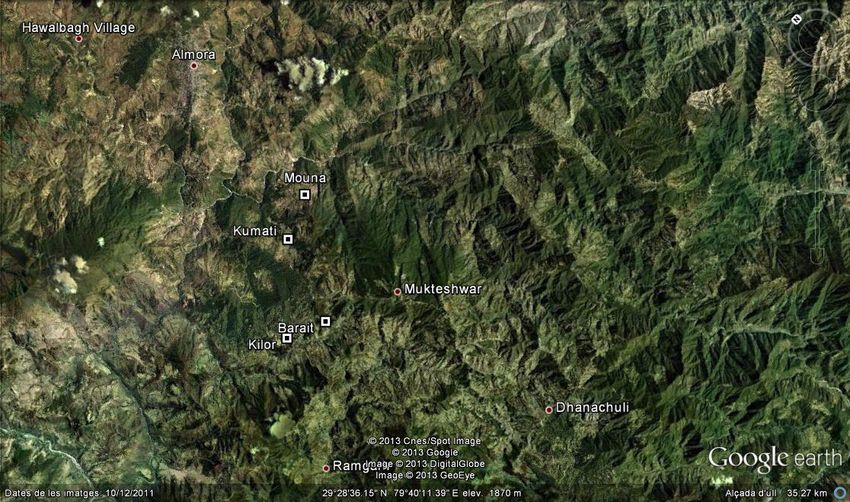
After a preliminary field trip finalized to recognize the major land and crop management systems
inUttarakhand, 2 districts from 2 blocks (i.e. administrative unit in charge of the governmental
distribution of seed) were selected. Within each site selection of the villages to be covered under
the research studywas N=7. In each village, a minimum of two Focus Group Discussions (FGD)
and households’ survey were conducted. The household survey was conducted employing a
stratified random sampling design, to capture the diversity on castes and/or agro-ecological
conditions within the village. Figure 1 shows the final location of the sampled villages.
UTTARAKAND
District
o Nainita
(sit 1);
District
o Bageswa (site2
Nainital Bageshwar
Figure 1 Location of districts and villages in Uttarakhand surveyed and the agro-ecological environments
1.2. Qualitative information collection :
14 focused group discussions were conducted using a framework to systematically include
menand women and carry out gender- based studies and methodologies. 5 men and 8 womengroups were selected separately. The participation was found similar for women (N=8+/-4;) and
men (N=5 +/-1;). Each group was heterogeneous in age. The FGD had a facilitator and a
translator, note takers and digital recorder to store all the information collected.
FGD were conducted to understand -
1. Land management and cropping system functioning
2. Varieties used at village level, knowledge and preference of men and women in the past
and present
3. Formal and informal seed system at village and regional level both in the past and
present
4. Collective perceptions about the changes taking place in the area and stress factors
responsible for the local socio-ecological system
5. Coping mechanism and adaptive strategies used by communities to cope with climate
change
6. Role of women in agricultural activities, specially the seed system.
The temporal scale of reference to analyse changes was fixed as: past=father’s responses and
present=young generation responses.
The study of varieties was performed in qualitative way due to the complexity within the Oryza
genus and the wide number of phenotypes and genotypes defined by local people as varieties.
Information collected on the varieties during the study was by cross-checked with VPKAS
database to validate the results.
1.3. Quantitative information collection :
Quantitative data were collected using a structured questionnaire. A total of 136 interviews were
conducted in UK. Data collected from the villagesincluded population, geographical
coordinates, distance to market and main town. Before conducting the survey the questionnaires
were field tested and adjustments made to match the local context.Socioeconomic attributes of the individuals and characteristics of households:
Data on (i) education level, (ii) age, (iii) sex, (iv) caste,group membership and participation of
members (both men and women) as collective institutions was collected. Other NGOs and
governmental extension programs were also involved as a component in these studies.
The demography of the households was then explored and a survey was conducted. The
households were asked certain questions like in each month of normal year(no drought or
excessivel rainfall year), whether the food they access normally comes from their own farm or
stores during that particular month, or is it mainly from other sources (e.g. purchased from the
market, food aid, gifts, etc.). They were also asked in which months of a year they face food
shortage (food deficit months’). The food deficit months,per nutritional food, have not been used
given to the low reliability of data collected.
Data on access to the main assets were collected: 1) access to water for drinking 2) access to
animals; 3) access to technology: for irrigation and for ploughing; 4) access to information (e.g.
radio, TV, mobile, computer and internet); 5) access to means of transports; 6) access to land
(own land, divided in irrigated and rainfed, leased, in and out, and shared). Data on the access to
main sources of income (on-farm, off-farm and non-farm) were also recorded.
On farm-agrobiodiversity inventory:
Detailed information was collected at household level on on-farm agro biodiversity including
growing season, area coverage, production, markets, varietiescultivated. Calculation per each
household was done on interspecific richness (notated as Sc) as the sum of crops cultivated and
the intraspecific richness (notated as Sv), as the sum of varieties (landraces and modern).
Perception of drivers of change and complementary responses to adapt to and cope with:
Opinions were taken using two sections of semi-structured questions:
1. Exploration of individual perceptions of climate change and other drivers of
changes/stressors for agriculture and local livelihoods
2. Exploration of the ability to cope with changes was defined by coping mechanisms,
destitution mechanisms and adaptive strategies adopted at individual/HH level to respond
to climate and other changes.For the analysis :
(1) renewed, planned or mainly longer time scale actions, as adaptive strategies
(2) unplanned responses, usually short term, undertaken spontaneously and regularly by local
people under crisis and threats to local livelihoods, as coping mechanisms.
(3) destitution mechanisms adopted as extreme reaction to shocks.
Seed system study:
The seed system at household level was studied to gather information on sources of seeds used,
seed selection, seed storage methods and age of seeds. A study on seed networks (formal and
informal) was also carried out. In and out transactions of seeds in the last three years, specifying
the distance, mode and type of transaction were studied and on this basis, the following strategy
of households was categorized into source (i.e. supplier), receptor, equal exchange, no exchange
households and calculationwas done to know difference between out-transactions and in-
transactions.
Gender equity in seed-related decision-making and activities:
Gender equity was classified as an explanatory variable. Depending on the number of tasks
woman was singled out as the main person responsible or when 5 or more tasks were being
completed by women. Same criteria were used to classify men’s and other member domains.
Another criteria was sharing of roles equally between men and women.
1.4. Data analysis
Descriptive statistics of quantitative data were done using STATISTICA and Excel. For interval
variables the values were converted to standard metric units (e.g. land area in hectares,
production in quintal) and used directly after normal distribution testing, or through
transformation analysis.Sample descriptive statistics (mean, standard error of mean, maximum
and minimum value) were generated.
Comparison of data on gender equity and seed strategy categories was done by use of one-way
repeated measures ANOVA for interval dependent variables, such as richness indexes andnumber of adaptive strategies, coping mechanisms and destitution mechanisms. In case of
normal distribution of dependent variables, when the factor like gender equity, seed strategy
were significant, Student Tukey-HSD post-hoc tests were applied to perform pair-wise
comparisons of means. For comparing two means of the dependent variables (i.e. richness
indexes and number of adaptive strategies, coping mechanisms and destitution mechanisms)
between two classes (i.e. formal participation in training and membership in farmers’ groups;
participation in collective institutions;) t-Student analysis was adopted.
2. Resultsand discussion
2.1. Socio-economic characteristics of households:
Respondents between 21 and 89 years had different education levels and came from different
castes including scheduled and general castes.Landholdings were small ranging between 0,50and
0,32 ha per household. Most agricultural productsare for self-consumption only 36% -households
had farm income from fruit production. Households have a diversified production strategy which
includes livestock primarily, cattle, and earnings from manual labour. Food self-sufficiency is
low.Around 60% of the sampled population dependedon external sources for 6-8 months and
around 30% dependedfor longer periods than 8 months.
Table 2 Main economic features
Site/ indicators Nainital Bageshwar
Education (median % HH)
□ no formal schooling
□ Primary school 29,2 35,0
□ Secondary school 25,0 10,0
□ Intermediate 36,5 20,0
□ University degree 6,3 17,5
3,1 17,5
Caste
□ Scheduled tribes 1,0 5,0
□ Scheduled Caste 11,5 42,5
□ Other Backward Class -
□ General 87,5 52,5Site/ indicators Nainital Bageshwar
Working people in HH (median nº)
- women 1,9 2,1
- men 2,1 1,8
Children (6-15) (median nº) 1,2 1,3
Children (0-5) (median nº) 0,8 0,6
Old people (median nº) 0,8 0,8
Land holding 0,50 0,32
• irrigated
• rainfed 0,10 0,12
0,40 0,20
Livestock Units (median Nº per HH) 4,4 3
10 HH income
• On farm income 36,0 19,2
• Off farm income 52,5 75,0
• Non farm income 11,4 5,7
% HH food dependent
0-1 month 1,0 20,0
2-4 months 6,3 30,0
5-8 months 60,4 47,5
More than 8 months 33,3 2,5
5.2 Current trends of on-farm agrobiodiversity :
A high number of varieties were identified about 37 rice varieties, mainly landraces, were
identified in 7 villages but only 1 to 3 varieties of a specific crop are being cultivated. Farmers
mentioned that several landraces have been abandoned or lost in the last 50 years, without being
substituted by something else. The reason for this is mainly research institutions and government
agencies not providing any help.Table 3 Agro-biodiversity descriptive statistics
site/indicators Nainital Bageshwar
Mean Mean
(Max, Min) (Max, Min)
HH interspecific Total 11,0 (18, 5) 14,2 (22,3)
richness
% plots self- Cereals 98% 85%
consumption
destination Pseudocereals and millets 100% 100%
Legumes Others 97% 100%
(vegetable, tobacco, oil
seed) 77 %100% 49%
Others (home garden)
99%
HH intraspecific Total 11 (18-1) 13 (22-3)
richness
Rice
• Landraces 1,6 (4-1) 1,9 (4-1)
• HYVs 0 (0) 0,2 (1-0)
Other cereals
1 (3-0) 0,9 (3-0)
• Landraces
0,2 (2-0) 0,4 (2-0)
• HYVs
Leguminous
1,3 (5-1) 1,1 (2-1)
• Landraces
0,1 (2-0) 0,1 (1-0
• HYVs
Village rice Total (average) 8 16
intraspecific richness
within site * Landraces 7 (11, 4) 15 (17, 12)
HYVs 0,5 (0, 2) 1 (2, 1)
Rate of change -21% (-29, -14) -33% (-58, -11)
village intraspecific
richness (only for
rice) *
Different numbers 8 (15, -1) 0 (2, -2)
of rice varietiessite/indicators Nainital Bageshwar
Mean Mean
(Max, Min) (Max, Min)
recognized by
women with respect
to men*
*village data
Preference criteria for agro-biodiversity conservation:
The focus on seed is the most visible face of agro-biodiversity. Farmer motivation to select
different rice varieties depends on a number of factors and the choices vary between women and
men.
InUttarakhandadoption of improved varieties has been very minimal. Some improved varieties
were introduced after the Green Revolution and have been maintained since then by local people
(Old Improved Varieties – OIV). The group discussion suggested that HYVs were tried in the
past, but not adopted due to theirhigh dependence on external inputs and the low environmental
and cultural adaptability. The preferences for landraces common to both men and women are as
follows -
• Landraces are grown in response to production objectives: tall varieties are preferred
for fodder , some varieties have higher yield.
• diversity in crops and landraces .of Millets, Rice, Pulses are selected for the market.
• landraces are selected to match different ecologies, such as land location, water
availability, soil type and local climate.Farmers know which varieties perform well in
particular conditions and thus exhibit what is called "genotype--environment
interaction".
• landraces are selected for resistance to pests and diseases, period of maturity, tolerance to
flood drought conditions and rain .• diversity of crops and landraces varieties favour a diversity of flora and positive fauna in
the field. For instance, a diverse field helps in controlling pest and diseases
• landracesare also selected for traits like taste, aroma, texture of grain .
• special landraces have a religious and cultural significance and some are used for cooking
traditional dishes, while others are conserved for their medicinal properties.
Women possess good knowledge about varieties (Table 4), their characteristics and agro-
ecological management (i.e. higher number of ecological information they talked about).
Table 4 Preferences for landraces and HYV in Uttarakhand -
Evaluation Landraces
Dimension Criteria Indicator Women Men
Cultural Religious value X x
Taste, aroma X x
Graincolour X
Softness of cooked grain X x
Cultural use X
Ease of Cooking
Medicinal value X x
Cooking special foods
Agronomic Yield X x
Productivity
Grain size and shape X x
Grain weight
Plant height x (high, x (high,
(for straw) small) small)
Socio- Multiple use (grain + X x
economic fodder)
Time/labor cost in X
processing
Input Costs X
Home consumption X x
Market price
Health influence X
Ecological Susceptibility to pests and X x
diseases
X
Ecological Tolerance to dry conditions X x
X
Lodging resistance X
Soil type X
Tolerance to flooding X x
Tolerance to drought X x
Longer shelf life on storage X
Submergence tolerance
Can grow without chemical X x
inputs
Short duration XSeed system -Seed source, selection, storage: The seed system in use in a community will include the ways in which farmers and rural communities select the seeds that they use in their cropping system. It also includes the manner of sharing seed within and across communities, as well as relationship with the market as a seed source. In Uttarakhand about 90% of farmers save and use their own seed of landraces and approx 10% buy seed from different sources in the village or from markets, specially in Bageshwar region. Changing seed through informal networks was more common in the villages of Ramgarh and Dhari blocks of Nainital district. Seed is saved even in the case of when there is shortage of food. This is a coping mechanism to deal with climate change, since it conserves loss of adapted genetic material. However, farmers mentioned that several families problems of losing seed during critical years, like the drought season of 2008. Both farmers and Scientists know that the longer a variety has been maintained, the more resilient to climatic disturbance and the adaptation of selected seed. Currently, in UK seed of rice in Nainital district are on average around 40 years old (Min=9 years, Max 100 years) and seed of rice in Bageshwar are around 72 years old (Min=30 years, Max 200 years). Seed is carefully selected and stored. Who is in charge of the seed selection and the mode of selection are relevant information to be taken into account to evaluate how quality problems are overcome. As shown in Table 5, 77.6 % of women are involved in the seed selection and 72.9 % contribute in storage of seeds. It was observed that these women primarily select the seeds before harvest, while others carry out this selection process later. The main selection objective is to ensure good germination. Protection of seed material and conservation for future needs depends on the storage techniques, mainly using wooden baskets or other bins and tins, depending on the area and crop. Before storage, the selected material is threshed and dried under sun to remove moisture, these are then tested by crushing the seed with teeth Several indigenous techniques and traditional substances are used for protecting these seeds from different pests and diseases
The main characteristics of the rice seed system explored in Uttarakhandare presented in
the Table 5.

Table. 5 Rice seed system characteristics (last year)

                              UK (N =92)

                              Nainital           Bageshwar

Nº of HH who sow rice         88                 81

Seed lost (more than three    19,8               15
years without using)
(median % HH)

Seed abandoned (more          36,5               15
than three years without
using) (median % HH)

Median (Min, Max)             40,0 (9, 100)      72,3 (30, 200)
number of years that a seed
is saved by a HH*

% HH saved seed last year     89,2               84,6

% HH purchased seed last      0,8                7,7
year

% HH exchanged seed last      10                 7,7
year

% HH borrow seed last         0                  0
year

Selection of seed

TOTAL % of HH                 61                 95

% in field before harvest     48,2                38,5

% in field after harvest      8,9                 7,7

% at home                     42,8                53,8

% other

Storing of SL

% basket (bamboo or
wood)
                              33,9                2,6
% tin
                              55,3                23,1
% sacks
                              1,8                 10,6
% others (wood bin, plastic
UK (N =92)
Nainital Bageshwar
bin, etc.) 7,1 64,1
* Calculated with reference to traditional varieties
Changes over time of the local seed system
Figure 2 shows changes occurred in the past and present. Local seed system has
maintained the same structure presently, which varied a lot in the past. Farmers
confirmed that usually in the past main seed source was through internal exchanges
amongst the community, however for experimentation and genetic renewing, seeds were
exchanged between different zones with similar agroecological conditions. At present,
there are fewer seed exchanges than in the past which is happening at spatially local level
(within 15 km). Some instances indicate availability of new sources of seed within the
same villages, with very low influx of seeds from outside.
Figure 2 Seed system in the past and present inUttarakhandInformal Seed System
The distribution of seed among informal and formal networks are described in the figure
3a (representing the in-transactions) and figure 3b,which represents the out-transactions.
Seeds receivedfrom informal networks are widely maintained in Uttarakhand (on an
average 69% , in the last three years). The transactions may take place along familial or
kinship lines, but seed exchanges taking place between neighbors, or between villages are
reported here. Usually the out-transactions through informal system have a no-monetary
linkage and seeds are exchanged as seed for seed, gifts or through barter markets (i.e.
exchange of seed for other goods and services).
a) In-Transaction : b) Out-transaction :
Figure 3 a) In-transactions of seed in formal versus informal seed system; b) Out-transactions of seed in
formal
versus informal seed system
Importance of maintaining informal seed networks are:
i) To access and renew genetic material in normal conditions,
ii) Dynamism and capacity of seed networks as a safety net in crisis,
iii) Relevance of testing landraces for their performances,iv) importance of collective action and consequent reinforcement of social capital
within the village and between villages. Farmers renew their genetic material at
regular intervals, henceinformal seed networks are organised on ad hocbasis to
build on pre-existing social networks that arenot directly related to seed
exchanges, such as women labour-sharing and service-sharing collective
institutions (i.e. most of activities are organized between women from different
households such as sowing, fertilizing, cutting fodder, harvesting, threshing).
To improve farmer access to new and diverse biodiversity registers, strengthening seed
exchange networks and linking farmers' seed supply to formal sector through network
building support by external institutions, including landraces into extension packages and
establishing community-based seed banks will be important.
Formal Seed System
It was observed that in the last three years 20% of seed purchases were from distantly
located markets. The subsidized seed from local Government agencies (blocks) was the
second option of seed purchase specially during crises like diseases, drought, etc.,
involving 7,6% of total transactions. NGOs and Research Centers also contribute a
minimal 2,3 % in seed availability to the farmers.
The results alsoindicate different feedbacks from different householdswithin local
networks for seed. Some households are centrally located and act as a source of seed
availability, while others become receptors (i.e. dependent on external sources). Some
households act equally as a source and receptor, as depicted in Figure 4. Comparative
analysis also indicate moderate number of two-way exchanges with external sources to
obtain seeds of mainly hybrid and modern varieties.Figure 4. Classification of seed exchange system based onhouseholds in Uttarakhand Social perceptions as drivers of change and complementary strategies to adapt and cope with multiple stresses : Major stress as pointed out by the farmers intheir agriculture and livelihoods is created by climate change, which effects their seed production. Climate change is leading to more intense drought periods due to increasing temperature, while there is marked decrease in snow and uncertain rains resulting in loss of spring water sources. It was further observed that these variations are impacting the yield and food availability, as well as increasing instances of pests and diseases, e.g. in rice it has been observed that due to less snow has affected the life cycle of white grub. Another vital impact seen in the region is on women, who are sharing a major burden of agriculture and households. They have to spend extra time to meet their daily requirements of water and fuel-wood for cooking from forests as the resources are getting depleted at a very rapid pace. Other stress factors are presented in Figure 5, which show that socio-economic changes are the next most prominent category responsible for agrarian crisis in Uttarakhand. The major responsible factors include less income and high prices of food, under intensified lowland system, higher inputs create additional burden on farmers leading to economic crisis. However a positive approach of integrated system of livestock, agriculture and forest management in Uttarakhand adopted by farmers has improved availability of resources, is impacting land use patterns for sustaining their livelihoods in future.
Cultural changes are also impacting the current trends in rural areas. It was observed in
both districts of Uttarakhand that changes in customs, food habits and women’s
participation in cultural practices is directly linked to the local food crops production.

        Soci -economi chang

Land us an croppin     chang

              Cultura chang

    Natura resource chang

               Policies chnag

                                0       5    10      15       20    25      30      35      40
                                                          %

Figure 5. Percentage of aggregated responses in both zones on main drivers of change that affect
agriculture and local livelihoods

       6
       5
       4
     %
       3
       2
       1
        0
                    Adaptive strategy       Coping                 Destitution mechanisms

Figure 6. Distribution of responses for the two cases study to climate and other crisis and long-lasting
changes between adaptive strategies, coping mechanisms and destitution mechanisms

Based on different drivers impacting the strategies and coping mechanisms (Table 6)
some important observations from the study are -

    -      Conservation of own genetic material during food crises due to climatic
           adversities is considered as the most important coping mechanism to ensure food
           security.
- Exchange of seeds for cultivation at different locations minimizes risks of seed
loss, Other important strategy adopted by the farmers include crop rotationof
cereals, pseudo-cereals, pulses and changing location of crops and varieties for
renewing seed diversity.
- Change in cropping pattern to include cash crops and more intensive management
of crops were observed in Bageshwar. Some household studies revealed a critical
picture of progressive indebtedness, resulting from purchase of costly food, seeds
and other inputs, which is leading to selling of their agricultural lands and
migration to bigger cities for survival.
- Other multiple factors responsible for changes, are population/ demographic
changes, land fragmentation, policy issues, lack of research and development
promotion of new cultivars by public distributors in both the regions.
Strategies to improve the situation -
- Multiple strategies related to management and conservation of agro-biodiversity
will be required to beimplemented. Planting more varieties of crops is considered
a proven method of increasing biodiversity in the field and reducingdiseases and
pests losses. Priority to varieties with less dependence on chemical inputs
including both landraces and improved varieties can improve ecosystem resilience
(Annex IV). Planting varieties of different durations, different plant size
(short/tall), different soil and food web conservation effects, rotatimg varieties,
etc. can prove important in overcoming crisis.
- 12 species of legumes and around 33 varieties were identified by the farmers
which were. tolerant to drought and nutritionally excellent. Another 6 species of
millets, sorghum and pseudocereals (i.e. finger millet Eleusinecoracana, barnyard
millet Echinochloa crus-galli, foxtail millet Setariaitalica, JowarSorghum
bicolor, Bajara or pearl milletPennisetumglaucum, amaranth (Amaranthus sp.) are
specially used in case of such crisis and also for their nutritional and medicinal
value.Conservation of traditional knowledge and culture are considered relevant strategies to deal with future climate changes. Preparation of traditional food during festivals like Harela in Uttarakhand helps conserve agro-biodiversity and reinforces the socio-cultural system. Further research studies on these aspects will be undertaken in the second year of the project implementation.
You can also read