Sundaram Asset Management - July 2022

Page created by Alexander Flores
 
CONTINUE READING
Sundaram Asset Management - July 2022
Sundaram Asset Management

        July 2022
Sundaram Asset Management - July 2022
Sundaram Asset Management
                                                                                  Key milestones
▪ Headquartered in Chennai (India) with offices across India and     Journey of Sundaram Asset Management:

  in Singapore and Dubai

▪ Wholly owned by the well renowned Sundaram Finance
  Limited

▪ 25 years of experience in fund management and is among the
  pioneers in the Indian Fund Management industry with Assets
  Under Management of USD 6.2 billion ( 30 June 2022)

▪ Expertise in equities, fixed income and alternatives in India
                                                                   Retail Investor Base: Over 1.9 million folios
  with flagship funds ranked in top quartile

▪ In-depth proprietary research comprising of an experienced       Manages offshore investments through its
                                                                   Singapore subsidiary, which has set up a unit
  team of 25 investment professionals spread over Chennai,         trust investment platform in Singapore
  Mumbai and Singapore

                                                                                                                   2
Sundaram Asset Management - July 2022
Sundaram Asset Management-Group Structure

             Sundaram Finance Limited
              Listed in India on the BSE and NSE
             Reserve Bank of India regulated entity
                      68 year old company

                                 Owns 100% of

Sundaram Asset Management Company Limited
                      SEBI regulated entity
  26 year track record in the Indian fund management business

                                 Owns 100% of

Sundaram Asset Management Singapore Pte Ltd
      10 year old MAS regulated Fund Management entity

                                                                   3
Sundaram Finance Limited-Parent
     Sundaram Finance Limited, incorporated in 1954, has grown today into one of the most trusted
     financial services groups in India .

        Evolved from the legendary
     TVS group (Established in 1911),
    a diversified conglomerate and one                  SUNDARAM FINANCE SUBSIDIARIES
of the largest manufacturer and distributor
            of auto components

                                                                                           Sundaram Asset
                                                         Royal Sundaram                    Management Company
                                                         General Insurance                 Mutual Funds,
                                                                                           Portfolio Management, AIF

Sundaram Finance, the flagship company
           of the Sundaram group
                                                                             Sundaram BNP Paribas
is driving the financial services business of
                                                                             Home Finance
                   the group                                                 Home loans

Built significant reputation & goodwill over the decades
                                                                                                                       4
Sundaram Finance Limited-Parent

  Pioneer in the Leasing                First NBFC                  Over 600 Offices;
and Hire Purchase Business         to be Listed – in 1972         Over 4000 Employees

 Rated AAA (for Deposits)         Market Cap ~USD 2.5 billion Market cap has Grown at
  by CRISIL and ICRA                 as on 30 June 2022                CAGR
                                                               of 21.2% Since Listing
                             Business roots & core competency in credit

                                                                                          5
Sundaram AMC-Investment Manager

   TRACK RECORD & CAPABILITIES                                                    CUSTOMERS
• One of the earliest entrants in the Industry with 25 years of             • Managed over 5.6 million customer folios
  track history                                                               since inception
• First in the industry to launch a fund in the midcap space                • 1.9 million active customer folios
• Flagship Fund - Sundaram Midcap Fund had been a
  consistent outperformer with a CAGR of 20.2% in USD terms,                       DISTRIBUTION FOOTPRINT
  since its inception 20 years ago
• Strong in-house Research Team                                        • Over 50,000 empaneled distributors

• Investment Philosophy – Bottom up, research driven stock             • 94 customer care centers spread across 21
  selection with a focus on long term growth prospects.                  States, with offices in Singapore and Dubai

    AUM ~ USD 6.2 billion                                                    AUM has grown at a CAGR
     as on 30 June 2022                                                         of 17% since 2015

                                              Established fund manager

                                                                                                                         6
Sundaram AMC-Investment Manager
                                   In Rs. Bn                                                                 AUM Growth                                                                             AUM Composition

700                                                                                                                                                                                                                   Alternatives
                                                                                                                                                                                                            SPM            3%
650
                                                                                                                                                                                                             5%
600

550
                                                                                                                                                                                488         International
500
                                                                                                                                                                                                 14%
450

400
                                                                                                                                         374                           412
350
                                                                                                                                         342
300                                                                                                                     296
                                                                                                                                                          303
250                                                                                                                                                                                          Debt
                                                                                                       223                                                                                   14%
200                                                                                   200
                                                                                                                                                                                                                                     Equity
150                                                                  156                                                                                                                                                              65%
                 133               123              130
100

                                                                                                                                                                                June 2022
      Mar 2011

                        Mar 2012

                                         Mar 2013

                                                          Mar 2014

                                                                           Mar 2015

                                                                                            Mar 2016

                                                                                                             Mar 2017

                                                                                                                              Mar 2018

                                                                                                                                               Mar 2019

                                                                                                                                                          Mar 2020

                                                                                                                                                                     Mar 2021

                       Data as of 30 June 2022

                                                                                                                                                                                                                                              7
Sundaram Global Brand Fund

                             8
Sundaram Global Brand Fund - Highlights

    Morningstar Direct Rating
    Morningstar ESG Sustainability Rating : Average Three Globes*

                AN OPPORTUNITY FOR INVESTORS TO OWN A
                HIGH QUALITY PORTFOLIO OF INTERNATIONAL
                               EQUITIES

*Morningstar assigns Sustainability Ratings by ranking all scored funds within a Morningstar Global Category by their Historical    Sustainability Scores. The
ranked funds are then divided into five groups, based on a normal distribution, and each receives a rating from "High" to "Low. Percent Rank Rating Depiction
-Top 10%- High 5 globes ; Next 22.5%- Above Average 4 globes, ‘Next 35%- Average 3 globes, Next 22.5%- Below Average 2 globes, Bottom 10%- Low 1 globe

                                                                                                                                                                 9
Sundaram Global Brand Fund - Highlights
•     Unique portfolio investing in listed equities of 30 leading global brands
       – Global household names
       – Leaders in their sphere of business
       – Business spanning the globe and categories
       – Ability to sustain pricing power across economic cycles
       – Generate durable cash flows
       – Beneficiary of the global aspiration to buy more branded goods as disposable income rises

•     Fund Portfolio Available at reasonable valuations
       – 2023 weighted estimated PER of 16.0x
       – 11.5% average annual earnings growth over the next two years
       – 30.7% 2023 estimated average RoE
       – 2.6% 2023 estimated dividend yield

•     Strong performance
       – Fund has generated an annualized return of 6.7% in USD terms as of end June 2022.

    * Performance is as of the Cornerstone Class and has been annualized since inception. Data as of 30 June 2022

                                                                                                                    10
Sundaram Global Brand Fund
                                                                                                                                                                                                                                                                                                                                                                                               Value of $ 100,000 invested at launch

                               Global Brand Fund– USD 157,864                                                                                                                                                                                                                                                                                                    MSCI ACWI TR– USD 159,442

                    230000
                    210000
                    190000
                    170000
                    150000
                    130000
                    110000
                     90000
                     70000
                     50000
                             02-Jul-15

                                                                                                     02-Jul-16

                                                                                                                                                                             02-Jul-17

                                                                                                                                                                                                                                                     02-Jul-18

                                                                                                                                                                                                                                                                                                                             02-Jul-19

                                                                                                                                                                                                                                                                                                                                                                                                     02-Jul-20

                                                                                                                                                                                                                                                                                                                                                                                                                                                                             02-Jul-21
                                                                             02-Mar-16

                                                                                                                                                     02-Mar-17

                                                                                                                                                                                                                             02-Mar-18

                                                                                                                                                                                                                                                                                                     02-Mar-19

                                                                                                                                                                                                                                                                                                                                                     02-Nov-19

                                                                                                                                                                                                                                                                                                                                                                             02-Mar-20

                                                                                                                                                                                                                                                                                                                                                                                                                                                     02-Mar-21

                                                                                                                                                                                                                                                                                                                                                                                                                                                                                                                             02-Mar-22
                                                     02-Nov-15

                                                                                                                             02-Nov-16

                                                                                                                                                                                                     02-Nov-17

                                                                                                                                                                                                                                                                             02-Nov-18

                                                                                                                                                                                                                                                                                                                                                                                                                             02-Nov-20

                                                                                                                                                                                                                                                                                                                                                                                                                                                                                                     02-Nov-21
                                                                                         02-May-16

                                                                                                                                                                                                                                                                 02-Sep-18

                                                                                                                                                                                                                                                                                                                                                                                                                                         02-Jan-21
                                         02-Sep-15

                                                                 02-Jan-16

                                                                                                                 02-Sep-16

                                                                                                                                         02-Jan-17

                                                                                                                                                                                         02-Sep-17
                                                                                                                                                                 02-May-17

                                                                                                                                                                                                                 02-Jan-18

                                                                                                                                                                                                                                         02-May-18

                                                                                                                                                                                                                                                                                         02-Jan-19

                                                                                                                                                                                                                                                                                                                                         02-Sep-19
                                                                                                                                                                                                                                                                                                                 02-May-19

                                                                                                                                                                                                                                                                                                                                                                 02-Jan-20

                                                                                                                                                                                                                                                                                                                                                                                                                 02-Sep-20

                                                                                                                                                                                                                                                                                                                                                                                                                                                                                         02-Sep-21
                                                                                                                                                                                                                                                                                                                                                                                         02-May-20

                                                                                                                                                                                                                                                                                                                                                                                                                                                                 02-May-21

                                                                                                                                                                                                                                                                                                                                                                                                                                                                                                                 02-Jan-22

                                                                                                                                                                                                                                                                                                                                                                                                                                                                                                                                         02-May-22
                                                                                                                                                                                            Sundaram Global brand fund                                                                                                       MSCI ACWI Index

Data is as of the Cornerstone Class and includes dividends paid out Source: Bloomberg. Analysis: In house & as of 30 June,2022. Past performance may or may not be
sustained in future

                                                                                                                                                                                                                                                                                                                                                                                                                                                                                                                                                     11
Sundaram Global Brand Fund - Performance

                                                            Fund                   MSCI ACWI-TR Index                        Excess return

                       1 Month                               -8.7                             -8.4                                  -0.2

                    Year to Date                            -25.0                            -20.2                                  -4.9

                        1 Year                              -22.3                            -15.7                                  -6.6

                       3 years                               3.8                               6.2                                  -2.4

                       5 years                               5.6                               7.0                                  -1.4

                  Since Inception                            5.9                               6.9                                  -0.9

Returns in USD and in per cent & as of 30 June, 2022 using NAV of Classic option and includes dividends paid out. Inception date -2 Jul 2015.Performance greater than
one year on a compounded annualized basis. Data Source: Bloomberg Analysis: In house

                                                                                                                                                                        12
Performance of Sundaram Global Brand Fund – Classic Class
                                                                                                             1 Year   3 Years
                                                                                                                               5 years
                                                                                                   YTD       to end   to end
                                         2016     2017      2018      2019     2020      2021                                   to end
                                                                                                   2022       June     June
                                                                                                                              June 2022
                                                                                                              2022     2022
                    Sundaram Global
                                    3.2% 16.0%              -7.7% 25.9% 18.7% 17.2% -25.0%                   -22.3%    3.7%     5.5%
                      Brand Fund

                      Morning Star
                                     3.4% 23.1% -12.3% 23.8% 13.9% 16.8% -21.6%                              -17.8%    3.9%     4.5%
                    category average

                    Outperformance -0.2% -7.1% +4.6% +2.1% +4.8% +0.4%                            -3.4%      -4.5%    -0.2%    +1.0%

                    Number of Funds
                                    3434          3942      4577     4374      4614      4925      5950      5326      3851     2882
                     in MS Category

                       Peer Group
                                           59       95       18        42       20        59        84        87        67       50
                        Percentile
•   Source : Morning Star Direct . Returns in USD & includes dividends paid out * YTD as of end June 2022.
•   Morningstar Direct Rating :

                                                                                                                                          13
Distribution History of Sundaram Global Brand Fund
Year                    Distribution

2022                USD 3 cents per unit

2021               USD 15 cents per unit

2020                USD 6 cents per unit

2019               USD 20 cents per unit

2018               USD 17 cents per unit

2017                USD 6 cents per unit

2016                USD 3 cents per unit

                                                       14
Why are Brands important

Great brands:

  Develop a competitive moat through brand loyalty which enable them to:

     ▪   span categories

     ▪   span borders

     ▪   sustain pricing power across economic cycles

     ▪   resulting in durable Cash Flows and strong Balance sheet
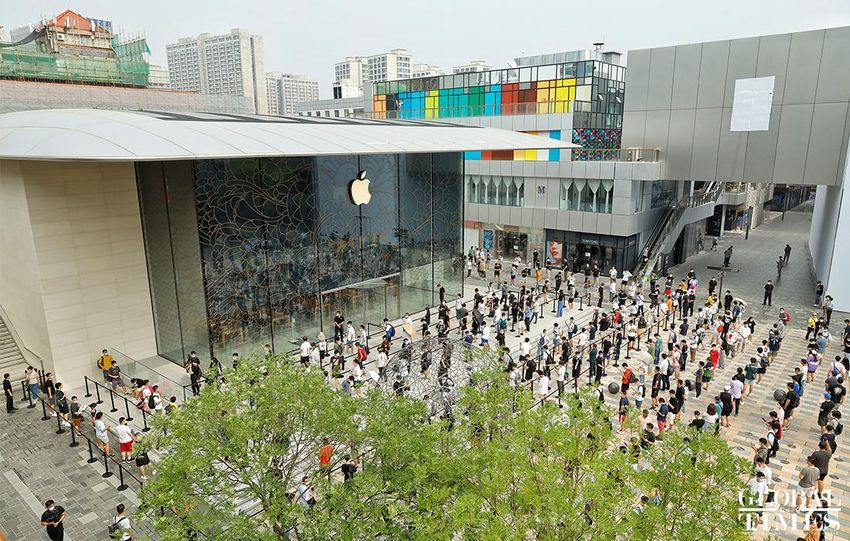
                                                                                15
Long queues at Apple’s stores during new product launch

                                                     16
Why are Brands important from an investment standpoint

                                                         Premium
               Competitive          Superior
Strong brand                                            sustainable
               advantage            earnings
                                                         valuation

                                                                      17
Why are Brands important
   Strong competitive positioning leads to exceptional returns for stakeholders
                                                                       Net Income               Market Cap
                                           Sales (USD Bn)                                                                RoE
Name                                                          Growth    (USD Bn)      Growth     (USD Bn)       Growth
                                                                                                                         2021
                                            2016      2021             2016   2021             Dec-16 Dec-21
APPLE INC                                  215.3      379.7    76%     44.6   100.8   126%     617.6   2913.3   372%     147.4
ALPHABET INC-CL A                           90.3      257.6   185%     19.5   76.0    290%     538.6   1921.8   257%     32.1
AMAZON.COM INC                             136.0      469.8   245%     2.4    33.4    1307%    356.3   1691.0   375%     28.8
LVMH MOET HENNESSY LOUIS VUI                41.6      76.0     83%     4.5    14.2    216%      97.0   417.8    331%     28.5
HERMES INTERNATIONAL                         5.8      10.6     85%     1.2     2.9    137%      43.4   184.6    325%     29.1

MSCI All Country World Index                                                                                     96%

Sales and Net Income data as of CY 2016 and CY 2021
Market Cap data as of 31-Dec-2016 and 31-Dec-2021
Source: Bloomberg and in-house analysis

                                                                                                                                 18
Superior Earnings Growth

                                            Quarterly Earnings and Revenue growth for the portfolio
   150%

   125%

   100%

    75%

    50%

    25%

     0%
           DEC-19       MAR-20         JUN-20         SEP-20          DEC-20        MAR-21          JUN-21         SEP-21   DEC-21   MAR-22
    -25%

    -50%
                                                               Earnings Growth   Revenue Growth

Sales and Net Income growth data for each quarter. March 2022 quarter data for 90% companies reported till 31 May 2022
Source: Bloomberg and in-house analysis

                                                                                                                                              19
Portfolio Valuations - Historical

                                                   SUGF Portfolio - Historical 1 Year Forward PE Ratio

                          24

                          22

                                                                                                                                         20.3
                          20

                          18                                                                                                             17.7

                                                                                                                                        17.0
                          16

                                                                                                                                         15.1
                          14

                          12

                          10
                            Feb 16 Jul 16 Dec 16 May 17 Oct 17 Mar 18 Aug 18 Jan 19 Jun 19 Nov 19 Apr 20 Sep 20 Feb 21 Jul 21 Dec 21 May 22
                                                                   PE      Average      +1 SD     -1 SD

Source: Bloomberg and in-house analysis

                                                                                                                                                20
Apple as an example
           Apple started with Mac and pivoted away over the years to durable product categories which
                                   benefitted from brand loyalty towards Mac
                                                                                                                        FY 2021 SALES
                                                                                                            Services
                                                                                                              19%

                                                                                              Wearables,
                                                                                              Home and
                                                                                             Accessories*                               iPhone
                                                                                                 10%                                      52%

                                                                                                        iPad
                                                                                                         9%

                                                                                                                  Mac
                                                                                                                  10%

*includes sales of AirPods, Apple TV, Apple Watch, Beats products, HomePod, iPod touch and Apple-branded and third-party accessories
Source: Bloomberg and in-house analysis

                                                                                                                                                 21
Well diversified spread of business across geographies

2021: BMW Revenue                             2021: LVMH Revenue

        2%
                                                    17%
 23%                      Europe                                    Asia
             42%          Asia                             42%      United States
                                              15%
                          Americas                                  Europe
                          Rest of the World                         Rest of the World
  33%                                                26%

                                                                             22
Well diversified spread of business across geographies

                                                    FY 2021: Coca-Cola Revenue
FY 2021: Apple Revenue

                                                                             North America

       7%                                            23%                     Europe, Middle East &
  8%                        Americas                                 33%    Africa
                            Europe
             42%                                                             Asia Pacific
19%                         Greater China
                                                   11%
                            Japan                                            Latin America
                            Rest of Asia Pacific         14%
       24%                                                     19%           Rest of the world

                                                                                             23
Strong Cash reserves

                                                     Net Cash reserves   Net Cash as a % of
                                Company
                                                         in USD Bn           Market cap

                               Mercedes Benz Group         27.0                33%

                               Samsung Electronics         88.8                23%

                               Alphabet Inc                111.1                6%

                               Cisco Systems                8.5                 3%

                               Facebook Inc                33.5                 4%

                               Apple Inc                   79.8                 3%

Data as on 31 Dec 2021
Source: Bloomberg and in-house analysis

                                                                                                        24
Cash creates shareholder value – Strategic Acquisitions

                                                                                                Anheuser
          Facebook                                Louis Vuitton
                                                                                                 Busch
• Facebook has been on a spree of             • LVMH acquired Tiffany, the global     • Mergers and acquisitions have been a
  acquisitions in the last decade which         luxury jeweler, in 2021 at $15.8 Bn     part of Anheuser ever since its
  includes                                                                              formation in 1987

•   Instagram - $1 Bn in 2012                                                         • AB InBev’s >$100bn acquisition of
•   Whatsapp - $19 Bn in 2014                                                           SABMiller in 2016 created the world’s
•   Oculus VR - $2 Bn in 2014                                                           first truly global brewer, with operations
•   Onavo - $200 Mn in 2013                                                             in almost every major beer market
•   Beluga–undisclosed sum in 2011

                                                                                                                                     25
Cash creates shareholder value – Consistent Share Buybacks

          Share Buybacks in the recent past

 Apple                 Facebook                  Microsoft
$90 Bn                  $75 Bn                    $60 Bn
in 2021                 in 2021                  in 2021

          Alphabet                Toyota Motor
           $50 Bn                   $2.8 Bn
           in 2021                  in 2021

                                                             26
When the going gets tough, the tough get going
  P&G Weighted Average Total Value Share YoY (bps) Change          LVMH’s share of the personal luxury goods market
                                                                       (excluding Selective Retailing Division)

Source: Company data, Morgan Stanley Research                 Source: Bain & Company, Morgan Stanley Research

                                                                                                                      27
Portfolio Construction Overview
Extensive back testing of data from 2002 has led to the development of a proprietary portfolio allocation and re-
balancing methodology

A list of 50 leading brands will be created using publicly available annual rankings of leading brand rating
agencies such as Interbrand, BrandZ, Forbes.
                                           Methodologies Adopted
                                                                Brand Strength              Brand Loyalty
              Agencies             Financial Analysis
                                                                   Analysis                   Analysis

             Interbrand                       ✓                           ✓                          ✓

                BrandZ                        ✓                           ✓                          ✓

                Forbes                        ✓                  At industry level                   X

                                                                                                                    28
Brand Rating Process

                  • Measure economic profits
                  • Forecast future values over 5 years and arrive at terminal value
 Financial
 Analysis         • Capital charge – Reference to Industry weighted average cost of capital

              •    Role of Brand Index (RBI)
              •    Determined by:
              •    Primary research
 Demand       •    Review of historical roles of brand for companies in that industry
 Analysis
              •    Expert panel assessment

              •     Brand strength Score (measures the ability of the brand to create loyalty )
              •     Score from 1-100
Competitive   •     Evaluation across 10 key factors
 Analysis     •     Performance on these factors is judged relative to other brands in the industry
              •     Proprietary formula used to connect the Brand Strength Score to a brand-specific discount rate
              •     Rate is used to discount brand earnings back to a present value

                                                                                                                                       29
An example of Brand Valuation Methodology

1. Financial Analysis          2. Demand Analysis        3. Competitive Analysis

   Economic Profit                 Role of Brand Index     Brand Strength Score
                                   (RBI)                   (BSS)

                         Brand                             Brand Risk (Discount
                        Earnings                           Rate)

4. Brand Value: Net present value of brand earnings

                                                                                   30
Investment Process
•   Portfolio will consist of listed equities of 30 leading global brands
•   Preference for brands with geographically diversified revenues in order to reduce portfolio risk
•   The chosen 30 brands split into 3 bands
      – Band 1 consists of the top 10 brands
      – Band 2 consists of the next 10 brands
      – Band 3 consists of the residual 10 brands
•   Individual stock weighting to depend on the band the stock belongs to
      – Band 1 stocks will have a weighting allocation of 5% each
      – Band 2 stocks will have a weighting allocation of 3% each     31
      – Band 3 stocks will have a weighting allocation of 2% each
•   Portfolio changes triggered by
      – Movement of brands within the 3 bands
      – Exit or entry of a brand from the top 30 list
•   Risk control
      – Single stock limit of 10%
      – Single sector limit of 50%
      – Intervention in instances of significant corporate governance issues

                                                                                                                       31
Current Portfolio
                                                                                   Well diversified & reasonable valuations
                                 Portfolio Characteristics                                              CASH, 8.4%
2023 weighted estimated PER                                                16.0x       SOUTH KOREA,
                                                                                           2.8%
Average Earnings Growth over next 2 years                                  11.5%
2023 estimated Dividend Yield                                               2.6%       BELGIUM, 2.4%

Average 2023 RoE                                                           30.7%        JAPAN, 3.9%
                                                                                                                                UNITED STATES,
                                                                                                                                    64.8%
                                     Cash, 8.4%
                      Industrials,
                         4.6%
                                                             Information
                                                             Technology,               FRANCE, 7.0%
               Financials,                                      27.6%
                  8.8%

        Consumer Staples,
             10.7%
                                                                                          GERMANY,
                                                                                            10.6%
         Communication
            Services,                                    Consumer
             12.8%                                     Discretionary,
                                                           27.2%

          Cost of buying 100 shares of each company in the                                             USD 929,818
          Global Brand Fund Portfolio as of end June 2022

                                                                                                                                             32
Top Ten Holdings
                                S.No    Name                              Weight (%)

                                 1     Alphabet Inc                          6.2

                                 2     Microsoft Corp                        6.0

                                 3     Apple Inc                             5.6

                                 4     Coca-Cola Co                          5.1

                                 5     Amazon.com Inc                        4.4

                                 6     LVMH Moet Hennessy Louis Vuitton      4.3

                                 7     Toyota Motor Corp                     3.9

                                 8     JP Morgan Chase & Co                  3.9

                                 9     International Business Machine        3.4

                                 10    Walt Disney Co                        3.3

                                                   TOTAL                     45.9
Portfolio as of 30 June, 2022

                                                                                                     33
Sundaram Global Brand Fund
                                                                                                                                       - Ratios and Valuations
                                                                                                           MSCI ACWI-
     Parameter                      Fund                    Parameter                    Fund                                           Parameter       Fund
                                                                                                              TR

     Alpha                           -0.8                   Standard                                                                    FY 22 P/E (x)   19.4
                                                                                          14.9                   15.1
                                                            Deviation

     Correlation                    0.96                                                                                                FY 23 P/E(x)    16.0
                                                            Beta                          0.9                      -
                                                                                                                                        FY 22 EPS
     Tracking Error                  4.2                                                                                                                8.0
                                                                                                                                        Growth (%)
     Information                                            Sharpe Ratio                  0.5                    0.5
                                                                                                                                        FY 23 EPS
                                     -0.3                                                                                                               15.1
     Ratio                                                                                                                              Growth (%)

     Turnover (%)                   20.1                    Sortino Ratio                 0.5                    0.5                    FY23 RoE (%)    30.7

Risk-Return Metrics are based on month end NAVs; since launch and have been annualised..Returns in USD used in calculation of risk ratios. Annualised
turnover in % as of 31 December 2021,all other data as of 30 June 2022. Source Bloomberg and In House Analysis.
Past Performance may not be sustained in Future

                                                                                                                                                                 34
Sundaram Global Brand Fund
                                                                                                                  - Peer Valuation Comparison
                                                                 Sundaram Global Brand Fund Global Large Cap Blend
                                                                                                Equity Average

                                            P/E(x)*                             16.3                               14.7

                                              P/B                                2.6                                2.6

                                  Long-term Earnings**
                                          (%)                                   13.2                               11.5

Source : Morningstar Direct. Data as of June 30, 2022.
*Price/projected earnings for a stock is the ratio of the company’s most recent month-end share price to the company’s estimated earnings per share (EPS) for the
current fiscal year. If a third-party estimate for the current year EPS is not available, Morningstar will calculate an internal estimate based on the most recently
reported EPS and average historical earnings growth rates. Price/projected earnings is one of the five value factors used to calculate the Morningstar Style Box. For
portfolios, this data point is calculated by taking an asset-weighted average of the earnings yields (E/P) of all the stocks in the portfolio and then taking the reciprocal
of the result.
**The Long term earnings indicate the estimated earnings growth over the next 5 years.

                                                                                                                                                                      35
Fund Overview
Name                                          Sundaram Global Brand Fund

Fund Domicile                                Singapore
Fund Structure                               Open ended Unit Trust
Investor Eligibility                         Accredited Investors and Institutional Investors
Dealing Frequency                            Daily
Investment Manager                           Sundaram Asset Management Singapore Pte Ltd
Trustee                                      HSBC Institutional Trust Services (Singapore) Limited
Global Custodian                             HSBC Banking Group
India Custodian                              HSBC India
Fund Administrator                           HSBC Singapore
Fund Auditor                                   KPMG Singapore
                       Please refer to the Information Memorandum of the Fund for details and risk factors.

                                                                                                                      36
Thank You

            37
Vijayendiran R
                                                                                                                                   Contacts
                                      Chief Executive Officer
                                      Sundaram Alternate Assets Limited
                                      M: +91 9841049635
                                      E: vijayendiran@sundaramalternates.com

Anish Mathew
Chief Executive Officer & Chief Investment Officer                             Ramesh Krishnamurthy
Sundaram Asset Management Singapore Pte Ltd                                    Chief Representative- Middle East & Africa Region
D: +65 65577086                                                                Sundaram Asset Management Company Limited
E: anishm@sundarammutual.sg                                                    (Dubai Representative Office)
                                                                               M: +971 55 5123639
Edmund Teo                                                                     E: ramesh.krishnamurthy@sundarammutual.com
Head-Business Development
Sundaram Asset Management Singapore Pte Ltd                                    Karthick Narayanan
D: +65 65577085                                                                AVP-International Business
E: edmundt@sundarammutual.sg                                                   Sundaram Asset Management Company Limited
                                                                               (Dubai Representative Office)
 Address                                                                       M: +971 55 6095049
                                                                               E: karthick@sundarammutual.com
 Sundaram Asset Management Singapore Pte. Ltd.
 50 Armenian Street, #02-02,Wilmer Place Singapore 179938

 Sundaram Asset Management Company Limited
 Sundaram Towers, 46 Whites Road, Chennai, Indiia
 www.sundarammutual.com

                                                                                                                                              38
Disclaimer
General Disclaimer: This document is issued by Sundaram Asset Management for your exclusive and confidential reference. This document is produced for
information purposes only. It does not constitute a prospectus or offer document or an offer or solicitation to buy any securities or other investment. Information and
opinion contained in this document are published for the assistance of the recipient only; they are not to be relied upon as authoritative or taken as a substitution for
exercise of judgment by any recipient. They are subject to change without any notice and not intended to provide the sole basis of any evaluation of the instrument
discussed or offer to buy. It is neither a solicitation to sell nor shall it form the basis of or be relied upon in connection with any contract or commitment whatsoever or
be taken as investment advice. The information and opinions contained in this communication have been obtained from sources that Sundaram Asset Management
believes to be reliable; no representation or warranty, express or implied, is made that such information is accurate or complete and it should not be relied upon as
such. Sundaram Asset Management neither guarantees its accuracy and/or completeness nor does it guarantee to update the information from time to time. This
communication is for private circulation only and for the exclusive and confidential use of the intended recipient(s). Any other distribution, use or reproduction of this
communication in its entirety or any part thereof is unauthorized and strictly prohibited. By accepting this document you agree to be bound by the foregoing
limitations. This communication is for general information only without regard to specific objectives, financial situations and needs of any particular person who may
receive it and Sundaram Asset Management is not soliciting any action based on this document. In the discharge of its functions, Sundaram Asset Management may
use any of the data presented in this document for its decision-making purpose and is not bound to disclose the same. For details about fund management services
and performance, please refer to the Disclosure Documents available at the offices of the AMC.

Securities investments are subject to market risks and there is no assurance or guarantee that the objectives of portfolios will be achieved. As with any
securities investment, the value of a portfolio can go up or down depending on the factors and forces affecting the capital markets. Past performance of the Fund
Manager or AMC may not be indicative of the performance in the future. Sundaram Asset Management is not responsible or liable for losses resulting form the
operations of any portfolio. The value of any portfolio illustrated in this document may be affected by changes in the general market conditions, factors and forces
affecting capital markets in particular, level of interest rates, various market related factors and trading volumes, settlement periods and transfer procedures. The
liquidity of investments are inherently restricted by trading volumes in the securities in which it invests. Investors in portfolios are not offered
any guaranteed returns.

                                                                                                                                                                           39
You can also read