COMPANY PERFORMANCE - JWD Group
←
→
Page content transcription
If your browser does not render page correctly, please read the page content below
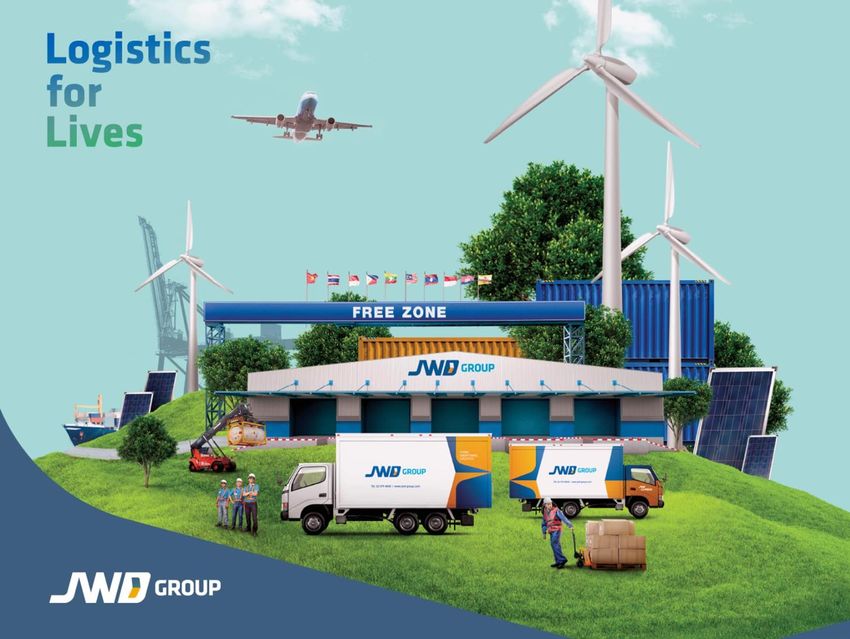
1Q2021
COMPANY PERFORMANCE
AGENDA

       1

                      2                 3               4                 5
Company Overview   Situation    Strategic Direction/   Project   Financial Performance
                   Updates            Strategy         Updates

                                                                                         2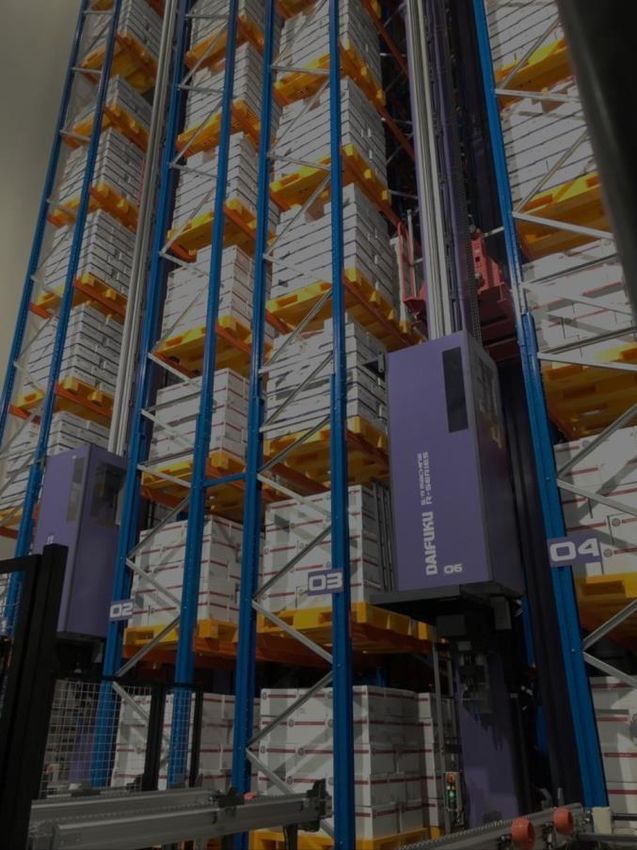
1Q2021 HIGHLIGHT
18.7% Total Revenue Outstanding Performance Projects in pipeline are
Growth YoY Recovery all on Track
Total revenue increased by 18.7% YoY mainly due to Performance of businesses impacted by Covid- New projects performance improved, establishing
Logistics Infrastructure business increased 19 recovered outstandingly strong foundation for future growth
outstandingly by 156.4% YoY Automotive business increased by 7.7% QoQ Warehouse Operation Updates
Transportation business increased by Dangerous Goods increased by 10.7% QoQ Acquisitions & Divestments
21.0% YoY On going Projects
Maintain satisfactory level of cold chain & Funding
general warehouse business performance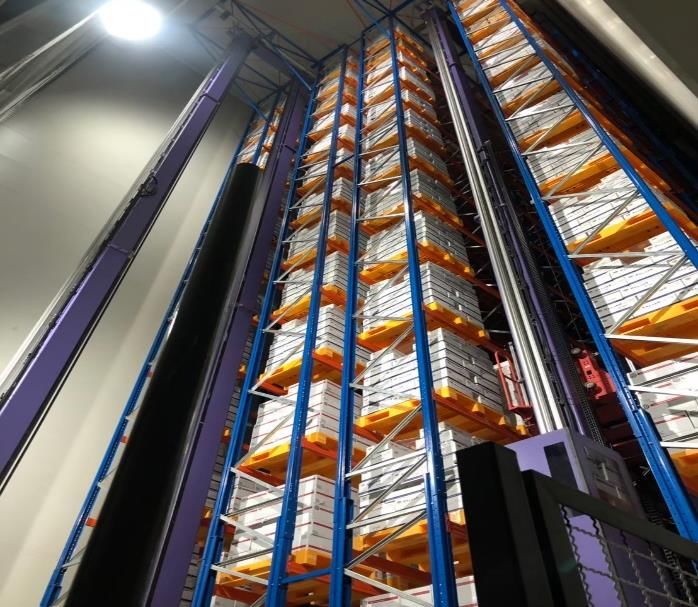
COMPANY BUSINESS STRUCTURE OVERVIEW

                         JWD GROUP TOTAL REVENUE IN Q1/2021

                                     1,147.1
       68.8%                         Million Baht

1   Logistics & Supply                                       22.4%                  8.8%
          Chain
                                                    2   Food Supply Chain   3   Other Business

                                                                                                 4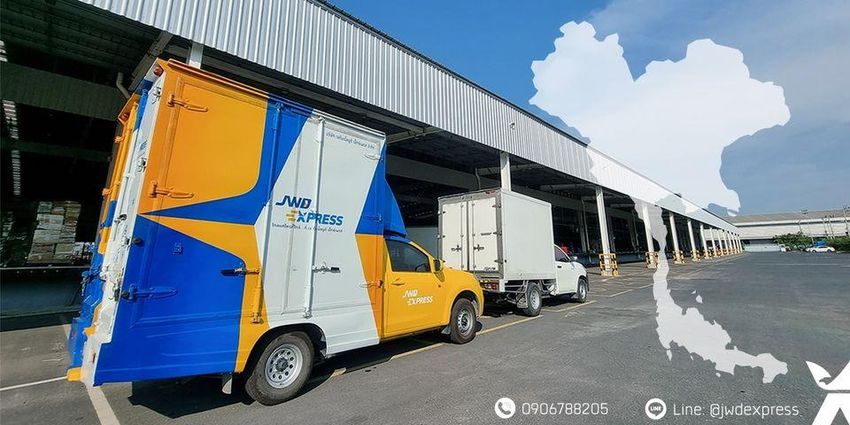
LOGISTICS & SUPPLY CHAIN SERVICES

               Warehouse                                Transportation & Distribution                         Relocation
           & Yard Management                                                                                   Service
•   General Goods                                   •   General Goods                             • Relocation services for household,
•   Dangerous & Chemical Goods                      •   Dangerous & Chemical Goods                  offices domestic and international
•   Automotive                                      •   Automotive
•   Cold Storage                                    •   Cold Storage
•   Document Storage                                •   Express
                                                    •                                                                      3.3%
                           50.3%                        Project Cargo
                                                                              11.3%

                                    Self Storage                      Logistics Infrastructure Management
                         • Self Storage
                         • Self Deposit
                         • Art Space
                                                                       • Barge Terminal
                                                                       • Rail Yard Management
                                                                                                                          68.8%
                                                                                                                     Logistics & Supply Chain Share of
                                                   1.1%                                         2.8%                                         Revenue

                                                                                                                                                   5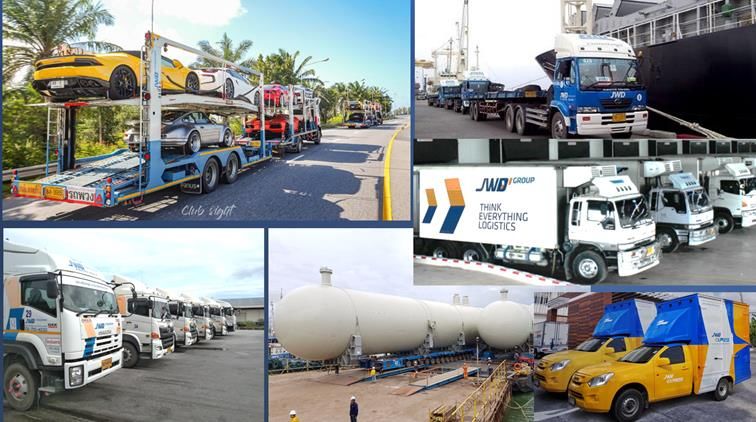
FOOD SUPPLY CHAIN SERVICES & OTHER

  22.4%                                                                                8.8%
Food Supply Chain                                                                       Other Business
Share of Revenue                                                                      Share of Revenue

                                  Food Services            Other Business Unit
                    • Food Procurement              • Property Development
                    • Food Processing               • IT Solutions for Supply Chain
                    • Food Trading & Distribution     Management
                                                    • Investment
                                                    • Other Income

                                                                                                   6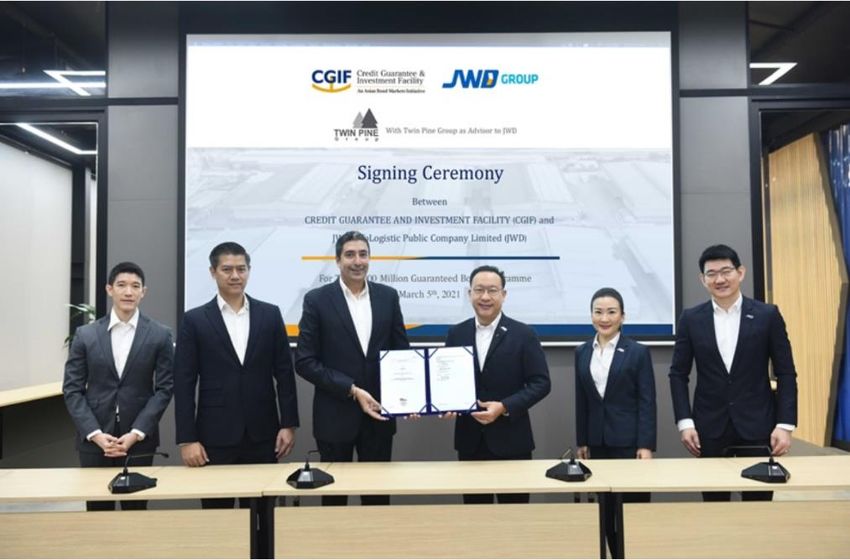
LEADER IN LOGISTICS WITH STRENGTHS IN DIVERSITY

                                       Diversity Across VALUE CHAIN
                                                Logistics Value Chain
                      Logistics          Transportation                   Warehouse &               Last Mile
                      Infrastructure     & Distribution                   Yard Management           Transportation

                    Port & Terminal                       General Goods

                      Railway                   Dangerous & Chemical Goods

                                                           Automotive
              B2B

                                                           Cold Chain

                                                       Record & Information
Diversity
 Across                                Project Cargo                      Fulfillment Center
CUSTOMER                                 Relocation                       Self-Storage
              B2C

SEGMENTS
                                                                              Art Space
                                                                                               Cold Chain     E-Commerce
                                                                                                Express         Logistics
              C2C

                                                  Diversity Across INDUSTRIES

                                                                                                                            7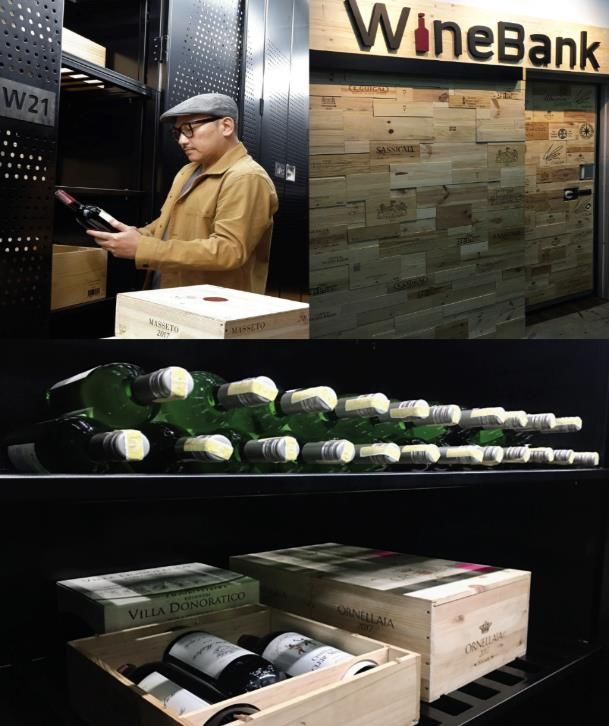
AGENDA

                     2

       1                               3              4                 5
                   Situation         Strategic       Project
Company Overview   Updates                                     Financial Performance
                                Direction/Strategy   Updates

                                                                                       8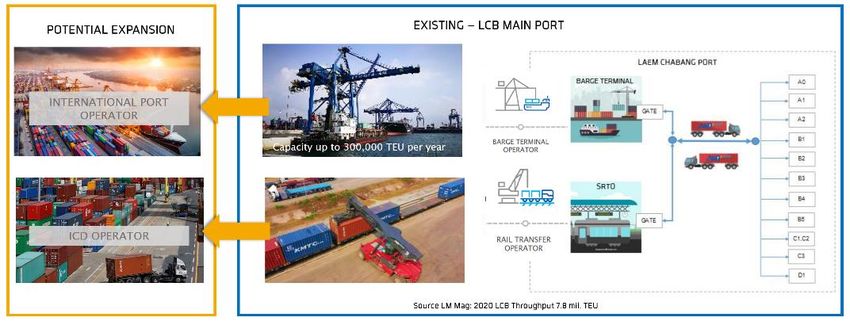
The new wave of the COVID 19 outbreak in the beginning of 2021 was not impacted to
JWD and had any opportunity for business
Economic Recovery Estimation Opportunity for JWD
Bank of Thailand GDP Reforecast Increasing demand on temperature control storage
Opportunity to manage supply chain for Covid-19
vaccine
Reforecast Period Higher storage turnover rate due to the pandemic
Business recovery outlook
4.1% 4.7%
3.2% 3.9%
2.4% 3.0%
-6.1%
2016 2017 2018 2019 2020* 2021E 2022E
*Outturn , E Estimation
The Thai economy would expand at a slower pace due to the new wave of the COVID 19 outbreak in the beginning of 2021 and the re-opening plan that was
less relaxed than expected
The economy would continue to recover, but the recovery remains highly uncertain with downside risks to growth.
Source: Bank of Thailand Resources and Estimation 9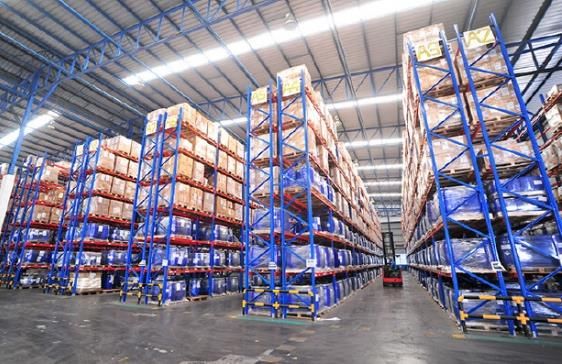
Q1 Situation Update and Outlook: Performance during Q1/2021 is continue growing

                                                               Performance Outlook
                              Quarterly Outlook                                                              Yearly Outlook

                                                               Seasonal Drop
                                                                & COVID-19

              Seasonal Drop
               & COVID-19

    Q1/20       Q2/20         Q3/20       Q4/20        Q1/21         Q2/21               Y2019       Y2020       Y2021F       Y2022F    Y2023F

                                            Actual Performance                 Forecasted Performance

                                                   Q1/2021 Performance & Y2021 Outlook

In Q1/2021, the core business units such as cold chain, chemical and dangerous goods, general warehouse, automotive business had experienced an
improved performance. Especially in chemical and dangerous goods and automotive businesses which continue recovery as automotive supply chain
remain unaffected from the new wave of COVID-19 in Thailand.

                                                                                                                                                  10
AGENDA
3
1 2 4 5
Situation
Strategic Direction/ Project
Company Overview Strategy Financial Performance
Update Updates
11JWD 5 YEARS BUSINESS ROADMAP
Expected 10
Revenue Growth 15% Net Profit Growth
5 YEARS GROWTH Performance Billion
To Become Top Diversified Logistics Business in Asia:
Existing Business New S-Curve
4. GROW B2C 5. ENTER
1. ACQUIRE & 2. BUILD & 3. REGIONAL
SEGMENT NEW SECTOR
SCALE UP SCALE UP EXPANSION
THROUGH JV
E-commerce
Group Cold Chain Vietnam,
Business Property
Transport Regional Hub Cambodia,
Model Solutions
Indonesia
Expansion
12ACQUIRE & SCALE UP GROUP TRANSPORT
To Serve Multimodal Transport Across All Platforms
Sea & Rail Transport Service Acquire VNS To Strengthen Land Transport Service
Strategic Roadmap of Group Transport after Acquisition
2021
Fleet Efficiency Management & Asset Utilization
Land Transport Service
serving all types of transportation UPSTREAM & DOWNSTREAM
2021-2023 for Automotive Logistics
Milk-run
Expand into Complex Automotive cross border
Automotive Logistics Part warehousing
Assembly
2024
Capability to SCALE UP & Become dominant player in ThailandBUILD COLD CHAIN REGIONAL HUB
To tap with strong demand growth from regional urbanization
Existing Footprint: 2 locations in Reginal Distribution Center with Nationwide Coverage
Greater BKK and 1 in Mahachai
Largest storage capacity 100,000+ Tons
Project Pipeline 2021-2023
Cutting edge technology & Robotic system
Target Locations
CURRENT
Mahachai
Suwintawong
Mahachai Bangna K.M.19
(Seafood)
50,000 Sq.m. Suwinthawong FUTURE
(Food Processing) INDUSTRIAL SECTOR
PACM 12,705 Sq.m. Khon Kaen
10,800 Sq.m. Saraburi
Start operation Songkhla
Q4/2021
FUTURE
DISTRIBUTION CENTER
Chiang Mai
Phitsanulok
Bangna Km.19 Phuket
(Food Retail Business)
16,364 Sq.m. Additional Capacity:
approx. 40,000 pallet positionsREGIONAL EXPANSION
Continue invest & expand business focusing on Thailand
Vietnam, Cambodia & Indonesia 1,000,000+ sq m.
ASEAN
800,000+ sq m.
VIETNAM
KEY BUSINESS PLAN
Work more closely for future collaboration
Expand business into new sectors namely chemicals
and automotive
CAMBODIA
KEY BUSINESS PLAN
Provide fully integrated logistics services to
double size the business in 5 years.
Dry & cold storage
Dry port
Nationwide distribution & express
delivery
INDONESIA
KEY BUSINESS PLAN
TOTAL FOOTPRINT Scale up business of cold chain service through M&A
JWD & Strategic Partners Expand business into new sectors namely chemicals and
1,800,000+ sq. m. automotiveGROW B2C SEGMENT
E-COMMERCE BUSINESS MODEL EXPANSION
SELF-STORAGE ORDER FULFILLMENT LAST MILE DELIVERY
Domestic Expansion Order Fulfillment for Last Mile Delivery for
-No. 1 in Thailand- General Goods General Goods
-Service area 30,000 Sq.m.-
Order Fulfillment for Last Mile Delivery for
Regional Platform
Largest self-storage operator in Temperature Controlled Temperature Controlled
Asia Goods GoodsENTER NEW SECTOR THROUGH JV
PROPERTY SOLUTIONS
ORIGIN JWD INDUSTRIAL ASSET
Logistics & Industrial Properties Developer
SCOPE OF SERVICES
FOCUS ON SOPHISTICATED SECTORS Logistics Park
Chemical & Dangerous goods
Led by TECHNOLOGY & INTELLIGENCE Industrial Estate
Cold Chain SOFTWARE for solutions management Automated Factory
Automotive Urbanized Properties & Solution
Order fulfillment REITAGENDA
4
1 2 3 5
Strategic Project
Company Overview Situation Financial Performance
Update Direction/Strategy Updates
18PROJECTS UPDATE OVERVIEW
Warehouse Operation Updates Acquisitions & Divestments On going Projects Funding
• • • CGIF
• New ASRS warehouses VNS JWD x ORI Project
started operation : • EMLOG • Logistics Infrastructure
Cold storage B9, DataSafe • JWD Navanakorn : REIT business update
• Wine Bank started operation • Food Story (Living Mobile) • JWD cold chain express &
• PACM Project on progress overseas business updateWAREHOUSE OPERATION UPDATES : ASRS WAREHOUSES
ASRS Warehouse : DataSafe ASRS Warehouse : Cold Storage B9
Storage Capacity Started Operation Storage Capacity Started Operation
4,955 Sq.m Jan.2021 12,000 Pallet Mar.2021
Location Occupancy Rate Location Occupancy Rate
29% Mahachai 60%
SuwinthawongWAREHOUSE OPERATION UPDATES : WINE BANK / PACM COLD STORAGE
PACM Cold Storage
OR
Self Storage : Wine Bank
Storage Capacity Started Operation Storage Capacity Expected completion
36,000 Bottles Jan.2021 10,800 Sq.m Q4/2021
Location Occupancy Rate Capex Project Progress
JWD Store It! Siam 34% 23%
500 MB.ACQUISTIONS & DIVESTMENTS : VNS
Acquire VNS To Strengthen Land Transport Service
About VNS
Key player in automotive logistics especially
milk-run capability, project cargo and cross
border transport.
KEY PURPOSE
To Serve Multimodal Transport Across All Platforms To Lists the transport business by Y2022
Sea & Rail Land Transport ServiceACQUISTIONS & DIVESTMENTS : EMLOG
EMLOG Logistics & Warehousing Pte Ltd. (“EMLOG”)
JWD ASIA Revenue
Unit: THB Million
60.3
53.5 55.3
49.6 48.8 49.8
Acquired of the 10% additional shares in EMLOG 41.2 40.8 41.4
Logistics & Warehousing Pte Ltd. (“EMLOG”) from
50% to be 60%, resulting that EMLOG is an indirect
subsidiary of JWD (Registered on 22 March 2021)
Q1/19 Q2/19 Q3/19 Q4/19 Q1/20 Q2/20 Q3/20 Q4/20 Q1/21ACQUISTIONS & DIVESTMENTS : FOODSTORY / JWD NAVANAKORN
About FoodStory
FoodStory
Is an application for any restaurant type
Built to suit : JWD Navanakorn
Vendor / Supplier Restaurant Consumer /
Raw Material Chain On-demand
Sourcing JWD sold built to suit warehouse to AIMIRT
Total building leasable area : 6,620 Sq.m
Key Activity: Key Activity:
1st mile delivery • Distribution Center Total lease price : Approx. 123 MB.
• Sorting, Pick & Pack
• VAS activity
• Last Mile Delivery 30 Years leasehold (2021 to 2051)
• CODON GOING PROJECTS : JWD x ORI
ORIGIN JWD INDUSTRIAL ASSET
Logistics & Industrial Properties Developer
FOCUS ON SOPHISTICATED SECTORS
PROJECT SUMMARY
JWD entered a joint venture with Origin Company Limited called “ORIGIN JWD
Chemical & Dangerous goods INDRUSTRIAL ASSET COMPANY LIMITED” (ORJ) to focus on logistics related assets .
Storage Capacity (Y2021) Purpose
Cold Chain (2 Projects)
Establish built to
62,000 Sq.m
suit/Use for JWD
Expansion
Automotive
CAPEX Expected Date of Start Project
Order Fulfillment Center
Million
1,000* Baht Q2/2021
*Tentative BudgetON GOING PROJECTS : LOGISTICS INFRASTRUCTURE
45,000 42,000 42,000 42,000
39,143
40,000
35,000 31,835
30,000 27,792
25,000
20,000
15,000
10,000
5,000 428 688
-
Q1-20 Q2-20 Q3-20 Q4-20 Q1-21 Q2-21F Q3-21F Q4-21F
21,000 18,921 18,829
19,000 18,000 18,000 18,000
17,000 14,820 14,661
15,000 13,491
13,000
11,000
9,000
7,000
5,000
3,000
1,000
Q1-20 Q2-20 Q3-20 Q4-20 Q1-21 Q2-21F Q3-21F Q4-21FON GOING PROJECTS : EXPRESS / OVERSEAS
The opportunities through COVID-19 situation
JWD Cold Chain Express Vaccine distribution in Cambodia
JWD Cold Chain Express has been receiving a JWD Asia Cambodia is supporting as part of There
positive response order increase, supported by are 643,000 doses of Sinovac's COVID-19 vaccine
COVID-19 situation and increase order by the delivered by a 2-8 ° C temperature-controlled
seasonal products E.g. durian vehicle. The first to go to the province In CambodiaFUNDING : GUARANTEED BOND BY CGIF
CGIF’s credit rating (AAA on national scale)
The Credit Guarantee and Investment Facility (“CGIF”) has
JWD partners with Twin Pine Group to issue AAA rated debentures guaranteed JWD first issuance of THB 700.0 million under its
guaranteed by CGIF Developing ESMS with globally-recognized THB 1.9 billion Guaranteed Bonds Programme with the
standards for management of environmental and social impacts JWD to
proceeds AsiabeCambodia is supporting
used in the investmentas ofpart of There
JWD’s domestic
are 643,000 doses of Sinovac's COVID-19 vaccine
logistics and supply chain business and will help to increase
delivered
service capabilitybyand
a drive ° C temperature-controlled
2-8 growth according to the set targets
vehicle. The first to go to the province In CambodiaAGENDA
5
1 2 3 4
Situation Strategic Project
Financial
Company Overview Performance
Update Direction/Strategy Updates
29Overall Financial Highlights
Unit: THB Million
50.6%
Net Core Profit*
3,922.4
64.9
3,297.6
13.7
3,660.2
94.5 (Q1/2021) 140.8 MB
93.5 MB (Q1/2020)
75.9
28.0%
26.4% 27.5% 25.7%
23.8%
24.9% GPM 7.8%
9.9% 12.3%
9.7%
6.4% 7.4% 7.1% NPM Finance Cost
3,208.0
3,565.7
3,857.6
Total Revenue
(Q1/2021) 47.2 MB
51.2 MB (Q1/2020)
1,075.2 1,147.1
966.1 78.6 Extra items
15.5 18.7
23.1 Other income 13.5%
Revenue from
1,059.8 1,049.8
943.0 rental and
rendering of
SG&A
service
Y2018 Y2019 Y2020 Q1/20 Q4/20 Q1/21
(Q1/2021) 170.6 MB
150.3 MB (Q1/2020)
*Remark: Net Core Profit refers to Net Profit attribute to owners of the company
30
**Revenue Y2018 include Gain on sale of assets to trustOverview of Financial Information
68.8% 50.3% 8.8%
1.1 1.1.A
General Goods
Warehouse & Yard
1 Management
11.3% 11.8%
1.2 1.1.B
Logistics Dangerous Goods
& Supply Transport & Distribution
Chain
3.3% 10.2%
JWD 1.1.C
1.3 Automotive
Financial Relocation
22.4%
Tracking 16.9%
1.1%
2 1.4
1.1.D
Cold Storage
Food Supply Self Storage
Chain
2.6%
2.8% 1.1.E
8.8% 1.5 Document Storage
3 Logistics Infrastructure
Other
Business
31Operating Revenue Breakdown by Business Structure
Operating Revenue Breakdown by Business Structure
Unit: THB Million Operating Revenue from Logistics Business Unit by Service
3,857.6 Unit: THB Million Warehouse & Yard
0.4% 576.1 Management and
3,565.7 568.5
Other business 0.7% Document Storage
Food Service 3,208.0 26.0%
534.2
0.6% 17.6%
12.5%
130.0
121.8
YoY +11.3% 107.4 Transportation &
QoQ -0.9% Distribution
Logistics &
Supply Chain 86.9% 81.7% 73.6% 1,059.8 1,049.8 56.3
943.0 43.7
Relocation
0.4% 0.3% 38.3
0.6% 24.5%
21.2% 28.6% 27.7 Logistics Infrastructure
12.6 32.3
78.3% 71.0% 75.2% 12.1
5.7
12.3 Self Storage & Art
Q1/20 Q4/20 Q1/21 Space
Y2018 Y2019 Y2020 Q1/20 Q4/20 Q1/21
YOY
• As a result, the Company has increased revenue mainly due to warehouse and yard management especially general warehouse, chemical & dangerous goods and cold storage,
• Transportation has increased revenue from increasing service volume in controlled-temperature chilled and freeze product, cross border and car carrier.
• Logistics infrastructure has increased revenue from increasing service volume at the Barge Terminal.
• Self storage and art space has increased mainly due to the increase in self storage space and launched wine bank storage service in Q1/2021.
32Gross Profit & Gross Profit Margin Breakdown
Gross Profit by Business Structure Gross Profit Margin of Logistics by Services
Unit: THB Million Unit: THB Million
38.7%
997.9 37.8%
4.3% 911.0 34.8%
Warehouse &
848.2 4.8%
Food Service Yard Management
4.9% 29.6%
28.5%
Logistics
25.9% Infrastructure
28.1%
27.2%
YoY +6.4% Relocation
99.3%
QoQ +9.5% 21.7%
Logistics &
Supply Chain 97.6%
96.7% Transportation &
14.5% 15.0% 14.5%
246.3 239.3 262.0 Distribution
2.9% 7.1% 5.0%
100.7% 96.4% 97.3%
Other -2.5% -1.0% -4.1% -3.6% -3.5% -2.4%
Y2018 Y2019 Y2020 Q1/20 Q4/20 Q1/21
26.3% 14.6%
-58.0% Self Storage &
YoY Art Space
• Gross profit has increased YoY mainly due to the higher revenue from some Q1/20 Q4/20 Q1/21
especially chemical & dangerous goods ,cold storage and transportation.
• Gross profit from logistics and supply chain has increased mainly due to the
better cost control for warehouse and yard management.
33Warehouse & Yard Management Services Overview
Warehouse & Yard Management Revenue Breakdown Warehouse & Yard Management Gross Profit Margin Breakdown
Unit: THB Million, % Unit: %
2,124.4 2,114.4
1,964.2 16% 18%
Document Storage
16% 47.4% 48.9%
General Goods 45.7%
47.6% 45.0% Cold Storage
26% 43.0% 44.9%
21% 42.6% Dangerous Goods
25% 41.4%
Dangerous Goods
34.5%
35.1% Automotive
22%
Automotive 22% 18% 28.3%
25.5%
15.9%
30% 36% 568.5 534.2 576.1
31% 18% 17%
Cold Storage 17%
21% 23% 23% General Goods
10.6%
22% 20% 20%
5% 5% 6% 33% 34% 34%
Document Storage
5% 5% 5%
Y2018 Y2019 Y2020 Column1 Q1/20 Q4/20 Q1/21 Q1/20 Q4/20 Q1/21
YoY
• Revenue from warehouse and yard management increased mainly due to rise in revenue of dangerous goods and cold storage warehouse as a result of the improvement of export and
import activities.
• However, revenue from automotive was improving from the fast recovery of automotive industry.
34Warehouse & Yard Management Services Drivers
A. Warehouse & Yard Management: General Goods
Revenue & Gross Profit Area & Occupancy Rate Explanation
Unit: THB Million Unit: ‘000 Sq.m.
92.0% 92.8%
YoY
10.2% 20.6% 25.9% 28.3% 10.6% 15.9% 89.3%
GPM OR Gross Profit from general goods decreased due to:
391.0 • The commencement of operation of JWD Nava
343.4 Nakhon project with the total area of 6,000
318.8
128.1 145.8 sq.m in November 2020., where the Company
127.7
had recognized an initial operation setup cost
101.2 104.1 89.9 100.5
70.9
32.6 29.5 9.5 16.0
Y2018 Y2019 Y2020 Q1/20 Q4/20 Q1/21 Q1/20 Q4/20 Q1/21
Revenue Gross Profit Area Occupancy Rate
B. Warehouse & Yard Management: Dangerous Goods Terminal and Chemical
Revenue & Gross Profit Dangerous Goods Yard Throughput Explanation
Unit: THB Million Unit: TEU*
YoY +1.3%
YoY
41.7% 45.1% 40.0% 43.0% 47.6% 44.9% Revenue from dangerous goods terminal and
GPM QoQ +4.5%
556.8 chemical increased due to:
497.3 43,263 • Positive impact from the Suez crisis where
452.2
42,711 the company had increasing revenue from
the storage during the quarter
251.0
207.4 181.0 41,418
122.1 122.2 135.3
52.5 58.2 60.7
Y2018 Y2019 Y2020 Q1/20 Q4/20 Q1/21 Q1/20 Q4/20 Q1/21
Revenue Gross Profit TEU*= Twenty-Equivalent Unit
35Warehouse & Yard Management Services Drivers (Cont’d)
C. Warehouse & Yard Management: Automotive
Revenue & Gross Profit Area & Occupancy Rate Explanation
Unit: THB Million
92.5% QoQ
32.8% 34.9% 26.0% 35.1% 25.5% 34.5% 71.8% 65.4%
GPM
Revenue from automotive increased due to:
• Increasing revenue by baht 8.4 or 7.7% due to
437.5 464.9 1,053.7 1,046.4 1,051.1 the automotive business was recovered
387.8 faster than expectation.
658.4 658.4 658.4 Revenue Portion
143.5 162.1
101.0 124.8 109.0 117.4
43.8 40.5 395.3 388.0 392.6 29% 34%
27.8
Y2018 Y2019 Y2020 Q1/20 Q4/20 Q1/21 Q1/20 Q4/20 Q1/21
Revenue Gross Profit
37%
Yard Area On-site Area
Storage yard Service yard Transport
D. Warehouse & Yard Management: Document Storage
No. of Carton Explanation
Unit: THB Million Unit: No. of Carton
49.9% 46.1% 48.9% 47.4% 48.9% 45.7%
YoY +5.4% YoY:
GPM QoQ +2.0% Revenue from document storage
increased due to:
106.6 112.0 117.2
1,021,990 • Rise in number of cartons by 5.4% from
Q1/2020
1,001,476
53.2 51.6 57.3
29.1 29.0 29.1 969,910
13.8 14.2 13.3
Y2018 Y2019 Y2020 Q1/20 Q4/20 Q1/21
Q1/20 Q4/20 Q1/21
Revenue Gross Profit
36Warehouse & Yard Management Services Drivers (Cont’d)
E. Warehouse & Yard Management: Cold Storage
Revenue & Gross Profit Area & Occupancy Rate Explanation
Unit: THB Million Unit: ‘000 Sq.m.
39.4% 41.9% 43.4% 42.6% 41.4% 45.0% YoY
GPM 79.7%
74.2% 74.2% Revenue from cold storage increased due to:
766.2
• Rise in cold storage demand from seafood
604.0 647.3
products & Valued Added Service.
332.5
237.8 271.2 79.1 79.1
188.4 184.1 193.8 78.3
80.2 76.3 87.1
Y2018 Y2019 Y2020 Q1/20 Q4/20 Q1/21 Q1/20 Q4/20 Q1/21
Revenue Gross Profit Area Occupancy Rate
Q1-2021 Proportion of Products
Multi
Type
30% Seafood
45%
8%
17%
Vegetable
&Fruits
Poultry&
Meat
37Transportation & Distribution Services Drivers
1.2 Transportation and Distribution Business 1.2 Transportation and Distribution Business (Domestic)
Revenue & Gross Profit No. of Trips Explanation
Unit: THB Million Unit: No. of Trips
YoY +3.9% YoY:
16.9% 13.9% 16.2% 14.5% 15.0% 14.5% QoQ-0.7 %
GPM Revenue from transportation and distribution
increased due to:
455.8 461.1
47,856 • Significant increase of volume of
47,533
435.4 temperature-controlled product
transportation and car carrier
45,765 transportation.
Q1/20 Q4/20 Q1/21
1.2 Transportation and Distribution Business (Cross border)
No. of Trips Explanation
Unit: No. of Trips
130.0
YoY +73.6% YoY:
121.8
107.4 10.4 Revenue from cross border transportation and
5.5 9.0 Cross Border QoQ +40.7%
76.9 distribution increased due to:
70.4
64.0 • Majority of revenue were attributed to JWD
110.7 119.7 Domestic 1,957
101.2 Asia Cambodia instead while overall trips
15.5 18.3 18.9 1,391
1,127 and revenue significantly increased
Y2018 Y2019 Y2020 Q1/20 Q4/20 Q1/21
Total Revenue Gross Profit
Q1/20 Q4/20 Q1/21
38Relocation & Self Storage Drivers
1.3 Relocation
Revenue & Gross Profit No. of Jobs Explanation
Unit: THB Million Unit: No. of Jobs
YoY -3.9% YoY:
24.1% 32.9% 23.1% 28.1% 27.2% 21.7%
GPM QoQ -11.6% Revenue from relocation decreased due to:
323.2 • Decreasing revenue due to the lower of
269.4 number of jobs.
1,355
1,247 1,198
181.3
78.0 88.7
41.9 43.7 56.3 38.3
12.3 15.3 8.3
Y2018 Y2019 Y2020 Q1/20 Q4/20 Q1/21
Revenue Gross Profit Q1/20 Q4/20 Q1/21
1.4 Self Storage
Revenue & Gross Profit Area & Occupancy Rate Explanation
Unit: THB Million Unit: Sq.m. 45.9%
44.2%
26.3% 39.5%
Occ. YoY:
-9.5% 14.6% Rate
-47.2% -58.0% Revenue from self storage increased due to:
-121.0% GPM 10,632 13,032
• Higher number of branched and area
2,400 2,400 available for service
32.6
8,889 1,743 1,743 • Higher revenue due to Art space services.
960 960 960
16.2
12.3
Gross profit increased due to higher revenue
12.1
4.5 5.7
3,384 3,384 3,384 • In Q1/2021, launched wine bank storage
3.2 1.8
service at JWD Store it, Siam branch
3,395 3,395 3,395
-5.4 -3.1 -3.3
-7.6 1,150 1,150 1,150
Q1/20 Q4/20 Q1/21
Y2018 Y2019 Y2020 Q1/20 Q4/20 Q1/21
Revenue Gross Profit
SKT SAM TRM RAM RAMA9 PK
39Logistics Infrastructure & Food Supply Chain Drivers
1.5 Logistics Infrastructure
Revenue & Gross Profit No. of Trips Explanation
Unit: THB Million Unit: No. of Trips
31.1% 29.5% 29.6% 28.5% 25.9%
YoY:
9.5%
GPM YoY +178.1% Revenue from logistics infrastructure
76.4 QoQ +15.2% increased due to:
• Mostly contributed from the consistently
53,804 increased volume of Barge terminal since
41.3 41.5 46,655 the start of its operation.
27.7 32.3
22.5 39,143
12.9 12.6 19,346 31,835
3.9 3.7 7.9 8.4
18,918 14,820 14,661
Y2018 Y2019 Y2020 Q1/20 Q4/20 Q1/21
Q1/20 Q4/20 Q1/21
Revenue Gross Profit Rail Yard Barge Terminal
2. Food Supply Chain
Revenue & Gross Profit CSLF Past Performance Explanation
Unit: THB Million Unit: THB Million
10.3% 6.8% 4.4% 3.6% 5.6% 5.1%
16.2% YoY:
6.8% 4.6% GPM
GPM Revenue from food supply chain increased
1,001.3
999.2 due to:
• Additional sales volume of cut vegetable
628.8 and liquid eggs.
624.3
554.5 Gross profit increased due to:
399.8
303.4 257.1 • According to higher revenue of food
199.5 service business.
41.4 42.7 43.9 7.1 17.0 13.2 79.1 42.5 46.2
Y2018 Y2019 Y2020 Q1/20 Q4/20 Q1/21 Y2018 Y2019 Y2020
Revenue Gross Profit Revenue Gross Profit
40Equity Income from Affiliates
Equity Income
Performance* Country Company Explanation
Unit: THB Million
YoY: Equity Income increased by 12.3
103.6 Transimex
Vietnam million or 6.6
(23.8%)
PPSP
(14.6%)
67.5
Bokseng
(40.0%) YoY: Equity Income decreased by THB
Cambodia 19.5 million
JWD Asia Cambodia
52.9 (50.0%)
JVK Cambodia
28.9 29.5 31.0 (50.0%)
17.1 Siam JWD
19.4
(42.5%)
2.5
Thailand YoY: Equity Income remained stable
8.3 0.2 4.3 CJ JWD
1.0 0.8 (1.5) … 0.4 (49.0%)
(0.1) 0.1
(0.2) (0.5) (3.9) (11.2)
(1.7) (0.4) (2.6)
(8.2) (6.3) (7.0) YoY: Equity Income slightly increased
Other by THB 0.6 million
Samudera JWD
Y2018 Y2019 Y2020 Q1/20 Q4/20 Q1/21 (48.7%) YoY: Equity Income decreased by
Indonesia THB 0.9 million
Adib Cold Logistics
Vietnam Cambodia Thailand Other Indonesia (32.6%)
Not that: the Company received increased amount of equity income from Transimex Corporation (TMS) of Baht 31.0 MB. Moreover, the equity income decreased
from loss from liquidation business in Laos of Baht 11.3 MB which is an extra item incurred in Q1/2021. 41Overseas Revenue and Gross Profit from Logistics Under JWD Operation
Revenue from Logistics Under JWD Operation Gross Profit from Logistics Under JWD Operation
Unit: THB Million Unit: THB Million
451.6
428.3
140.4
125.9
289.9
70.3
32.8% 28.9% 30.7%
119.9 27.9% 30.7%
24.3% GPM
93.8 92.3 36.8
27.2 28.4
Y2018 Y2019 Y2020 Q1/20 Q4/20 Q1/21 Y2018 Y2019 Y2020 Q1/20 Q4/20 Q1/21
• Overseas revenue and gross profit from logistic business under JWD operations were a contribution of financial performance from Bok Seng, JWD Asia, JWD Asia Logistics
(Cambodia), JWD Asia Logistics (Myanmar), Adib Cold Logistics (ACL), Samudera JWD Logistics (SJL), and Datasafe (Cambodia), which are all mainly operated by JWD
42Operating Expenses and Finance Costs
SG&A and Finance Cost SG&A Breakdown
Unit: THB Million Unit: THB Million
150.3 169.0 170.6
834.8 3% 3% 3% Selling expense
808.1 2% 2% 2%
7% 7% 7% Travelling
108.5 5% 6% 7% Depreciation
190.0 Consult
650.2 10%
17% 14% Others
Finance 82.2
Cost
73% Employee
699.6 66% 68%
643.9 217.4 217.9
568.0 201.5
SG&A
8.8
51.2 47.8 47.2
150.3 169.6 161.9 Q1/20 Q4/20 Q1/21
Y2018 Y2019 Y2020 Q1/20 Q4/20 Q1/21
Tax Expense
In Q1/2021, SG&A increase due to: 26.7
• Increasing in variable expenses associated with revenue and profit growth. The
company still maintained effective operating cost control with cost to total revenue 15.6 14.6 Extra items
ratio at 14.9%. 22,951
• The company had SG&A from extra items of Baht 8.8 million from loss from liquidation
15.6 4.1 Tax Expense
business in Laos and allowance for doubtful expense. 12.1
4.1
Tax expense higher due to:
Q1/20 Q4/20 Q1/21
• The company had deferred tax of Baht 14.6 million from extra items and allowance for
doubtful expense.
43Net Core Profit & Net Core Profit Margin
Net Core Profit & Net Core Profit Margin*
Unit: THB Million
12.3%
Net Core Profit
9.9% 9.7%
6.4% 362.8
7.4% 7.1% NPM YoY
+50.6%
290.0 QoQ
+85.8%
224.5
13.7 Net Core Profit
362.8 Margin
140.8
290.0
44.0
Extra items YoY
210.8 93.5
75.8
+2.6%
Net Core
93.5 96.8
75.8 Profit QoQ
+5.2%
Y2018 Y2019 Y2020 Q1/20 Q4/20 Q1/21
YoY
• The Company had net profit from extra items of Baht 44.0 million and net profit attributable to owners of the Company (before extra items) for
Q1/2021, of Baht 96.8 million, net profit margin (before extra items) was 8.4% which increased by Baht 3.3 million, or 3.5%
*Net Core Profit refers to Net Profit attribute to owners of the Company
44
**Net Core Profit Y2018 include Gain on sale of assets to trustStatement of Financial Position
Statement of Financial Position
Total Assets (Million Baht, %) Total Liabilities and Equity (Million Baht, %)
10,417.2
10,417.2 9,473.
9,473.7 7
2,537.7 24%
2,543.0 24% Current Liabilities
Current Assets 19% 1,782.8 25% 2,411.3
6% 573.0 562.1 5%
Investment properties
2,878.8 28% Long-Term Loans
23% 2,217.1
Property, Plant and 33% 3,130.9 3,332.7 32%
Equipment
17% 1,593.7 1,560.4 15% Other Non-Current Liabilities
Other Non Current 42% 3,987.0 3,979.4 39% 34% 3,251.6 3,440.3 33% Shareholder‘s Equity
Assets
31 Dec 20 31 Mar 21 31 Dec 20 31 Mar 21
Total Assets Total Liabilities
• Total Assets increased mainly due to the increase in Cash and cash • Total Liabilities increased mainly due to the increasing of debentures in Q1/2021
equivalents, current investments and property, plant and equipment.
Total Equity
• Total Equity increased mainly due to the recognition of retained earnings and
non-controlling interests.
45Key Financial Ratio
Interest Bearing Debt to Equity (Times) Debt to Equity Ratio (Times) Net Debt to EBITDA (Times)
2.00x 4.66x
1.64x 1.75x 1.91x 4.32x
4.31x
0.44x
0.47x 0.51x 1.23x
0.51x 1.39x 1.44x
1.10x
1.56x 4.31x
1.28x 1.40x
1.10x 1.13x 1.39x 3.22x 3.09x
Y2019 Y2020 Q1/21 Y2019 Y2020 Q1/21 Y2019 Y2020 Q1/21
Debt portion from TFRS16
Ratios excluded TFRS16
46Cash Flow Statement
Cash Flow Statement (2021)
Unit: THB Million
+628.8 -3.9 1,308.1
+366.5.0 -498.3
+493.1
Net Increase / (Decrease) in Cash
815.0 and Cash Equivalents
Cash and
Cash at 1 Cash
January Cash flowActivities
Operating from Cash flowActivities
Investing from Cash flowActivities
Financing from Impact from
Impact of foreign
foreign CashCash
at 31and Cash
December
Equivalents at Operating Investing Financing exchange rates
exchange Equivalents at
January 1, 2021 Activities Activities Activities March 31, 2021
• Cash Flow from Operating Activities as at March 31, 2021 was THB 366.5 million increased by Baht 152.8 million due to theresult of better business performance as well as the
cash received from changes in trade and other payable.
• Cash Flow from Investing Activities as at March 31, 2021 was THB (498.3) million increased by Baht 361.0 million from previous year due tocash used in investments in
property, plant and equipment and purchase of current investments.
• Cash Flow from Financing Activities as at March 31,2021 was THB 628.8 million increased by Baht 1,052.3 million due tothe cash received from the issuance of debentures and
the repayment of bank overdrafts and short-term borrowings from financial institutions.
47Q&A
48Disclaimer
The information contained in this presentation is strictly confidential and is prepared and provided by JWD InfoLogistics PCL (the “Company” or “JWD”) to you solely for your
reference. By viewing all or part of this presentation, you are agreeing to maintain absolute confidentiality regarding the information disclosed in this presentation. By
attending this presentation, you are agreeing to be bound by the restrictions setout below. Any failure to comply with these restrictions may constitute a violation of
applicable securities laws. Neither this presentation nor any part thereof may be (i) used or relied upon by any other party or for any other purpose; (ii) copied, photocopied,
duplicated or otherwise reproduced in any form or by any means; or (iii) redistributed, passed on or otherwise disseminated, to any other person either in your organization or
elsewhere. By attending this presentation, participants agree not to remove this document, or any materials provided in connection herewith, from the conference room where
such documents are provided without express consent from the Company and its respective affiliates or advisors.
Although care has been taken to ensure that the information in this presentation is accurate, and that the opinions expressed are fair and reasonable, the information is
subject to change without notice, its accuracy is not guaranteed, has not been independently verified and it may not contain all material information concerning the Company
and its subsidiaries. None of the Company nor any of its respective affiliates or advisors nor any of its or their respective members, directors, officers, employees or affiliates
make any representation or warranty (express or implied) regarding, nor assumes any responsibility or liability for, the accuracy or completeness of, or any errors or omissions
in, any information contained herein. Accordingly, none of the above nor any other person accepts any liability (in negligence, or otherwise) for any loss arising from or in
connection with any use of this presentation or its contents.
In addition, this presentation contains financial information and result of operation, and may contain certain projections, plans, strategies, and objectives of the Company, that
are not statements of historical fact which would be treated as forward looking statements that reflect the Company’s current views with respect to future events and financial
performance. These views are based on a number of estimates and current assumptions which are subject to business, economic and competitive uncertainties and
contingencies as well as various risks and these may change over time and in many cases are outside the control of the Company and its directors. You are cautioned not to
place undue reliance on these forward looking statements, which are based on the current view of the management of the Company on future events. No assurance can be
given that future events will occur, that projections will be achieved, or that the Company's assumptions are correct. Such forward-looking statements are not guarantees of
future performance and accordingly, the actual results, financial condition, performance or achievements of the Company may differ materially from those anticipated by the
Company in the forward looking statements.
In providing this document, the Company does not undertake to provide you with access to any additional information or to update the information contained in the document
or to correct any inaccuracies therein which may become apparent.
49You can also read