SUPPLEMENTING EMERGENCY WARNING MESSAGES TO ENCOURAGE READINESS TO ACT: THE EFFECT OF COLOUR AND ICONS - A/Prof Dominique A. Greer, Dr Paula ...
←
→
Page content transcription
If your browser does not render page correctly, please read the page content below

SUPPLEMENTING EMERGENCY
WARNING MESSAGES TO
ENCOURAGE READINESS TO ACT:
THE EFFECT OF COLOUR AND ICONS
A/Prof Dominique A. Greer, Dr Paula Dootson, Dr Sophie A. Miller
and Prof. Vivienne Tippett

Queensland University of Technology
SUPPLEMENTING EMERGENCY WARNING MESSAGES TO ENCOURAGE READINESS TO ACT: THE EFFECT OF COLOUR AND ICONS | REPORT NO. 640.2021

  Version        Release history                                      Date

  1.0            Initial release of document                          12/01/2021

 © 2021 Bushfire and Natural Hazards CRC

 All material in this document, except as identified below, is licensed under the
 Creative Commons Attribution-Non-Commercial 4.0 International Licence.

 Material not licensed under the Creative Commons licence:
       •     Department of Industry, Science, Energy and Resources logo
       •     Cooperative Research Centres Program logo
       •     Bushfire and Natural Hazards CRC logo
       •     Any other logos
       •     All photographs, graphics and figures

 All content not licenced under the Creative Commons licence is all rights
 reserved. Permission must be sought from the copyright owner to use this
 material.

 Disclaimer:
 QUT and the Bushfire and Natural Hazards CRC advise that the information
 contained in this publication comprises general statements based on scientific
 research. The reader is advised and needs to be aware that such information may
 be incomplete or unable to be used in any specific situation. No reliance or
 actions must therefore be made on that information without seeking prior expert
 professional, scientific and technical advice. To the extent permitted by law, QUT
 and the Bushfire and Natural Hazards CRC (including its employees and
 consultants) exclude all liability to any person for any consequences, including but
 not limited to all losses, damages, costs, expenses and any other compensation,
 arising directly or indirectly from using this publication (in part or in whole) and any
 information or material contained in it.

 Publisher:
 Bushfire and Natural Hazards CRC

 January 2021

 Citation: Greer D, Dootson P, Miller S & Tippet V (2021) Supplementing emergency
 warning messages to encourage readiness to act: the effect of colours and icons,
 Bushfire and Natural Hazards CRC, Melbourne.

                                                                             1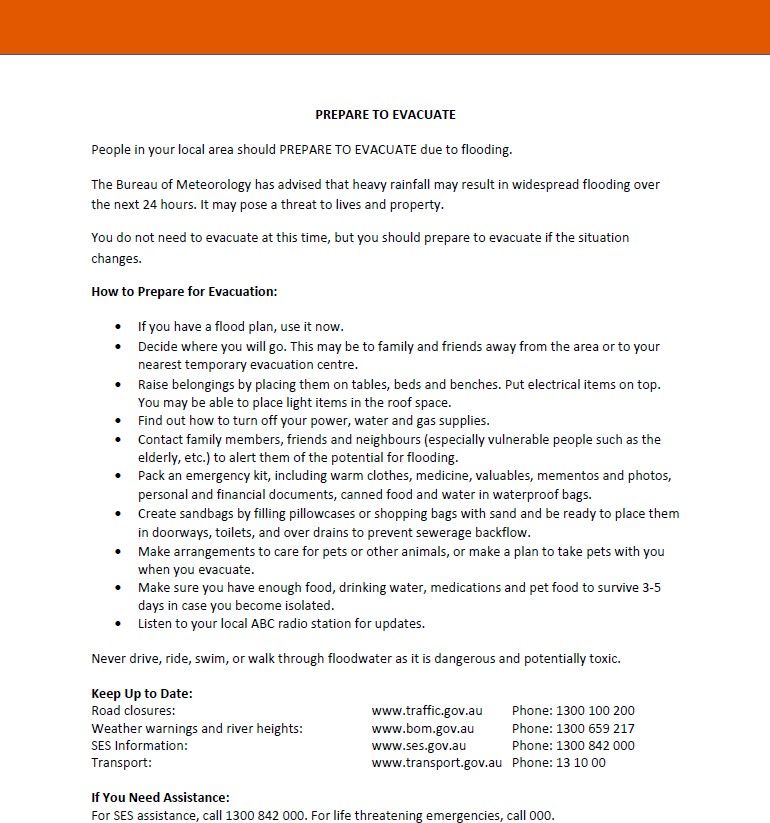
SUPPLEMENTING EMERGENCY WARNING MESSAGES TO ENCOURAGE READINESS TO ACT: THE EFFECT OF COLOUR AND ICONS | REPORT NO. 640.2021

TABLE OF CONTENTS
TABLE OF CONTENTS .................................................................................................................... 2

LIST OF TABLES .............................................................................................................................. 4

LIST OF FIGURES ............................................................................................................................ 5

ABSTRACT ..................................................................................................................................... 6

END-USER STATEMENTS ................................................................................................................ 7

INTRODUCTION ............................................................................................................................ 8

RESEARCH BACKGROUND .......................................................................................................... 9

The role of colour ........................................................................................................................................ 9

The role of icons ........................................................................................................................................ 10

Investigating the impact of colour and icons on emergency warning messages ............................ 11

RESEARCH METHOD ................................................................................................................... 14

Survey procedure ..................................................................................................................................... 14

Measures ................................................................................................................................................... 15

FINDINGS .................................................................................................................................... 19

Sample characteristics............................................................................................................................. 19

Message comprehension and effectiveness ........................................................................................ 23

Threat appraisal ........................................................................................................................................ 25

Coping appraisal ...................................................................................................................................... 29

SUMMARY OF FINDINGS............................................................................................................ 32

NEXT STEPS .................................................................................................................................. 33

REFERENCES ................................................................................................................................ 34

APPENDIX A: EMERGENCY WARNING STIMULI (BUSHFIRE)..................................................... 37
BUSHFIRE SET 1: GREYSCALE; NO ICON .................................................................................................................................................. 37

BUSHFIRE SET 1: GREYSCALE AND ICON ................................................................................................................................................. 38

BUSHFIRE SET 1: COLOUR; NO ICON ....................................................................................................................................................... 39

BUSHFIRE SET 1: COLOUR AND ICON ...................................................................................................................................................... 40

BUSHFIRE SET 2: GREYSCALE; NO ICON .................................................................................................................................................. 41

BUSHFIRE SET 2: GREYSCALE AND ICON ................................................................................................................................................. 42

BUSHFIRE SET 2: COLOUR; NO ICON ....................................................................................................................................................... 43

BUSHFIRE SET 2: COLOUR AND ICON ...................................................................................................................................................... 44

                                                                                           2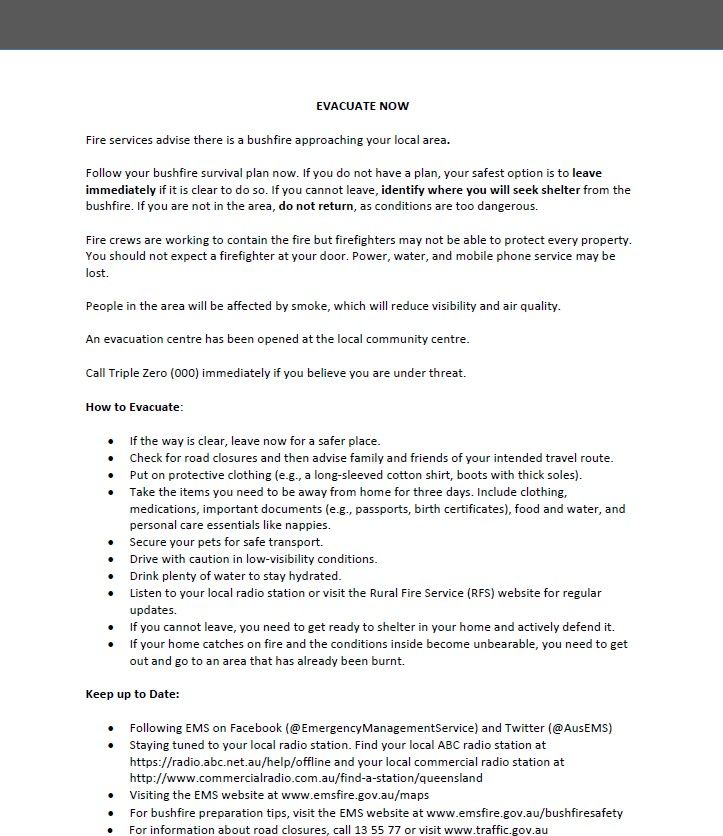
SUPPLEMENTING EMERGENCY WARNING MESSAGES TO ENCOURAGE READINESS TO ACT: THE EFFECT OF COLOUR AND ICONS | REPORT NO. 640.2021

APPENDIX B: EMERGENCY WARNING STIMULI (FLOOD)......................................................... 45
FLOOD SET 1:   GREYSCALE; NO ICON...................................................................................................................................................... 45

FLOOD SET 1:   GREYSCALE AND ICON .................................................................................................................................................... 46

FLOOD SET 1:   COLOUR; NO ICON ........................................................................................................................................................... 47

FLOOD SET 1:   COLOUR AND ICON .......................................................................................................................................................... 48

FLOOD SET 2:   GREYSCALE; NO ICON...................................................................................................................................................... 49

FLOOD SET 2:   GREYSCALE AND ICON .................................................................................................................................................... 50

FLOOD SET 2:   COLOUR; NO ICON ........................................................................................................................................................... 51

FLOOD SET 2:   COLOUR AND ICON ......................................................................................................................................................... 52

                                                                                         3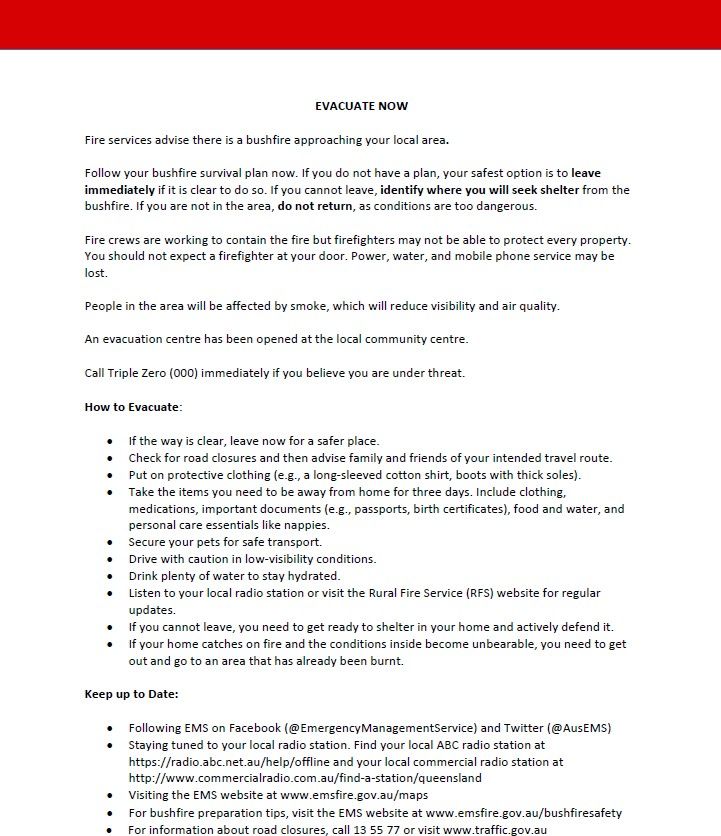
SUPPLEMENTING EMERGENCY WARNING MESSAGES TO ENCOURAGE READINESS TO ACT: THE EFFECT OF COLOUR AND ICONS | REPORT NO. 640.2021

LIST OF TABLES
Table 1: Sociodemographic Characteristics of Participants in the Australian Population (2016) and
the Research Sample (2019) ................................................................................................................... 19

Table 2: Peak Education Attainment of Participants ............................................................................ 20

Table 3: Self-Reported Level of Insurance by Asset ............................................................................... 21

Table 4: Level of Emergency Service Agency Involvement ................................................................. 21

Table 5: Threat Experience Appraisal for Fire and Flood ...................................................................... 21

Table 6: Descriptive Statistics for Perceived Threat Appraisal .............................................................. 25

                                                                       4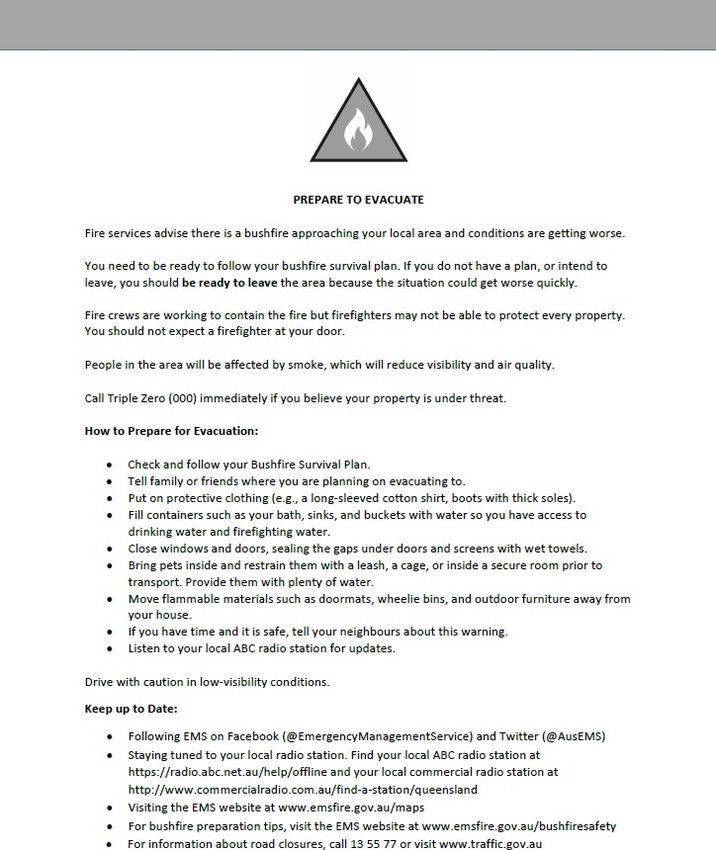
SUPPLEMENTING EMERGENCY WARNING MESSAGES TO ENCOURAGE READINESS TO ACT: THE EFFECT OF COLOUR AND ICONS | REPORT NO. 640.2021

LIST OF FIGURES

Figure 1: Precautionary Adaption Model Based on Protection Motivation Theory............................ 12

Figure 2: Typical Sources of Information about Fires and Floods (by Number of Participants) ......... 22

Figure 3: Typical Platforms Used to Seek Information about Fires and Floods (by Number of
Participants) .............................................................................................................................................. 22

                                                                              5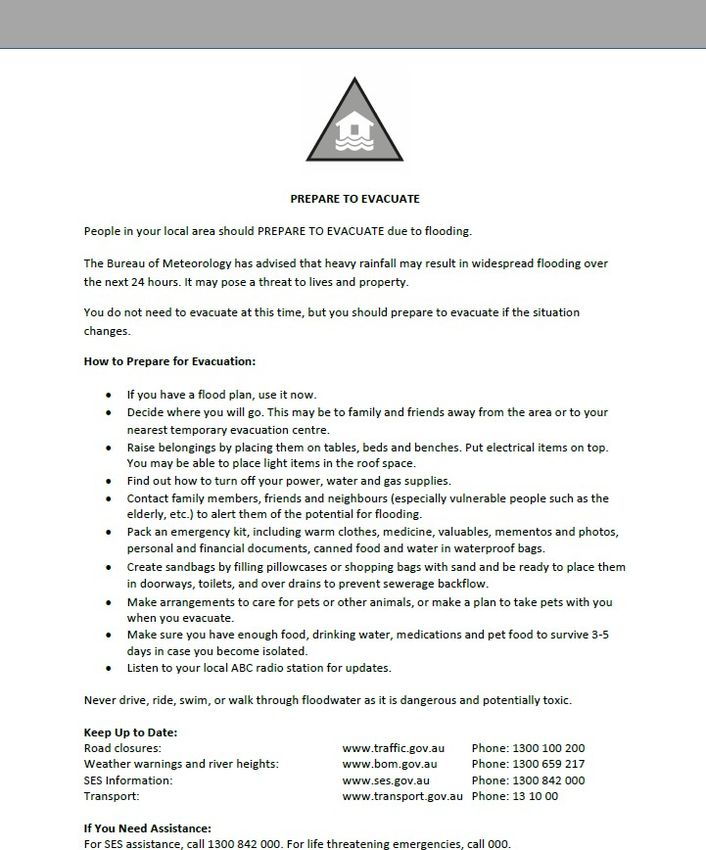
SUPPLEMENTING EMERGENCY WARNING MESSAGES TO ENCOURAGE READINESS TO ACT: THE EFFECT OF COLOUR AND ICONS | REPORT NO. 640.2021

ABSTRACT
Current Australian emergency warning messages that have been refined to
match evidence-based practice strongly encourage community members’
readiness to act on emergency instructions (Greer, Dootson, Miller & Tippett,
2019). Given the written elements of warning messages are optimised to
encourage readiness to act, this research examines the effect of adding icons
and/or colours to official warnings. In this research, we draw on a socio-
psychological model of precautionary adaption (Grothmann & Reusswig, 2006)
underpinned by Protective Motivation Theory (PMT; Rogers, 1975, 1983; Rogers &
Prentice-Dunn, 1997) to investigate whether emergency warning messages can
be further optimised by adding colours and/or icons to encourage even higher
levels of readiness to act on emergency instructions.
In order to achieve the aims of this research, an online survey was conducted in
which participants were exposed to one of 16 mock emergency warnings about
either a bushfire or a riverine flood and were then asked a series of questions
relating to their demographic characteristics, message comprehension and
effectiveness, threat appraisal, coping appraisal, protection motivation and
maladaptive coping behaviour. Mock emergency warnings were developed
using existing end-user emergency warnings to improve realism and maximise
the usefulness of the findings, as well as building on previous QUT-conducted
BNHCRC research (see Greer et al., 2019). A total of 2,482 Australians living across
all states and territories were recruited to participate in the research. Participants
were recruited by the Market Research firm Dynata. Approximately 150
participants responded to each of the 16 stimuli.
Overall, the research results show that adding colours and/or icons to the
Evacuate Now (Bushfire) message creates improvements, albeit small ones, in
message comprehension, effectiveness, perceived probability and perceived
self-efficacy. The other three messages showed no improvement (or loss) in
message comprehension, effectiveness, threat appraisal, or coping appraisal as
a result of adding colours and/or icons.

                                                            6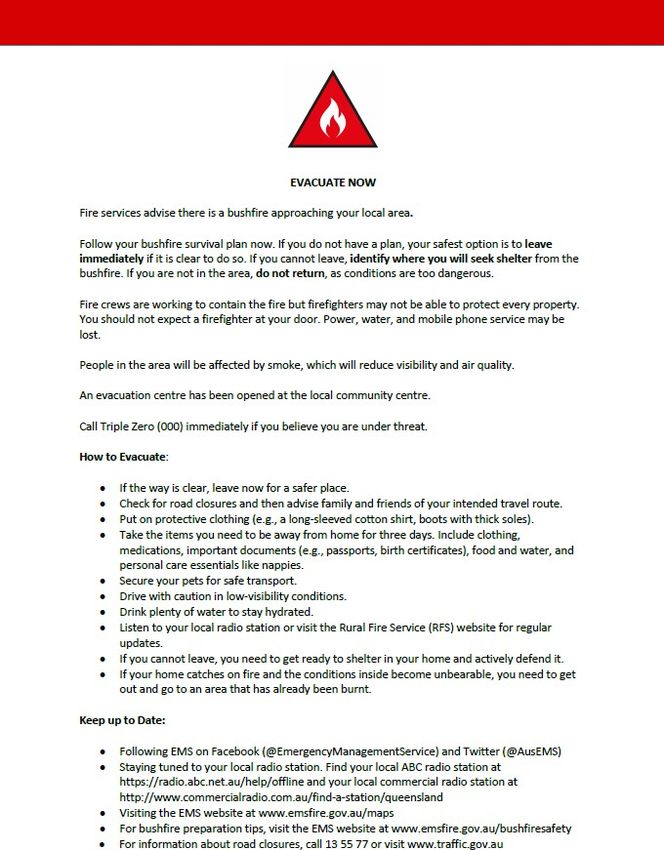
SUPPLEMENTING EMERGENCY WARNING MESSAGES TO ENCOURAGE READINESS TO ACT: THE EFFECT OF COLOUR AND ICONS | REPORT NO. 640.2021

END-USER STATEMENT
Hayley Gillespie (Executive Manager, Media), Queensland Fire and Emergency
Services
As QFES implements evidence-based emergency warning message design, it is
important to understand how community members perceive and respond to
updated warning messages. This research by Greer, Dootson, Miller and Tippett
provides several findings that affirm our current practice and provide some
direction for the future. Firstly, it is useful to know that warning messages similar to
ours are perceived to be highly comprehensible and effective. We will continue
to include instructions to the community that they perceive to be easily
undertaken, protective, and low in cost (i.e., time, money and effort). Secondly,
it is valuable to understand the impact of warning colours and icons on how
community members interpret warning messages. Looking ahead to the next
bushfire season, QFES will draw on this research and use colour more prominently
to enforce warning levels and severity. Our messages will continue to be
reviewed in light of these findings to continue encouraging protective action in
the community.

                                                            7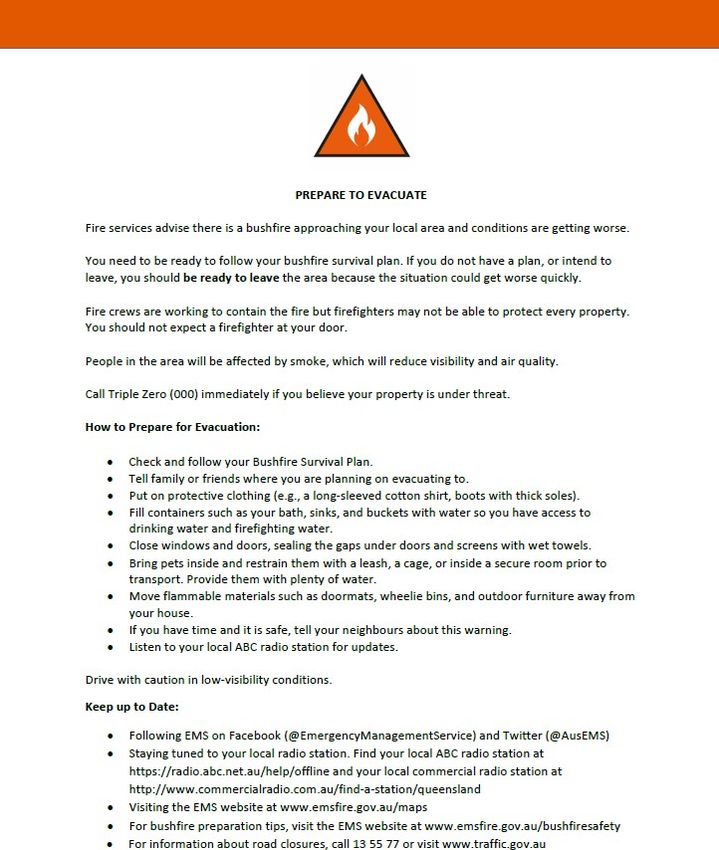
SUPPLEMENTING EMERGENCY WARNING MESSAGES TO ENCOURAGE READINESS TO ACT: THE EFFECT OF COLOUR AND ICONS | REPORT NO. 640.2021

INTRODUCTION
Since the release of the National Review of Warnings and Information
(Emergency Management Victoria, 2014), emergency service agencies across
Australia have adopted a range of evidence-based practice when constructing
emergency warning messages. After five years of development, research shows
that current emergency warning messages that have been refined to match
evidence-based practice do encourage community members’ readiness to act
on emergency instructions (Greer et al., 2019). As the written elements of warning
messages are unlikely to be able to be further optimised to encourage readiness
to act, this research examines the effect of adding icons and/or colours to official
warning messages. This research complements the increasing industry interest in
developing a National Multi-Hazard Warning System that can promote clear
understanding of warnings and appropriate protective action across Australian
jurisdictions (Metrix, 2019).
In this research, we aim to investigate whether adding colours and/or icons to
optimised emergency warning messages further encourages community
members’ readiness to act on emergency instructions. Both colour and icons are
perceptual elements that can be added to warning messages to increase the
salience of a warning (Wogalter, Conzola & Smith-Jackson, 2002; Wogalter et al.,
1987; Wogalter, Mayhorn & Zielinska, 2015; Wogalter, Conzola & Vigilante, 2006).
Such design elements are intended to increase community safety by increasing
rapid recognition of the hazard warning (Wogalter et al., 2015; Wogalter et al.,
2006) and encouraging appropriate protective actions to be taken (Braun &
Silver, 1995). Thus, it is important to investigate whether the addition of colour
and/or icons changes how emergency warning messages are interpreted.
To execute this research, we draw on a socio-psychological model of
precautionary adaption developed by Grothmann and Reusswig (2006). This
model uses Protective Motivation Theory (PMT; Rogers, 1975, 1983; Rogers &
Prentice-Dunn, 1997) as a foundation to understand the extent to which
emergency warning messages with added colour and/or icons encourage
community members’ readiness to act on emergency instructions.
The overarching research question guiding this research package is: Can
emergency warning messages be further optimized with colours and/or icons to
encourage higher levels of readiness to act on emergency instructions? The
research required to address this question will be executed across four phases:
Prove: First, we measure the extent to which current emergency warning
messages encourage readiness to act on emergency instructions.
Assess: Second, we develop and test optimised emergency warning messages
that encourage higher levels of readiness to act on emergency instructions.
Utilise: Third, we engage with end-users to translate the findings in order to
improve readiness to act in accordance with emergency instructions.
Evaluate: Finally, we will assist end-users to develop evaluation strategies for their
changes (if any) to emergency warning communications.
This report provides insight into the second phase of the research, Assess.

                                                            8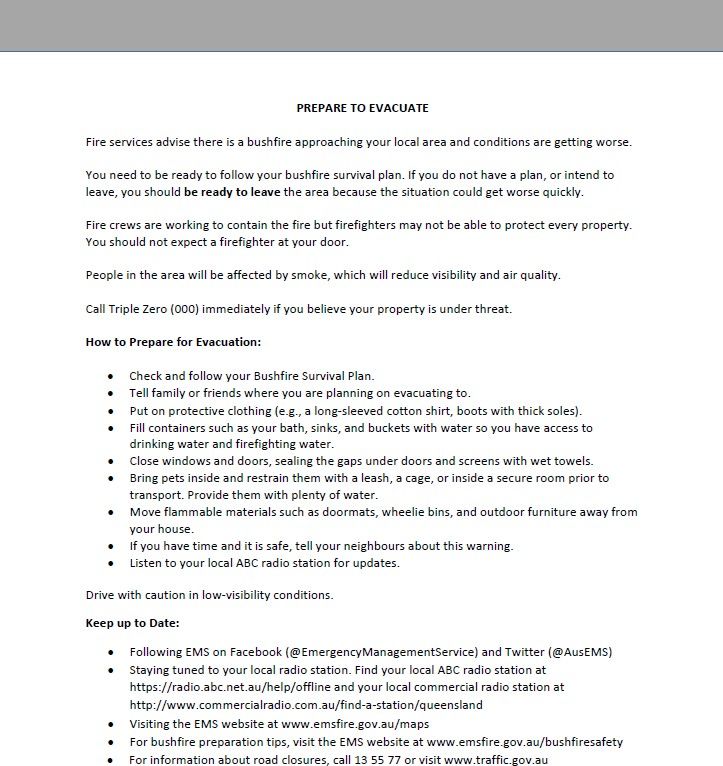
SUPPLEMENTING EMERGENCY WARNING MESSAGES TO ENCOURAGE READINESS TO ACT: THE EFFECT OF COLOUR AND ICONS | REPORT NO. 640.2021

RESEARCH BACKGROUND
Emergency warnings are issued to inform community members about potential
hazards and suggest appropriate protective actions that support their safety and
well-being (Wogalter et al., 2015). Warnings also aim to capture attention, aid
understanding, and communicate risk (Wogalter et al., 1987; Wogalter et al.,
2015; Wogalter et al., 2006). Both national and international bodies (e.g., the
International Organization for Standardization; ISO) have developed generic
warning design guidelines that incorporate elements such as colour (e.g., red,
orange), icons (e.g., pictures), and signal words (e.g., ‘WARNING’) to increase
the salience of a warning (Wogalter et al., 2002; Wogalter et al., 1987; Wogalter
et al., 2015; Wogalter et al., 2006). These design elements are intended to
improve community safety through rapid recognition of the hazard warning
(Wogalter et al., 2015; Wogalter et al., 2006) and encourage appropriate
protective actions to be taken (Braun & Silver, 1995). This study examines the
impact of adding colours and/or icons to warning messages for natural hazards
as these design elements are (i) ubiquitous in society, (ii) powerful ways to
communicate and aid the interpretation of warning information, and (iii) may be
proposed as part of a national multi-hazard warning system in Australia (Danesi,
2007; Elliot & Maier, 2012; Metrix, 2019; Wogalter et al., 2015).

THE ROLE OF COLOUR
Although colour is ubiquitous in our human environment, there is limited research
on how colour affects human cognition, affect, and behaviour (Elliot & Maier,
2007, 2012). To address this gap, Elliot and Maier (2012) developed Color-in-
context Theory to explain the relationships that exist between colour perception
and behaviour (e.g., approach or avoidance), cognition (e.g., perceptions,
mental processes) and affect (e.g., emotions). There are six core guiding
principles of Colour-in-context Theory:

          (i)       colour carries meaning, because it is ‘nonlexical visual stimulus that
                    can symbolically convey various types of information’ (p. 67);
          (ii)      seeing colour impacts on psychological functions in a way that is
                    ‘consistent with the meaning of the color’ (p. 67);
          (iii)     colour effects are automatically processed, such that colour
                    affects psychological functioning without the explicit awareness of
                    the perceiver;
          (iv)      colour meanings (and subsequent responses) are both socially
                    learnt (e.g., pink is feminine) and biologically based (i.e., red fruit is
                    ripe);
          (v)       associations between colour and behaviour, cognition and affect
                    are reciprocal (i.e., visual perception is influenced by the
                    psychological state of the perceiver); and
          (vi)      the meanings and effects associated with colour are context
                    specific, such that ‘color carries different meaning in different
                    contexts and, therefore, has different implications for feelings,
                    thoughts and actions in different contexts’ (Elliot & Maier, 2012).

                                                            9
SUPPLEMENTING EMERGENCY WARNING MESSAGES TO ENCOURAGE READINESS TO ACT: THE EFFECT OF COLOUR AND ICONS | REPORT NO. 640.2021
Empirical support for the theory has been demonstrated in a variety of contexts
and domains, such as competitive sport performance (Hill & Barton, 2005), video
gaming (Ilie et al., 2008), and motor performance (Elliot et al., 2007).
Color-in-context Theory is particularly useful to explain how colours, particularly
red, serve as environmental cues that assist us to perceive, interpret and respond
to stimuli. Traffic lights with their ‘green = go’ and ‘red = stop’ behavioural
associations provide an example of common learned colour cues (Garrido,
Prada, Simao & Semin, 2019). The colour red is also associated with
aggression/dominance in animals that is likely to be an innate response (Pryke,
2009). Additional research suggests the red-danger association observed in
humans is implicit in nature (Pravossoudovitvh, Cury, Young & Elliot, 2014). Across
multiple studies, many red-danger pairings obtained the highest hazard risk
ratings (e.g., Braun & Silver, 1995; Chapanis, 1994; Ng & Chan, 2018), followed by
orange (e.g., Braun & Silver, 1995; Chapanis, 1994). Further, Kline, Braun, Peterson
and Silver (1993) demonstrated that participants rated perceived hazardousness
and readability of warning labels higher when they were presented in chromatic
colour (e.g., red, green, blue) compared to achromatic colour (e.g., black, grey,
white). To understand the effects of colour further, the context colour is
perceived in is an important factor to consider. Specifically, research
demonstrates that the colour red elicits both approach and avoidance
behaviours in romance and achievement contexts respectively (Meier,
D’Agostino, Elliot, Maier & Wilkowski, 2012). In romantic contexts, red is
considered attractive and encourages the viewer to approach, whereas in
achievement contexts, red is considered threatening and is something to be
avoided. It is thus pertinent to assess the effects of colour in the context of the
multi-hazard warning messages.
THE ROLE OF ICONS
The study of signs is known as semiotics. Peirce, a founder of semiotics, proposed
that a sign is ‘something that stands to somebody for something in some respect
or capacity’ (1932, p. 135). According to Peirce, the three interactive factors that
comprise a sign are (i) the Representamen (i.e., the representation), (ii) the sign’s
Object (i.e., the represented object), and (iii) the Interpretant (i.e., the mental
interpretation process).
Peirce (1932) identified three types of signs: icons, which include pictures,
diagrams, and ideographs; indexes, which are figures such as arrows on a map
or time units such as hours or days; and symbols, such as the cross figure that
represents Christianity. Of particular interest to this research is icons, as they
resemble an object’s qualities. Iconicity has roots in early human systems and
cultures through prehistoric inscriptions, cave drawings and pictographic signs,
such as the hieroglyphs in ancient Egypt and cuneiform in ancient Mesopotamia
(Danesi, 2007). Iconicity is also evident in early childhood ‘scribble’ drawings and
extends through to pictures denoting male and female toilets, road signs and
chemical label warnings (Danesi, 2007). Icon developers need to carefully
consider their end-users as cultural contexts (among other factors like knowledge
10SUPPLEMENTING EMERGENCY WARNING MESSAGES TO ENCOURAGE READINESS TO ACT: THE EFFECT OF COLOUR AND ICONS | REPORT NO. 640.2021
and familiarity with the icon) will likely influence the interpretation of the icon
(Chan & Courtney, 2001; Danesi, 2007; Jacobs et al., 1991; Kitao & Kitao, 1986).
The power of icons has been recognised as an important visual element in
communication. Icons can be used to clarify, illustrate and supplement written
information (Rodriguez Estrada & Davis, 2015; Trumbo, 1999). What is less clear,
however, are the behaviours, cognitive performance and/or affect associated
with the icons in the context of natural hazards (Rodriguez Estrada & Davis, 2015).
The uncertainty of natural hazards provides further challenges to using icons.
Information pertaining to a hazard and its anticipated impact needs to be
communicated via warnings whether or not (i) the hazard is currently occurring
in the immediate area and (ii) environmental cues are absent (i.e., blue sky
flooding; Anderson-Berry et al., 2018). Given that icons can enhance
communication, it is important to assess the utility of icons in the context of
natural hazard warnings.
INVESTIGATING THE IMPACT OF COLOUR AND ICONS ON EMERGENCY
WARNING MESSAGES
Given that colour and icons are added to improve the protective impact of
emergency warnings, this research uses Protection Motivation Theory (PMT;
Rogers, 1975, 1983; Prentice-Dunn & Rogers, 1986) as a guiding theoretical
framework. PMT is an educational and motivational model that has been
adapted to understand self-protection intentions and behaviours across a range
of contexts, including natural hazards (Floyd, Prentice-Dunn & Rogers, 2000;
Maddux & Rogers, 1983; Milne, Sheeran & Orbell, 2000). PMT proposes that
individuals engage in protective behaviour in accordance with (i) the perceived
severity of the threat, (ii) the perceived probability the threat will occur (i.e., their
vulnerability), (iii) the perceived efficacy of the protective behaviour, and (iv)
their perceived self-efficacy to engage in the behaviour (Rogers, 1975). Thus,
protection motivation stems from both a threat appraisal and a coping
appraisal. Further details of this theoretical approach are reported in previous
research by Greer and colleagues (2019).
Grothmann and Reusswig’s (2006) Precautionary Adaptation Model is based on
the Protective Motivation Theory and was developed to describe why protective
action is enacted by some and not others from a socio-psychological
perspective (see Figure 1). The non-protective (or maladaptive) responses
outlined in the Precautionary Adaptation Model include fatalism, denial of threat
and wishful thinking. These three maladaptive responses aim to protect
individuals from the negative emotional consequences of a difficult situation
such as a natural hazard (Grothmann & Reusswig, 2006).
11SUPPLEMENTING EMERGENCY WARNING MESSAGES TO ENCOURAGE READINESS TO ACT: THE EFFECT OF COLOUR AND ICONS | REPORT NO. 640.2021
FIGURE 1: PRECAUTIONARY ADAPTION MODEL BASED ON PROTECTION MOTIVATION THEORY
Source: Reproduced from Grothmann & Reusswig (2006)
In order to investigate whether the addition of colour and/or icons altered
message impact, the following constructs were examined (reproduced from
Greer et al., 2019):
Threat appraisal was determined using two dimensions of risk judgment: the
vulnerability/probability and severity of an event occurring (adapted from Yang,
2012). According to Martin and colleagues (2007) one’s perception of risk
vulnerability/probability is the likelihood of harm experienced to one’s person or
property provided no behavioural change is adopted. Perception of risk severity
was also defined by Martin and colleagues (2007) as the level of adversity that
would result from experiencing the perceived risk.
Affective responses (i.e., the emotional response to an event) have been shown
to influence both heuristic and systematic processing to risk. Not only can
negative and positive emotions influence the level of attention given to risk
information, like emergency warning messages, but affective responses can also
impact the way ambiguous events like hazards are interpreted (Griffin, Neuwirth,
Dunwoody & Giese, 2004). Fear was thus determined by assessing the level of
fear, anxiety and worry warning messages generate.
Perceived self-efficacy is defined as one’s belief regarding their capability of
performing or not performing suggested protective actions (Martin et al., 2007).
An individual’s level of self-efficacy (e.g., high versus low) is an important
predictor of behavioural outcomes (Ajzen, 1991; Bandura 1986, 2000). Similarly,
the extent to which people believe specific recommended protective actions
will alleviate or deter a threat is known as protective response efficacy (adapted
from Martin et al., 2007). Response costs (adapted from Neuwirth, Dunwoody &
Griffin, 2000) are the costs incurred due to the potential course of action.
12SUPPLEMENTING EMERGENCY WARNING MESSAGES TO ENCOURAGE READINESS TO ACT: THE EFFECT OF COLOUR AND ICONS | REPORT NO. 640.2021
Two additional constructs were investigated in this research:
Perceived comprehension captures an individual’s ability to understand the
message. Individual’s will likely retain the message if they have a clear
understanding of the messages’ claims (Smith, Chen & Yang, 2008). Eliminating
ambiguity from a message is likely to result in successful perceived message
comprehension (Peracchio & Meyers-Levy, 1994; Smith et al., 2008).
Individual attitudes towards public messages have been assessed using
constructs like credibility, likeability and persuasiveness. These types of measures
can be categorised under the larger conceptual framework of perceived
effectiveness (Davis, Duke, Shafer, Patel, Rodes & Beistle, 2017). Perceived
effectiveness has an intuitive meaning as it captures whether or not individuals
perceive a message as effective and worth remembering (Dillard, Shen & Vail,
2007).
Overall, understanding how to design emergency warning messages to
encourage readiness to act is important to aid successful decision making in a
complex environment, such as during a natural hazard, and may help reduce
the need for emergency services during hazard events.
13SUPPLEMENTING EMERGENCY WARNING MESSAGES TO ENCOURAGE READINESS TO ACT: THE EFFECT OF COLOUR AND ICONS | REPORT NO. 640.2021
RESEARCH METHOD
The aim of this research was to examine whether current emergency warning
messages can be further optimised with colours and/or icons to encourage
community members’ readiness to act on emergency instructions. To achieve
this aim, a survey was conducted in which participants were exposed to one of
16 mock emergency warnings about either a bushfire or a riverine flood and
were then asked a series of questions relating to their protective motivations.
Mock emergency warnings not attributed to any particular agency were
developed in previous research by Greer and colleagues (2019) based on
existing end-user emergency warnings provided by CFS (SA), DFES (WA), MFB
(VIC), MFS (SA), NSW SES, TAS SES, VIC SES and QFES. This study further developed
those mock emergency warning messages to improve study realism and
maximise the usefulness of the findings.
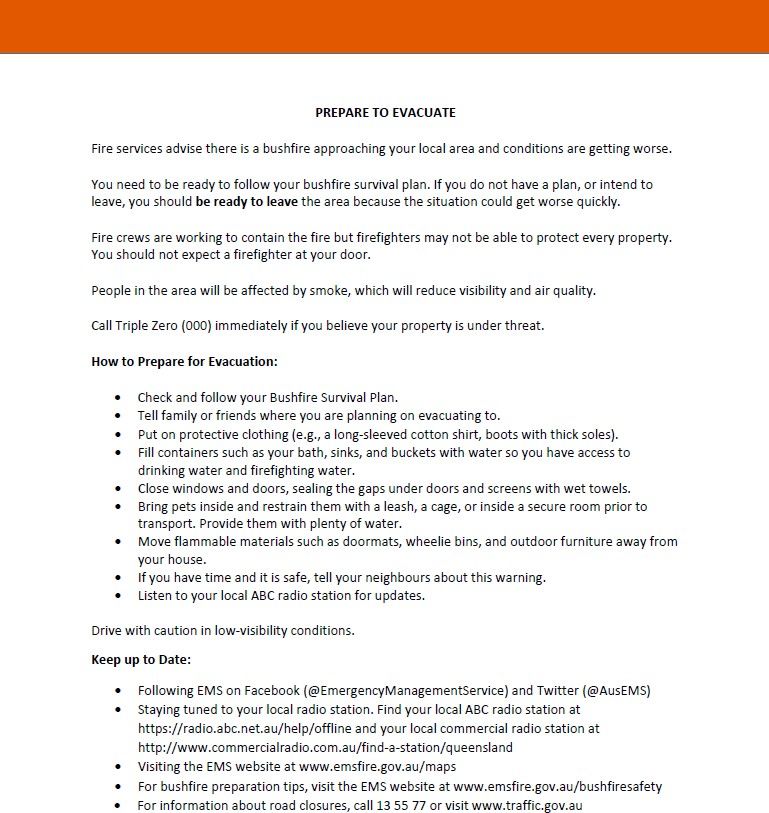
The 16 mock emergency warnings comprised a Prepare to Evacuate (Bushfire)
message, a Prepare to Evacuate (Flood) message, an Evacuate Now (Bushfire)
message, and an Evacuate Now (Flood) message that contained different
combinations of a header strip and an icon in colour or greyscale. More
specifically, messages contained either a grey header strip only, a coloured
header strip only, a grey header strip and hazard icon, or a coloured header strip
and hazard icon. The Prepare to Evacuate messages contained orange header
strips and icons, while the Evacuate Now messages contained red header strips
and icons. The icons, which depicted a flame or flooded house, were developed
for this research. The 16 stimuli are presented in Appendix A and B.
A total of 2,482 Australians living across all states and territories were recruited to
participate in the research. Participants were recruited by the Market Research
firm Dynata and had not previously participated in the Greer et al. (2019) study.
Approximately 150 participants responded to each of the 16 stimuli.
This research was conducted by QUT researchers in adherence with QUT ethics
and integrity principles. Ethics clearance involved the review of the research, its
value, the capabilities of the research team, and the risks and benefits to the
participants involved. All participants were asked to consent to the research. The
QUT ethics approval number for this research project is 1800000371.
SURVEY PROCEDURE
After consenting to participate in the survey, two screening questions (i.e., Do
you have any visual impairment(s) that make it hard for you to detect different
colours? and Given your current living location and circumstances, are you more
likely to be exposed to a bushfire or a flood?) were used to allocate participants
to one of the 16 stimuli. Only a small number of participants (4.6%) reported that
they had one or several visual impairment(s) that made it hard to detect different
colours. These participants were allocated to a random greyscale message to
control the effects of misperceiving colour.
When reporting on their likelihood of exposure to natural hazards, 335 (13.5%)
reported that they were more likely to be exposed to a flood, 823 (33.2%)
reported that they were more likely to be exposed to a bushfire, 208 (8.4%)
reported that they were equally likely to be exposed to a flood or a bushfire, and
1116 (45.0%) reported that they were not likely to be exposed to either hazard. If
14SUPPLEMENTING EMERGENCY WARNING MESSAGES TO ENCOURAGE READINESS TO ACT: THE EFFECT OF COLOUR AND ICONS | REPORT NO. 640.2021
participants indicated they were more likely to be exposed to a bushfire, they
were randomly allocated to either a Prepare to Evacuate (Bushfire) or Evacuate
Now (Bushfire) message. Similarly, if participants responded that they were more
likely to be exposed to a flood, they were randomly allocated to either the
Prepare to Evacuate (Flood) or Evacuate Now (Flood) message condition.
Participants who indicated that they were likely to be exposed to both a bushfire
and a flood, or neither a bushfire or flood, were randomly allocated to one of
the 16 stimuli. This partially random stimuli allocation strategy was designed to
maximise the relevance of the stimuli while minimising self-selection bias.
The first section of the survey collected demographic information including
gender, age, highest level of education, primary language spoken at home,
postcode, country of birth, level of insurance for a range of assets, involvement
with emergency services (either as an employee or volunteer), visual
impairment(s), and past experience with both natural hazards. The second
section of the survey presented the stimuli (i.e., one emergency warning) and
then asked a series of questions about that stimuli (see Measures section below).
The third section of the survey asked participants to indicate which sources and
platforms they typically use to seek information about natural hazards.
MEASURES
In accordance with Grothmann and Reusswig’s (2006) Precautionary
Adaptation Model, which was used to guide the research, a series of multi-item
scales were collected.
Threat appraisal was established by measuring the perceived probability and
perceived severity of the potential event. Both perceived probability (M= 4.71;
SD= 2.028) and perceived severity (M= 5.57; SD= 1.603) were measured using a
single item adapted from Yang (2012). The scale was scored on a seven-point
Likert scale (1 = Very unlikely, 7 = Very likely).
Given that fear heightens the perceived severity of the risk, negative emotions
were measured using a scale adapted from Yang (2012). The scale comprised
three items (i.e., Afraid, Anxious and Worried) scored on an 11-point Likert scale
(0 = None of this feeling, 10 = A lot of this feeling). The scale shows strong internal
consistency (M= 19.40; SD= 7.975; Cronbach’s α= .945; inter-item correlations
from .822 to .902).
In order to establish coping appraisal, the survey measured the perceived self-
efficacy, protective response efficacy, and protective response cost of each set
of instructions issued in the randomly allocated warning. Participants were asked
to consider each instruction presented in their stimulus (e.g., Check and follow
your Bushfire Survival Plan) and to determine (a) how confident they felt in their
ability to complete the action (perceived self-efficacy), (b) how effective they
thought the action would be at reducing their risk of impact (protective response
efficacy), and (c) how costly in terms of time, money or effort each action would
be (protective response cost). The responses were scored on a seven-point Likert
scale (1 = Very unlikely, 7 = Very likely).
The nine instructions included in the Prepare to Evacuate (Bushfire) message
were as follows:
15SUPPLEMENTING EMERGENCY WARNING MESSAGES TO ENCOURAGE READINESS TO ACT: THE EFFECT OF COLOUR AND ICONS | REPORT NO. 640.2021
• Check and follow your Bushfire Survival Plan.
• Tell family or friends where you are planning on evacuating to.
• Put on protective clothing (e.g., a long-sleeved cotton shirt, boots with
thick soles).
• Fill containers such as your bath, sinks, and buckets with water so you
have access to drinking water and firefighting water.
• Close windows and doors, sealing the gaps under doors and screens
with wet towels.
• Bring pets inside and restrain them with a leash, a cage, or inside a
secure room prior to transport. Provide them with plenty of water.
• Move flammable materials such as doormats, wheelie bins, and outdoor
furniture away from your house.
• If you have time and it is safe, tell your neighbours about this warning.
• Listen to your local ABC radio station for updates.
When summated to assess perceived self-efficacy when preparing to evacuate
due to a bushfire, the nine-item scale shows strong internal consistency (M= 53.31;
SD= 9.619; Cronbach’s α= .931; inter-item correlations from .466 to .811). When
summated to assess protective response efficacy when preparing to evacuate
due to a bushfire, the nine-item scale shows strong internal consistency (M= 52.36;
SD= 10.520; Cronbach’s α= .939; inter-item correlations from .533 to .820). When
summated to assess protective response cost when preparing to evacuate due
to fire, the nine-item scale shows strong internal consistency (M= 22.15; SD=
14.882; Cronbach’s α= .971; inter-item correlations from .679 to .900).
The ten instructions included in the Evacuate Now (Bushfire) message were as
follows:
• If the way is clear, leave now for a safer place.
• Check for road closures and then advise family and friends of your
intended travel route.
• Put on protective clothing (e.g., a long-sleeved cotton shirt, boots with
thick soles).
• Take the items you need to be away from home for three days. Include
clothing, medications, important documents (e.g., passports, birth
certificates), food and water, and personal care essentials like nappies.
• Secure your pets for safe transport.
• Drive with caution in low-visibility conditions.
• Drink plenty of water to stay hydrated.
• Listen to your local radio station or visit the Rural Fire Service (RFS) website
for regular updates.
• If you cannot leave, you need to get ready to shelter in your home and
actively defend it.
• If your home catches on fire and the conditions inside become
unbearable, you need to get out and go to an area that has already
been burnt.
When summated to assess perceived self-efficacy when evacuating due to a
bushfire, the ten-item scale shows strong internal consistency (M= 58.42; SD=
9.994; Cronbach’s α= .896; inter-item correlations from .271 to .768). When
16SUPPLEMENTING EMERGENCY WARNING MESSAGES TO ENCOURAGE READINESS TO ACT: THE EFFECT OF COLOUR AND ICONS | REPORT NO. 640.2021
summated to assess protective response efficacy when evacuating due to a
bushfire, the ten-item scale shows strong internal consistency (M= 58.53; SD=
10.594; Cronbach’s α= .926; inter-item correlations from .335 to .741). When
summated to assess protective response cost when evacuating due to a
bushfire, the ten-item scale shows strong internal consistency (M= 29.77; SD=
16.520; Cronbach’s α= .951; inter-item correlations from .444 to .881).
The ten instructions included in the Prepare to Evacuate (Flood) message were
as follows:
• If you have a flood plan, use it now.
• Decide where you will go. This may be to family and friends away from the
area or to your nearest temporary evacuation centre.
• Raise belongings by placing them on tables, beds and benches. Put
electrical items on top. You may be able to place light items in the roof
space.
• Find out how to turn off your power, water and gas supplies.
• Contact family members, friends and neighbours (especially vulnerable
people such as the elderly, etc.) to alert them of the potential for flooding.
• Pack an emergency kit, including warm clothes, medicine, valuables,
mementos and photos, personal and financial documents, canned food
and water in waterproof bags.
• Create sandbags by filling pillow cases or shopping bags with sand and
be ready to place them in doorways, toilets, and over drains to prevent
sewerage backflow.
• Make arrangements to care for pets or other animals, or make a plan to
take pets with you when you evacuate.
• Make sure you have enough food, drinking water, medications and pet
food to survive 3-5 days in case you become isolated.
• Listen to your local ABC radio station for updates.
When summated to assess perceived self-efficacy when preparing to evacuate
due to a flood, the ten-item scale shows strong internal consistency (M= 55.55;
SD= 11.194; Cronbach’s α= .913; inter-item correlations from .322 to .704). When
summated to assess protective response efficacy when preparing to evacuate
due to a flood, the ten-item scale shows strong internal consistency (M= 56.61;
SD= 12.070; Cronbach’s α= .942; inter-item correlations from .475 to .809). When
summated to assess protective response cost when preparing to evacuate due
to a flood, the ten-item scale shows strong internal consistency (M= 32.53; SD=
14.917; Cronbach’s α= .939; inter-item correlations from .364 to .825).
The nine instructions included in the Evacuate Now (Flood) message were as
follows:
• If you have a flood plan, use it now.
• Go immediately to a safer place. This may be to family and friends away
from the area or to your nearest temporary evacuation centre.
• Turn off your power, water and gas supplies.
17SUPPLEMENTING EMERGENCY WARNING MESSAGES TO ENCOURAGE READINESS TO ACT: THE EFFECT OF COLOUR AND ICONS | REPORT NO. 640.2021
• Lock your doors and windows.
• Take your emergency kit, including warm clothes, medicine, valuables,
mementos and photos, personal and financial documents, canned food
and water, with you in waterproof bags.
• Take pets with you when you evacuate.
• Drive to the conditions and with extra care.
• If you cannot leave the area, take shelter in the upper storey of a sturdy
brick or concrete multi-storey building.
• Listen to your local ABC radio station for updates.
When summated to assess perceived self-efficacy when evacuating due to a
flood, the nine-item scale shows strong internal consistency (M= 52.38; SD=
10.088; Cronbach’s α= .901; inter-item correlations from .291 to .684). When
summated to assess protective response efficacy when evacuating due to a
flood, the nine-item scale shows strong internal consistency (M= 51.86; SD=
11.334; Cronbach’s α= .939; inter-item correlations from .526 to .804). When
summated to assess protective response cost when evacuating due to a flood,
the nine-item scale shows strong internal consistency (M= 25.49; SD= 14.718;
Cronbach’s α= .955; inter-item correlations from .605 to .879).
In addition to the measures suggested by Grothmann and Reusswig’s (2006)
Precautionary Adaptation Model, the following additional multi-item scales were
used to collect data:
Perceived message comprehension was measured using a scale adapted from
Jeong and Hwang (2012). The scale comprised four items scored on a seven-
point Likert scale (1 = Strongly disagree, 7 = Strongly agree). The scale showed
some internal consistency (M= 23.44; SD= 4.186; Cronbach’s α= .614; inter-item
correlations of .041 to .828). After removing one reverse-coded item, the three-
item scale showed good internal consistency (M= 17.50; SD= 3.441; Cronbach’s
α= .765; inter-item correlations of .419 to .835) and thus the shorter scale was
used.
Perceived message effectiveness was measured using a scale adapted from
Davis and colleagues (2017). The scale comprised six items scored on a seven-
point Likert scale (1 = Strongly disagree, 7 = Strongly agree). The scale shows
strong internal consistency (M= 35.10; SD= 6.934; Cronbach’s α= .941; inter-item
correlations from .681 to .810).
18SUPPLEMENTING EMERGENCY WARNING MESSAGES TO ENCOURAGE READINESS TO ACT: THE EFFECT OF COLOUR AND ICONS | REPORT NO. 640.2021
FINDINGS
SAMPLE CHARACTERISTICS
The sociodemographic characteristics of the research participants were
representative of the Australian population in terms of gender, age, and living
location across the eight states/territories (see Table 1) and almost identical to
previous research in this area (Greer et al., 2019).
TABLE 1: SOCIODEMOGRAPHIC CHARACTERISTICS OF PARTICIPANTS IN THE AUSTRALIAN
POPULATION (2016) AND THE RESEARCH SAMPLE (2019)
Sociodemographic 2016 Australian Populationa 2019 Survey Sample
characteristics
(N = 18,190,217) (N = 2,482)
N % N %
Gender
Male 8,871,649 48.8 1207 48.6
Female 9,318,599 51.2 1264 50.9
Other -- -- 4 0.2
Prefer not to disclose -- -- 7 0.3
Age
18-24 2,144,694 11.8 275 11.1
25-34 3,367,877 18.5 457 18.4
35-44 3,144,282 17.3 428 17.2
45-54 3,104,305 17.1 418 16.8
55-64 2,753,018 15.1 395 15.9
65-74 2,076,226 11.4 297 12.0
75 and over 1,599,836 8.8 212 8.5
Location by Australian States/Territories
Australian Capital Territory 309,609 1.7 42 1.7
New South Wales 5,827,183 32.0 761 30.7
Northern Territory 170,695 0.9 15 0.6
Queensland 3,611,943 19.9 506 20.4
South Australia 1,323,883 7.3 200 8.1
Tasmania 400,776 2.2 50 2.0
Victoria 4,638,882 25.5 649 26.1
Western Australia 1,907,246 10.5 259 10.4
Note: a Australian population sample calculated for those aged 18 to 75+ years
19SUPPLEMENTING EMERGENCY WARNING MESSAGES TO ENCOURAGE READINESS TO ACT: THE EFFECT OF COLOUR AND ICONS | REPORT NO. 640.2021
Within the sample, 71.8% of participants were born in Australia. The other 28.2%
of participants were born overseas, predominately in the United Kingdom (6.7%),
New Zealand (2.4%), India (2.0%), Malaysia (1.6%) and the Philippines (1.2%). A
small proportion of participants (1.8%) did not appropriately respond to the
question.
Nearly all (94.5%) of the participants indicated they spoke English as their primary
language at home. Of the 5.5% who did not speak English as the primary
language at home, the most common primary languages were Mandarin (0.6%),
Cantonese (0.5%) and Hindi (0.3%). These statistics are likely under-representative
of the language diversity of Australian residents, due to the nature of the
research method (i.e., an online survey conducted in English).
Participants reported completing a variety of education levels (see Table 2): over
a third of participants (39.4%) had attained an undergraduate or postgraduate
university qualification, nearly a third (29.6%) had completed a TAFE qualification,
and over a quarter (28.7%) had completed high school to at least Grade 10. 2.3%
of participants left formal education prior to Grade 10.
TABLE 2: PEAK EDUCATION ATTAINMENT OF PARTICIPANTS
Level of Education n(%)
Postgraduate award (e.g., Masters degree, graduate diploma,
graduate certificate) 332(13.4)
Bachelor degree
645(26.0)
TAFE qualification (e.g., Certificate II, III, or IV)
735(29.6)
High school (to Year 12)
452(18.2)
High school (to Year 10)
260(10.5)
Left school before Year 10
58(2.3)
Participants predominately reported that they fully insured their house (61.0%),
contents (62.4%), and vehicle(s)(76.1%)(see Table 3). This finding suggests that
many participants believe they are fully covered for an incident; however, this
perception may be inaccurate as many Australian households are known to be
underinsured (Commonwealth of Australia, 2014). Of the minority of participants
that owned a farm (14.5%), most (65.5%) reported holding no insurance.
20SUPPLEMENTING EMERGENCY WARNING MESSAGES TO ENCOURAGE READINESS TO ACT: THE EFFECT OF COLOUR AND ICONS | REPORT NO. 640.2021
TABLE 3: SELF-REPORTED LEVEL OF INSURANCE BY ASSET
Asset Fully insured Underinsured No insurance Not applicable
n(%) n(%) n(%) n(%)
House
1515(61.0) 89(3.6) 430(17.3) 448(18.0)
Contents
1549(62.4) 173(7.0) 533(21.5) 227(9.1)
Vehicle(s)
1888(76.1) 140(5.6) 222(8.9) 232(9.3)
Farm
75(3.0) 48(1.9) 237(9.5) 2122(85.5)
The majority of participants (91.0%) reported that neither they nor other members
of their household were a current or past employee or volunteer of an
emergency services agency (see Table 4).
TABLE 4: LEVEL OF EMERGENCY SERVICE AGENCY INVOLVEMENT
Item Yes No
n(%) n(%)
Is anybody in your household a current or previous member of an
emergency service agency (e.g. Fire Service, State Emergency 223(9.0) 2259(91.0)
Services (SES) etc.), either as an employee or a volunteer?
The majority of participants had not experienced either a fire (75.9%) or a flood
(73.9%) (see Table 5). Those participants who had experienced either a fire or a
flood were most likely to report that it was a moderately severe event (MFire=4.68
out of 7, SD=1.58; MFlood=4.72, SD=1.52).
TABLE 5: THREAT EXPERIENCE APPRAISAL FOR FIRE AND FLOOD
Items Yes No
n (%) n (%)
Have you ever experienced a fire caused by a weather event (e.g.,
grass fire, lightning strike, hot weather) in your area? 598(24.1) 1884(75.9)
Have you ever experienced a flood caused by a weather event (e.g.,
rain, cyclone or storm) in your area? 648(26.1) 1834(73.9)
Participants typically accessed substantially similar sources of information
through substantially similar platforms during both floods and bushfires. The most
popular sources of information aside from emergency service agencies were the
Bureau of Meteorology, media, and local councils for both hazards (see Figure
2). The most popular platforms to seek information were radio, television and
online Google searches (see Figure 3).
21SUPPLEMENTING EMERGENCY WARNING MESSAGES TO ENCOURAGE READINESS TO ACT: THE EFFECT OF COLOUR AND ICONS | REPORT NO. 640.2021
FIGURE 2: TYPICAL SOURCES OF INFORMATION ABOUT FIRES AND FLOODS (BY NUMBER OF
PARTICIPANTS)
900 838
800 750
700 664
597
600 533 562
472
500 415 420
400 362 344346
300
200 121
100 48 34 61 43
18
0
Flood Fire
FIGURE 3: TYPICAL PLATFORMS USED TO SEEK INFORMATION ABOUT FIRES AND FLOODS (BY NUMBER
OF PARTICIPANTS)
900
75 6 777757
800 7 22 721
700 663
585
600 544 542
498 497
500
374
400
300
200 131215
8074 9368 6775
100 2421 3125 42
4
0
Flood Fire
22SUPPLEMENTING EMERGENCY WARNING MESSAGES TO ENCOURAGE READINESS TO ACT: THE EFFECT OF COLOUR AND ICONS | REPORT NO. 640.2021
MESSAGE COMPREHENSION AND EFFECTIVENESS
Previous research demonstrates that the text of current emergency warning
messages is perceived to be comprehensible and effective (Greer et al., 2019).
However, the effects of adding colour and icons to these messages is not yet
known.
Prepare to Evacuate (Flood)
A two-way between-groups ANOVA was conducted to investigate the effect of
colour and icons on perceived message comprehension for the Prepare to
Evacuate (Flood) message. There were no statistically significant main effects for
colour, F(1, 596) = .050, p = .82, or icons, F(1, 596) = .520, p = .47. The interaction
effect between colour and icons was not statistically significant, F(1, 596) = .852,
p = .36.
A second two-way between-groups ANOVA was conducted to investigate the
effect of colour and icons on perceived message effectiveness for the Prepare
to Evacuate (Flood) message. There were no statistically significant main effects
for colour, F(1, 596) = .032, p = .86, or icons, F(1, 596) = .577, p = .45. The interaction
effect between colour and icons was not statistically significant, F(1, 596) = 1.13,
p = .29.
In summary, the results showed that adding colour and/or icons to the Prepare
to Evacuate (Flood) message did not change its perceived comprehensibility or
effectiveness.
Evacuate Now (Flood)
A two-way between-groups ANOVA was conducted to investigate the effect of
colour and icons on perceived message comprehension for the Evacuate Now
(Flood) message. There were no statistically significant main effects for colour,
F(1, 651) = .227, p = .63, or icons, F(1, 651) = .099, p = .75. The interaction effect
between colour and icons was not statistically significant, F(1, 651) = .151, p = .70.
A second two-way between-groups ANOVA was conducted to investigate the
effect of colour and icons on perceived message effectiveness for the Evacuate
Now (Flood) message. There were no statistically significant main effects for
colour, F(1, 651) = .322, p = .57, or icons, F(1, 651) = .003, p = .95. The interaction
effect between colour and icons was not statistically significant, F(1, 651) = .009,
p = .93.
In summary, the results showed that adding colour and/or icons to the Evacuate
Now (Flood) message did not change its perceived comprehensibility or
effectiveness.
Prepare to Evacuate (Bushfire)
A two-way between-groups analysis of variance (ANOVA) was conducted to
investigate the effect of colour and icons on perceived message
comprehension for the Prepare to Evacuate (Bushfire) message. There were no
statistically significant main effects for colour, F(1, 599) = 2.02, p = .15, or icons,
23SUPPLEMENTING EMERGENCY WARNING MESSAGES TO ENCOURAGE READINESS TO ACT: THE EFFECT OF COLOUR AND ICONS | REPORT NO. 640.2021
F(1, 599) = 2.71, p = .10. The interaction effect between colour and icons was not
statistically significant, F(1, 599) = 0.00, p = .99.
A second two-way between-groups ANOVA was conducted to investigate the
effect of colour and icons on perceived message effectiveness for the Prepare
to Evacuate (Bushfire) message. There were no statistically significant main
effects for colour, F(1, 599) = 1.22, p = .27, or icons, F(1, 599) = .543, p = .46. The
interaction effect between colour and icons was not statistically significant, F(1,
599) = 2.55, p = .11.
In summary, the results showed that adding colour and/or icons to the Prepare
to Evacuate (Bushfire) message did not change its perceived comprehensibility
or effectiveness.
Evacuate Now (Bushfire)
A two-way between-groups ANOVA was conducted to investigate the effect of
colour and icons on perceived message comprehension for the Evacuate Now
(Bushfire) message. Kolmogorov-Smirnov and Levene’s tests show that the data
violate assumptions of normality and homogeneity of variance respectively, but
these violations are likely offset by the large sample size and equal group sizes.
There was a statistically significant main effect for colour, F(1, 620) = 6.18, p = .01;
however, the effect size is small (partial eta squared = .01). There was no
statistically significant main effect for icons, F(1, 620) = 2.40, p = .12. The
interaction effect between colour and icons was not statistically significant, F(1,
620) = .486, p = .49. This analysis suggests that the Evacuate Now (Bushfire)
message with a red header (M= 6.00, SD= .99) is perceived to be more
comprehensible than the same message with a greyscale header (M= 5.78, SD=
1.23).
A second two-way between-groups ANOVA was conducted to investigate the
effect of colour and icons on perceived message effectiveness for the Evacuate
Now (Bushfire) message. Kolmogorov-Smirnov tests show that the data are non-
normally distributed, but this violation is likely offset by the large sample size.
Levene’s test demonstrated homogeneity of variance. There was a statistically
significant main effect for colour, F(1, 620) = 6.20, p = .01; however, the effect size
is small (partial eta squared = .01). There was no statistically significant main effect
for icons, F(1, 620) = .521, p = .47. The interaction effect between colour and icons
was not statistically significant, F(1, 620) = .626, p = .43. This analysis suggests that
the Evacuate Now (Bushfire) message with a red header (M= 6.12, SD= 1.02) is
perceived to be more effective than the same message with a greyscale header
(M= 5.90, SD= 1.20).
In summary, the results showed that adding colour (i.e., red) to the Evacuate
Now (Bushfire) message improved the comprehensibility and effectiveness of the
message to a small degree.
24You can also read