Sustainability trends for land transport Doug Miller
←
→
Page content transcription
If your browser does not render page correctly, please read the page content below
Sustainability trends for land transport

              Doug Miller

                                           1
Sustainability trends for land transport

                                           2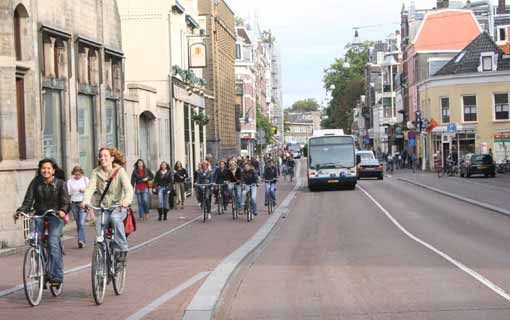
Sustainability trends for land transport

                                           3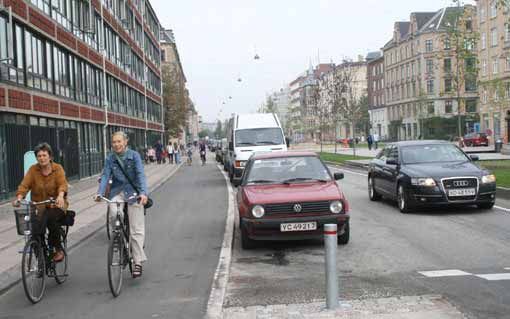
An evidence based approach

This presentation looks at

1. an evidence based approach to influence and drive
   sustainable land transport outcomes

2. sustainability trends for land transport

                                                       4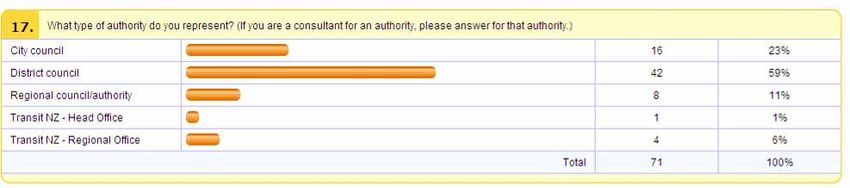
Context

•   The government’s vision for the future of transport is the

    New Zealand Transport Strategy (2002)

    •   it describes how transport can contribute to returning per capita income to the
        top half of the OECD and providing community and environmental benefits

    •   5 objectives:

             1.   Assisting economic development

             2.   Assisting safety and personal security

             3.   Improving access and mobility

             4.   Protecting and promoting public health

             5.   Ensuring environmental sustainability

                                                                                      5
Sustainability trends for land transport
• It has been over 4 years since the NZTS policy was produced – clear measures on how
NZ is going towards the NZTS objectives are not yet available
• This is because measuring the NZTS objectives in their current form is a problem
• This has led Land Transport NZ to develop a set of sustainability trend statements for
land transport
6Trend statements
13 trend statements have been derived – and aligned with the
NZTS objectives
Sustainability trend statements NZTS objectives
reduce need for people to travel (in cities and towns) 2,3,4 & 5
safer and more convenient environment (in cities and towns) 2,3,4 & 5
active modes increase 3,4 & 5
people drive in a way that uses less energy , is safe in conditions 1,2,4 & 5
fatal and serious injury crashes reduce 2
use private vehicles less in congested times 1,3,4 & 5
flows more efficiently with greater reliability 1&3
use of shared and passenger transport 4&5
reduced land transport related emissions 4&5
vehicle fleets more energy efficient 1,4 & 5
commercial transport improved management practices 1,2,4 & 5
more freight on rail & coastal shipping 1,4 & 5
freight industry productivity improves 1
1= Assisting economic development, 2=Assisting Safety and personal security, 3=Improving access and mobility, 4=Protecting and promoting
public health, 5=Ensuring environmental sustainability
7Trend Statement No 1
1. Development patterns of towns and cities reduce the need
for people to travel
• The compact urban form – population density
• The liveable community – land use
• minimal need for non-active transport modes
• close to or around public transport nodes
• live, work and play
• Reduced urban sprawl
8Trend Statement No. 1 – observed trend
1989–2006
• 5% decline in km travelled using active modes and public transport
• 50% increase in km travelled using motor vehicles
• 2007 survey – attitudes to using public transport significantly
different in Wellington when compared to Auckland and Christchurch
where private motor vehicles are preferred
1. No evidence of a relationship between urban density and the need to travel
(as opposed to overseas evidence)
2. Some evidence that the availability of public transport influences its use
(build the infrastructure and people will use it)
9Trend Statement No 2
2. Development of towns and cities, design of networks, and
operating rules provide a safe and convenient environment
for walking and cycling and other personal travel options
• Improved environments for walking and cycling
• Improved safety for pedestrians and cyclists
• Factors that influence individual choices to walk or cycle
• convenience
• personal security
• connectivity
10Trend Statement No 2 – observed trend
11Trend Statement No 2 – an aspiration
12Trend Statement No 3
3. More people choose active modes of transport
• How much walking and cycling is actually occurring
13Trend Statement No 3 – observed trend
14Trend Statement No 3
15Trend Statement No 4
4. People drive in a way the uses less energy and is safe
in the conditions
• Factors affecting safety – four principal behaviours
• Speed compliance
• Alcohol compliance
• Safety Belt compliance
• Failure to give way
• Energy use by motor vehicles (petrol & diesel)
16Trend Statement No 4 – observed trend
1996–2006
• Average unimpeded traffic speed decreased by about 6% dropping below 100km/h
speed limit in 2002
• 30% reduction in alcohol crashes, 10% increase in the use of front safety belts
2001–2004
• Energy demand (PJ) rose by 13%, vehicle kilometres travelled (VKT) rose by 11%
1. No evidence to suggest that people are driving in a way that uses less energy
2. People are increasingly driving in a way that is safer in the conditions
17Trend Statement No 5
5. Fatal and serious injury crashes reduce
• Actual number of fatalities and serious injury crashes
recorded within the national road Crash Analysis System
(CAS)
• Influenced by ‘3E’ initiatives
1. education (advertising & promotion)
2. enforcement (road policing)
3. engineering (vehicles & infrastructure)
18Trend Statement No 5 – observed trend
19Trend Statement No 6
6. People use private vehicles less in congested times
• Extent of the congestion problem
• Congestion as measured by the congestion index
• The extent of travel occurring by private vehicle at congested
times
• Focus only on Auckland, Wellington, Christchurch and Tauranga
20Trend Statement No 6 – observed trend
• 1996–2001 congestion has remained about the same in Auckland and
Wellington but increased in Christchurch (congestion index)
• 1989–2006 private vehicle use as a percentage of all trips increased by 9%
1. There was no evidence to suggest that people use private vehicles
less in congested times
21Trend Statement No 7
7. Traffic flows more efficiently with greater reliability on
the road network
• Congestion indicator
• Traffic speed indicator
• Trip time reliability – travel time variability
• Auckland, Wellington, Christchurch and Tauranga
22Trend Statement No 7 – observed trend
2003–2006
• Little or no change in peak time congestion in Auckland, Wellington or
Tauranga
• Increase in congestion in Christchurch
• Travel time variability reduced for all four cities in the morning and inter-peak
periods but substantially increased in the evening peak Auckland, Wellington and
Christchurch
1. Little or no evidence that traffic flowed more efficiently or with
greater reliability in all four cities
23Trend Statement No 8
8. The availability and use of shared transport, passenger
transport and services for the transport disadvantaged
increases
• Shared travel and access to motor vehicles
• Public transport
• Access for the transport disadvantaged
24Trend Statement No 8 - observed trend
25Trend Statement No 9
9. Land transport related vehicle emissions reduce
• CO2 emissions as measured by Ministry of Economic Development
26Trend Statement No 9 – observed trend
27Trend Statement No 10
10. The commercial and private vehicle fleets become
more energy efficient, safer and have improved
environmental performance
• Vehicle age as surrogate for energy efficiency, safety and environmental
performance
• Energy consumption for the whole fleet
• Emissions of CO2 from the whole fleet
28Trend Statement No 10 – observed trend
29Trend Statement No 11
11. Commercial transport operators adopt management
practices that promote safety, use less energy and
reduce emissions, noise and vibration
• Vehicle age as surrogate for energy efficiency, safety and
environmental performance
• Energy intensity – for the Transport and Storage industry
• Emission intensity – environmental efficiency for the Transport
and Storage industry
30Trend Statement No 11 – observed trend
• 1997–2003: vehicle ages (trucks & buses) increased marginally
• 1997–2003: energy intensity for Transport and Storage industry decreased
by 10%
• 1997–2003: CO2 emissions intensity for Transport and Storage industry
decreased by 9%
• Not known at this point – safety, noise or vibration
31Trend Statement No 12
12. Higher proportion of freight is carried on rail and
coastal shipping
• Freight diverted
• Rail freight increase
• Coastal shipping freight increase
32Trend Statement No 12 – observed trend
At this point in time, we do not have sufficient data to make any
assessment of this trend – work in progress
33Trend Statement No 13
13. Freight industry productivity improves
• Contribution that the Transport and Storage industry makes to
the economy
34Trend Statement No 13 - observed trend
35Trend scorecard
Trend Brief description Is sustainability trend occurring
1 reduce need for people to travel (in cities and towns) No
safer and more convenient environment (in cities and
2 towns) No
3 active modes increase No
people drive in a way that uses less energy, is safe in less energy No
4 conditions safer in conditions Yes
5 fatal and serious injury crashes reduce Yes
6 use private vehicles less No
7 flows more efficiently with greater reliability No
8 use of shared and passenger transport increase Yes
9 reduced land transport related emissions No
10 vehicle fleets more energy efficient No
11 commercial transport improved management practices Yes (partial)
12 more freight on rail & coastal shipping Not known
13 freight industry productivity improves Yes
36Cycle Monitoring (counting) – what is going on
Who is measuring cycling
Who plans to build more cycling infrastructure
37Whats next
• Government is developing sustainable transport targets (cycling
targets are likely) - provide something to aim for and give
cycling sense of urgency
• Land Transport NZ will be trialling new cycle counting
technologies in early 2008 – roll out to councils (electronic &
manual)
• Increase household travel survey sample size (Ministry of
Transport) - assist regional/national decision making
• Councils to complete comprehensive cycling strategies – strategy
focus
38You can also read