Indonesia Hotel Booking Path to Purchase Study - October 2015 - Think with ...

Page created by Carolyn Curry
 
CONTINUE READING
Indonesia Hotel Booking Path to Purchase Study - October 2015 - Think with ...
October 2015

Indonesia Hotel Booking Path
to Purchase Study
Indonesia Hotel Booking Path to Purchase Study - October 2015 - Think with ...
Indonesia: A Key Market for ‘the Next Billion’

       Population
      250m
      (world’s #4)
                                                                                         Top 10 biggest cities by population size
                                                                                                                      (from 2010-2020)

                                                                                 2.4m
                                           GDP                                    1.9m
                                                                                                                                                                     2010

                              $900b                                                         1.7m
                                                                                             1.4m                                       2.0m
                                                                                                                                                                     2020 (estimate)
                                                                                                                                                                  Population size
                                                                                                                                                                  (million)
                                                                                         Medan        11.9m                             1.5m

                                                                                                                                            Sulawesi

      1,000s
                                                                                                       11.9m
                                                                                          Sumatra                     Kalimantan

                                                                                          Palembang            1.7m          3.0m
      of islands                                                         2.0m
                                                                                                               1.4m          2.8m                                             Papua
                                                                         1.6m                                                                          Moluccas
                                                                                  Tangerang
                                                                                                 Jakarta
                                                                                                            Semarang                    Makassar
                                                                                                            Java         Surabaya

                          Digital usage                                           1.1m
                                                                                                    Bogor
                                                                                                            Bandung     Malang

                          (from Consumer Barometer*)                                                    1.9m                     0.9m
                                                                                  0.8m
                          Internet usage:       41.2%                                                   1.7m                     0.8m

                          PC category:          15.4%
                          Mobile phone:         85.2%
                          Smartphone:           43.3%

Source: World Bank, Euromonitor, Google Consumer Barometer * www.consumerbarometer.com
Study Background & Details

Background                         Study Details

Understand the overall             Integrated methodology capturing
consumer journeys for              online and offline behaviour
hotel bookings across the
omnichannel pathway                Online behaviour captured via
                                   Passive meter tracking
                                   Meter-based in-depth behavior tracking to capture
Help to Identify and               consumer journey across all relevant category
prioritise the touchpoints         touchpoints related to hotel bookings
that have the highest
influence on these travellers      Offline behaviour captured via
                                   biweekly diaries
Capture detailed online
behaviour and purchase                      Age 18-55 , SES AB
journey especially through                  who have a plan to book
                                            accommodation in the next 3 months
mobile devices using a
integrated behaviour tracking               Have at least one connected device
method                                      Opt-in panel with customers tracked over 8
                                            weeks
Methodology Details
                                                                      Opt-in Panel
        Screener survey                                           Passive meter tracking

                                                                        n=481 Tracked Sample

                                                         • Installing tracking meters “GfK LEOtrace®” (PC,
                                                           smartphone, tablet) to opt-in samples after initial
                                                           screener and meeting qualifying criteria
• Face-to-face interviews in 4 urban cities (Jakarta,
  Bodetabek, Bandung & Surabaya)                         • n=481 users tracked , 185 purchases captured
                                                           and analysed in field time
• Collecting user data on demographics, intention to
  book a hotel in next 3 months , have internet access   • Collecting behavioral data (site visit, app usage,
  and at least one connected device owned                  etc.) and tracking purchase activities for 8 weeks

• Fieldwork carried out in July 2015 to September 2015   • Capturing purchase journey during the field time
                                                           by mobile diaries and exit survey
1. Hotel Booking Journeys are long and purposive
Hotel Booking Journeys are long and purposive though the
                        individual sessions can be short

                                     28      Days
                                                                                               10                 26
                                                                                                                   Minutes

               Average Purchase                                               Average Number of           Average time spent
                Journey Length                                                Website/app visits          online on research

1.   Length : Base, n = 106 panelists who purchased and have valid dates of purchase and start research
2.   Visits : Base, n=205 panelists who visited relevant online touchpoints
3.   Time Spent : Base ,n = 205 panelists who visited relevant online touchpoints
Research is Omnichannel but 2 in 3 finally book the hotel
               online. Online bookings done mostly via smartphones

                                                                                                                 Device used for Booking
               Channel for Research                                           Channel for Purchase               (among Online bookers)

                                 1%
                                                                                                                     22%

                          Online Only                                  40%                                                 Smartphone
                                                                                                Online
                                                       46%
        54%               Both                                                                                  7%         Tablet
                                                                                                Offline
                          Offline Only                                                                    60%              PC
                                                                                                                                        71%

1.   Research : Base : n = 226 panelists, Online: Measured | Offline claimed in diary survey\
2.   Purchase : Base n = 185 panelists who purchased,, “Where did you book your hotel ?
3.   Online purchasers Base n = 111 , If booked online Which device did you use ?
Price still a key driver of choice when choosing a specific
                    hotel followed by facilities offered & location
                                          Important factors in choice of Accommodation

                                              Price                                              35%                                    64%
                                        Facilities                13%                                                                   64%
                                        Location                            20%                                                   59%
                    Good value for money                                  18%                                          43%
      Staff friendliness & helpfulness                    4%                            21%
       Look/ interior design of rooms                     2%                12%
                           Quick availability             4%             10%
            Look/design of the building                   1%         8%
                         Good review/ tests               1%       7%
                          Cancellation rules              1%4%
                                Free breakfast            0%3%
                                            Brand         2%3%
      Smoking vs Non-smoking room                         0%
                                                           2%                                   Overall importance           Most Important

1.   Base : n = 185 users who purchased | Final survey (n = 249): When booking your accommodation, which were the 3 most
     important traits for you personally?
2. Online touchpoints usage is high with TA’s and
             Search being prominent
TA’s, Search and Maps are most used among online
                    touchpoints, visits dominated by Aggregators
                                                Online touchpoints in the purchase journey

                    Travel Online Aggregators                                                 29%

                                      Search Engine                                          28%
                                                                                                                            44%
                                                     Maps                     13%

                                Travel Information                           11%

                                      Transportation                   5%
                                                                                                                            26%
                                   Airline Company                   4%

                                   Accommodation                     3%                                                     10%
                    Travel Traditional Booking                      2%                                                      7%
                                                                                                                            4%
                                                                                                                          3%
                                         Social Media             1%                                                         4%

                                           Reach of categories (%)                                                    Share of visits (%)

1.   Total users tracked: n = 481 ; Maps Usage weighted down to reflect day sessions where there was another travel
     related TP accessed
Word of Mouth is the most dominant offline touchpoint for
             travellers to trigger demand and gather information
                                                Offline touchpoints in the purchase journey

                                     Discussed with
                                    friends/relatives                       74%
                                                                                           30%
                 Watched the TV programme                             41%
                          Read the newspaper,
                          magazine, guide book                        41%
                                                                                           23%
            Called or visited Travel Agency                           40%
                         Called or visited the
                       accommodation directly                         39%
                                                                                           20%
                           Discussed with travel
                               professional                     21%
                                                                                             6%
                         Called or visited Travel                                            3%
                               Exhibition                     15%
                                                                                        7%
                                                                                              3%
                        Somewhere else offline                16%                            8%

                                                                                    Share of time (%)
                                           Reach of categories (%)

1.   Diary survey: n=232 users with 407 interviews
3. Hotel booking journeys are complex but in most
              cases start with search
Offline points important at the start , Search likely to be
            first online touchpoint, TA’s come in halfway through
                                             Touchpoint Stages & Roles : Category Level

        Read magazine/guide
        Watched TV programme

             Talk to TA
                                                                         Travel Aggregators

                                                          Search Engines

                                                                       Maps

                                                                            Travel Information
                                                                      Airline Companies
                                                                                      Accommodation

       Beginning                                                          Middle                      End

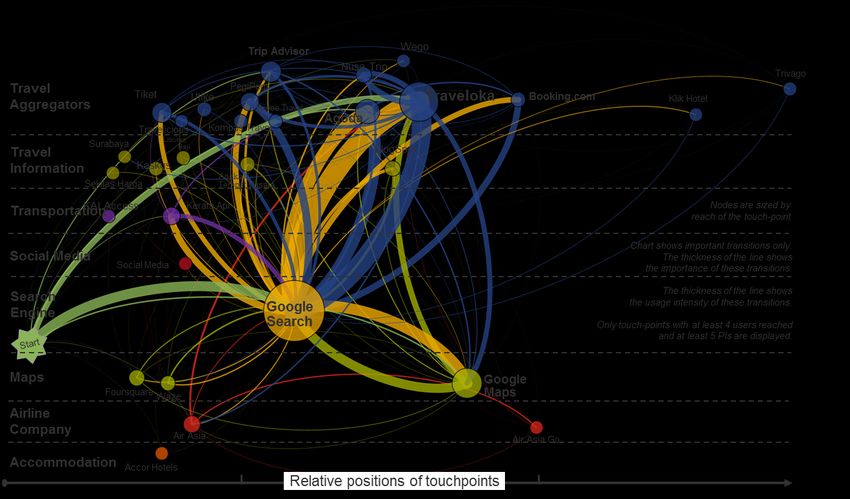
1.   Total users tracked: n = 481 ; Only Selected Touchpoints shown
Travelers exhibit complicated and fragmented online
       journey but search is a key start point
      Online journey map for Hotel booking : Category Level
Aggregators found via search, accommodation sites aren't
               doing enough to be found
       Online journey map for Hotel booking : App/Domain level
Summary

Hotel Bookers in Indonesia rely on digital for travel inspiration as well as
research and booking.

Hotel Booking Journeys are long and purposive though the individual
sessions can be short

Search is a key start point for any of these bookings and being discovered
right at the start is quite key, whatever kind of property be it online or offline

Aggregators key source of information as well as bookings, accommodation
sites aren't doing enough to be found

Price still a key driver of choice when choosing a specific hotel followed by
facilities offered & location
Sample Details
Sample Profile

                           Cities covered                                Occupation
 Jakarta           Bodetabek
 n=134             n=117
                                           Surabaya                  53%               12%
                                           n=107                    Private Co.      Self-Employed
                                                                     Employee
         Bandung
         n=123
                                                                     19%               17%
                                                                     Student           Housewife

  Gender                       Age                    SES
                                                                                  Income
50%                  44% 34%
                     18 – 27     28 – 37              SES A   40%
                                                                      32% 54% 15%
                                                      SES B            low        medium     high
                                               60%                   (
© Google 2015
You can also read