SUSTAINABLE URBANIZATION IN ASIA AND LATIN AMERICA - ASIAN DEVELOPMENT BANK - ASIAN ...
←
→
Page content transcription
If your browser does not render page correctly, please read the page content below
Sustainable
 Urbanization
 in Asia and
 Latin America

ASIAN DEVELOPMENT BANK
© 2014 Asian Development Bank and Inter-American Development Bank

All rights reserved. Published in 2014.
Printed in the Philippines.

ISBN 978-92-9254-588-8 (Print), 978-92-9254-589-5 (PDF)
Publication Stock No. BKK146703-2

Cataloging-In-Publication Data

Asian Development Bank. Inter-American Development Bank
    Sustainable Urbanization in Asia and Latin America
Mandaluyong City, Philippines: Asian Development Bank, 2014.

1. Urban planning. 2. Sustainable development. 3. Asia. 4. Latin America. I. Asian Development Bank.

This is a copublication of Asian Development Bank and the Inter-American Development Bank.

The views expressed in this book do not necessarily reflect the views and policies of the
Asian Development Bank (ADB) or the Inter-American Development Bank (IDB) or their respective
Board of Governors or the governments they represent.

ADB and IDB do not guarantee the accuracy of the data included in this publication and accepts no
responsibility for any consequence of their use.

By making any designation of or reference to a particular territory or geographic area, or by using the term
“country” in this document, ADB and IDB do not intend to make any judgments as to the legal or other
status of any territory or area.

ADB and IDB encourage printing or copying information exclusively for personal and noncommercial
use with proper acknowledgment of ADB and IDB. Users are restricted from reselling, redistributing, or
creating derivative works for commercial purposes without the express, written consent of ADB and IDB.

Note:
In this publication, “$” refers to US dollars.

Asian Development Bank
6 ADB Avenue, Mandaluyong City
1550 Metro Manila, Philippines
Tel +63 2 632 4444
Fax +63 2 636 2444
www.adb.org

Inter-American Development Bank
1300 New York Avenue,
N.W. Washington, D.C. 20577, USA
Tel: +202 623-1000
Fax: +202 623-3096
www.iadb.org
iii

Preface
This report on sustainable development of cities in Asia and Latin America is
part of the Asian Development Bank (ADB) and Inter-American Development
Bank (IDB) joint project on Enhancing Knowledge Sharing and South–South
Cooperation between Asia and Latin America. Among other topics where
cooperation is explored, urbanization was seen as a key issue because the process
is expected to continue for both regions as incomes and economies grow.

     Urbanization is a result as well as a driver of growth. Opportunities for
bettering one’s income and stature tend to be more plentiful in cities, while
the concentration of resources and talents in a geographical area allows for
higher productivity in the employment of resources. The rush of people and
economic activities into cities, combined with the limited capacities and
experience of developing country governments, has often been accompanied
by negative externalities such as pollution, congestion, slums, and damage to
the environment and ecosystems. As the two regions still struggle to deal with
the consequences of past and continued urbanization, the question arises: Are
there ways of optimizing the benefits of cities, while minimizing or altogether
avoiding their negative externalities? In other words: How can sustainable
urban development be achieved?

       Realizing the goal of sustainable living in cities involves understanding
and tracing the pathways of resource consumption and waste generation in
cities or what is generally termed urban metabolism. The concept of urban
metabolism informs how economic activities, urban form, and infrastructure
influence the metabolic process of a city. This information will be of immense
value to urban planners and policy makers for taking advantage of industrial
synergies, planning new infrastructure investments or reconfiguring existing
ones, prioritizing institutional investments, etc. Having well-planned and
managed cities directly improves the well-being of urban denizens and the
environment. But it is also a wise investment from a fiscal point of view in
terms of savings on costs related to accidents, health hazards, time resources,
and longevity of physical capital investments. This comparative report is but
a first step in placing Asian and Latin American cities into such a framework.
It is in this context that ADB and IDB are collaborating, to respond to and
anticipate their developing member countries’ needs for meeting the
challenges of urbanization in a sustainable way.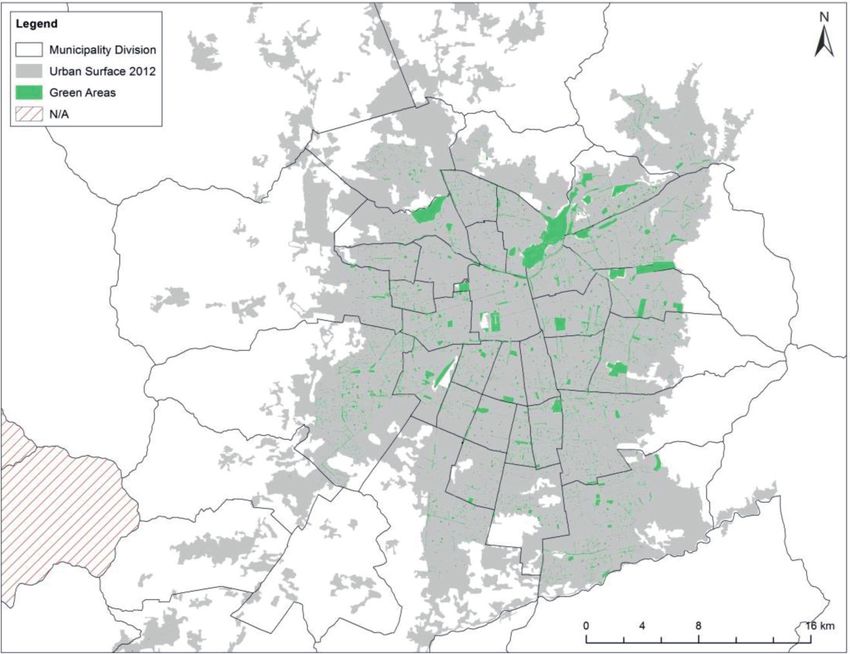
iv   Preface

           That the process of massive urban expansion started and occurred
     during different periods in Asia and Latin America offers opportunities
     for each region to learn from the other’s experiences. Latin America is the
     most urbanized developing region in the world and experienced the fastest
     expansion from the 1950s to early 2000. Governments in the region have
     long experience with assisting the urban poor, including through provision
     of housing and the now widely adopted conditional cash transfer programs.
     Asia, however, is a late comer—its urbanization started accelerating in the
     1980s, and is expected to continue the fast paced expansion well into the next
     3 decades. Because Asia is highly populous and has experienced sustained
     growth for the last 3 decades, its urbanization gave birth to some of the
     largest and densest cities in the world, supported by massive investments in
     infrastructure.

          Historically, urbanization is generally far from being a consciously
     planned, deliberate, and anticipated process. Rather, governments tend to
     react and discover accompanying problems when coming face to face with
     them. But the bright side of the story is that the two regions are home to the
     most dynamic countries in the world and that will dominate the narrative of
     growth and development of the recent past and the foreseeable future. This
     dynamism offers hope for designing solutions because information is now
     far more readily available than when the high-income countries of today
     underwent their urbanization processes.

          The first part of this report introduces motivation for the comparative
     report. The second part describes the processes of urbanization in Asia and
     Latin America and the resultant urban forms. Section three analyzes the
     urban metabolism of cities in the two regions and broadly classifies them
     based on resource consumption. Section four discusses how infrastructure
     can influence the metabolic process in cities. Section five discusses the role of
     governance, and the last section summarizes and concludes with the lessons
     learned from the two regions.

     Juzhong Zhuang                            Jose Juan Ruiz
     Deputy Chief Economist                    Chief Economist
     Economics and Research Department         Inter-American Development Bank
     Asian Development Bank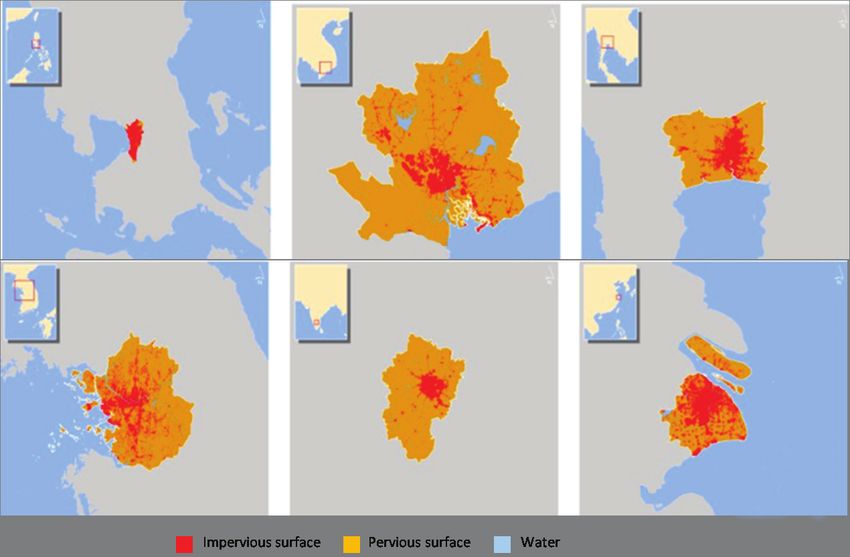
v

Acknowledgments
The completion of this report was made possible with the help and
collaboration of many individuals from various institutions.

     The direction and guidance provided by the former Chief Economist
Changyong Rhee of Asian Development Bank (ADB) and Chief Economist Jose
Juan Ruiz of the Inter-American Development Bank (IDB) was instrumental
in ensuring that the direction of the report is geared toward operational
relevance in serving the knowledge interest of ADB’s client countries and of
IDB’s member countries.

      Representatives from ADB member countries participated in the
inception workshop in Manila to share their perspectives and ensure that
topics covered in the report reflect their most immediate needs and concerns:
B. Mahendra from the Bangalore Metropolitan Region Development
Authority, Maria Josefina Faulan and Shiela Gail Satura from the Metropolitan
Manila Development Authority, Qiu Aijun from the China Center for Urban
Development, Sang-Il Kim from the Urban Information Center of Seoul
Institute, Saranat Kanjanavanit of the Green World Foundation based in
Bangkok, and Nguyen Trong Hoa and Du Phuoc Tan from the Ho Chi Minh
Institute for Development Studies. Toby Melissa Monsod and Rachel Racelis
from the University of the Philippines brought the perspectives of an urban
economist and an urban planner.

     This report was prepared by a team comprising Cesar Bouillon and
Mariana Racimo from IDB and Douglas Brooks and Eugenia Go from ADB.
It benefitted substantially from inputs from a background paper prepared by
Paulo Ferrao, André Pina, and Samuel Niza on the urban material flows of six
Asian cities and from five background papers for Latin American cities: The
report for Caracas was prepared by Roger Martinez (research leader), Marina
Fernández, Federico Ortega, and Angélica Schaper from Universidad Simón
Bolívar and Universidad Central de Venezuela; the report for Mexico City,
Cuernavaca, Toluca, and Pachuca was prepared by Marisol Ugalde Monzalvo
(research leader), Miguel Ángel Gómez Albores, and Víctor Katsumi
Yamaguchi Llanes in Tecnologico de Monterrey; the report for Medellin was
prepared by Francesco M. Orsini (research leader), Monica Ospina, Santiago
Leyva, Nora Cadavid, and Juan P. Ospina from Centro de Estudios Urbanos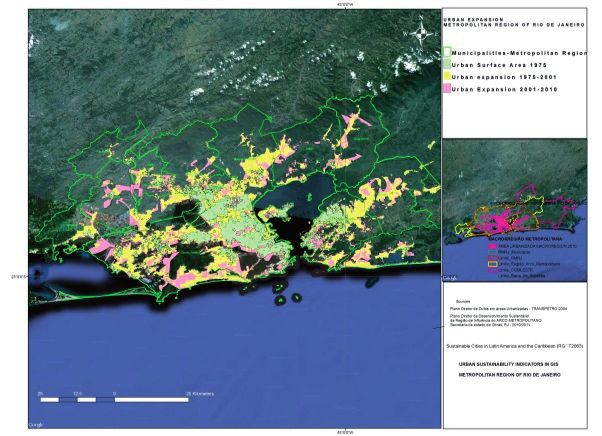
vi   Acknowledgments

     y Ambientales Escuela de Administración, Finanzas y Tecnología at the
     Escuela de Administración, Finanzas, y Tecnología (URBAM–EAFIT); the
     report for Rio de Janeiro was prepared by Jose A Gemal (research leader),
     Rogerio Valle, Ricardo Pontual, Marcello Guerreiro, and Eduardo Infante
     from the Laboratório de Sistemas Avançados de Gestão da Produção, Coppe,
     (COPPE–SAGE), Universidad Federal de Rio Janiero; the report for Santiago
     de Chile and Valparaiso was prepared by Roberto Moris (research leader),
     Arturo Orellana, Marcelo Miranda, Luis Fuentes, Horacio Gilabert, Carmen
     G. Troncoso, Karen Pape, Ana Rickmers, Claudio Tapia, Constanza Abusleme,
     Nelson Carroza, Oscar Figueroa, Francisca Zegers, and Jordan Harris from
     the Catholic University in Chile.

         This report also benefited from the insights and comments of Paavo
     Monkkonen of the University of California, Los Angeles. Brian Roberts of
     Land Equity International also generously provided his comments.

           Jill Gale de Villa was the manuscript editor, and Rhommell Rico designed
     the report cover and typeset the publication.

          We thank April-Marie Gallega, Matthew Howells and Maricris Jan Tobias
     of the Department of External Relations and the Office of Administrative
     Services of ADB for ensuring the timely and smooth production of this report.

          Finally, the production of this report would not have been possible
     without the financial support of ADB’s Strategy and Policy Department of
     ADB and IDB’s Institutional Capacity Strengthening Thematic Fund.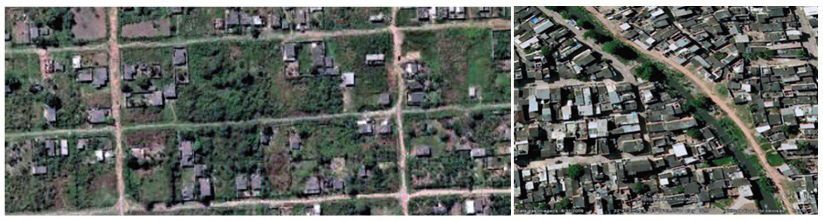
vii

Contents
1. Introduction............................................................................................................... 1

2. Characterizing Urban Form.................................................................................... 8

3. Material Flows in Selected Urban Areas............................................................28

4. Urban Infrastructure and Services......................................................................36
   4.1 Transport.........................................................................................................37
   4.2 Energy .............................................................................................................47
   4.3 Basic Services: Housing, Sanitation, and Water......................................50

5. Governance and Urban Sustainability................................................................63
   5.1 Information and Coordination....................................................................63
   5.2 Provision of Public Goods............................................................................66
   5.3 Policy Formulation and Implementation...................................................67

6. Moving toward Sustainable Cities.......................................................................70

References ...................................................................................................................75

Box
Technological Transformation of Bogota’s Integrated Public
Transportation System .................................................................................................41

Figures
1     Level of Urbanization, 1950–2050....................................................................... 1
2     Megacities, 2010 and 2025.................................................................................... 3
3     Annual Mean PM10 in Selected Cities................................................................. 6
4     Years to Progress from about 10% to 50% Urbanization.................................... 8
5     City Population Densities......................................................................................10
viii   Contents

       6    Spatial Analysis of Selected Asian Cities...........................................................12
       7    Evolution of Built-up Area in Seoul.....................................................................13
       8    Metropolitan Region of Rio de Janeiro...............................................................15
       9    Irregular Low-Income Group Settlement Patterns..........................................16
       10   Growth of Mexico City’s Urban Area, 1910 to 1970.......................................17
       11   Growth of Mexico City..........................................................................................17
       12   Mexico City’s Urban System.................................................................................18
       13   Urban Growth in Medellin, Aburra Valley..........................................................19
       14   Population Density in the Aburra Valley............................................................20
       15   Energy Consumption for Transport versus Urban Density in Cities.............22
       16   Measuring Fragmentation of Cities.....................................................................24
       17   Green Space per Capita in Selected Cities........................................................26
       18   Green Space in Metropolitan Santiago de Chile...............................................27
       19   Urban Metabolism Framework.............................................................................29
       20   Direct Material Input per Capita, Selected Cities, 2000................................30
       21   Direct Material Input per Capita Consumption, by Region, 2000................30
       22   Urban Metabolism of the Metropolitan Bangkok Area...................................31
       23   Resource Productivity in Asian Cities, 2000.....................................................33
       24   City Typology Based on Direct Material Consumption and
               Carbon Dioxide Emissions ...............................................................................34
       25   Energy Required by Types of Transport..............................................................38
       26   Modal Share of Transport in Selected Cities, 2008–2011.............................38
       27   Transport Systems in Metropolitan Rio..............................................................42
       28   Metropolitan Santiago: Coverage of Public Transport and Subway,
               2012 ...................................................................................................................43
       29   Tendency Graph of Motorization Rate and Population Density,
               Metropolitan Santiago.......................................................................................43
       30   Proportion of Trips by Clean Modes in the Medellin Aburra Valley
               Metropolitan Area..............................................................................................45
       31   Bicycle-Sharing Programs, by Region.................................................................46
       32   Share of Bicycles in Total Transport....................................................................46
       33   Sources of Electrical Power, Brazil .....................................................................48
       34   Electricity Demand in Asia and the Pacific, 2008............................................48
       35   The Ratios of House Prices and of Rent to Income,
               Selected Asian Cities.........................................................................................53
       36   Housing Affordability in Latin America..............................................................53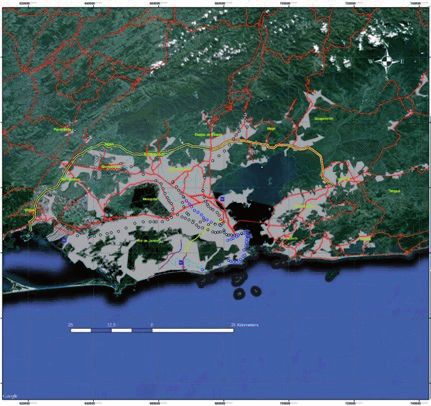
Contents          ix

37 Waste per Capita in Selected Cities....................................................................57
38 Composition of Municipal Wastes of Selected Asian and
     Latin American Cities........................................................................................58
39 Environmental Kuznet’s Curve in Asia...............................................................69

Tables
1    Average Fragmentation Indicators for 120 Cities, 2000.................................23
2    Direct Material Input, Metropolitan Rio, 2008.................................................30
3    Life Cycle of GHG Emissions by Electricity Source..........................................48
4    Indicators of Water Management in Selected Asian Cities ...........................60
5    General Characteristics of Asian and Latin American Cities.........................71

Abbreviations and Acronyms
 ADB                           Asian Development Bank
 AMVA                          Area Metropolitana del Valle de Aburra
 AUSIS                         American University School of International Service
 BRT                           bus rapid transit
 CO2                           carbon dioxide
 DMI                           direct material input
 DOE                           Department of Energy
 ECLAC                         Economic Commission for Latin America and the
		                             Caribbean
 EDGAR                         Emissions Database for Global Atmospheric Research
 EDSA                          Epifanio delos Santos Avenue
 EEA                           European Environment Agency
 EIU                           Economist Intelligence Unit
 EPI                           Earth Policy Institute
 GDP                           gross domestic product
 GHG                           greenhouse gas
 GORE                          Gobierno Regional Metropolitano de Chile
 IFC                           International Finance Corporation
 INE                           Instituto Nacional de Estadistica of Chile
x   Contents

      INEGI        Instituto Nacional de Estadistica, Geografia e Informatica
      IRAP         International Road Assessment Program
      JICA         Japan International Cooperation Agency
      KL Sentral   Kuala Lumpur Sentral
      LTA          Land Transportation Authority
      MITL         Magsaysay Institute for Transformative Leadership
      MMDA         Metro Manila Development Authority
      NBS          National Bureau of Statistics
      NGO          nongovernment organization
      OECD         Organisation for Economic Co-operation and
    		             Development
      OLADE        Latin American Energy Association
    		             (Organizacion Latinoamericana de Energia)
      PM10         particulate matter with a diameter of 10 micrograms
    		             or less
      PRC          People’s Republic of China
      PRRC         Pasig River Rehabilitation Commission
      SEDESOL      Secretariat of Social Development
    		             (Secretaría de Desarollo Social)
      SITP         Sistema Integrado de Transport Publico
    		             (Integrated System of Public Transport)
      SMA          Seoul Metropolitan Area
      SMSB         Shanghai Municipal Statistics Bureau
      UITP         International Association of Public Transport
    		             (L’Union Internationale des Transports Publics)
      UN           United Nations
      UNEP         United Nations Environmental Programme
      UN–HABITAT   United Nations Human Settlements Programme
      USDA         United States Department of Agriculture
      WDI          World Development Indicators
      WHO          World Health Organization
      WNA          World Nuclear Association
      WRI          World Resources Institute
Contents xi Weights and Measures µg microgram km kilometer km2 square kilometer ktoe kilo-ton of oil equivalent m2 square meter m3 cubic meter
1

1	Introduction
Cities have been at the center of social and economic interaction for as long as
human civilizations have existed. The expansion of cities in the 20th century
has been phenomenal, and now a majority of the world’s 7 billion people are
living in urban areas (UNEP 2013). As centers of growth and activity, cities will
continue attracting more people. The urbanization trend continues even as
technological developments have made physical distance less constraining for
a wide array of economic activities. At the same time, urbanization has been
a powerful force for economic growth and poverty reduction. By bringing
resources into geographical proximity, urbanization enables agglomeration
effects to be realized, making cities extremely productive and a potent source
of innovation and creativity.

     The end of the 20th century                                 Figure 1
                                                  Level of Urbanization, 1950–2050 (%)
has seen the pace of urbanization
                                                100
accelerate in both Asia and Latin               90
America, outpacing the rate                     80

at which the process has been                   70
                                                60
unfolding globally (Figure 1).
                                      Percent

                                                50
Urbanization levels are projected               40

to increase continually in both                 30
                                                20
regions. Thus, the world’s                       10
urban population will increase                   0
                                                       1950
                                                       1955
                                                       1960
                                                       1965
                                                       1970
                                                       1975
                                                       1980
                                                       1985
                                                       1990
                                                       1995
                                                      2000
                                                      2005
                                                      2010
                                                       2015
                                                      2020
                                                      2025
                                                      2030
                                                      2035
                                                      2040
                                                      2045
                                                      2050

substantially, given that Asia and
Latin America were already home                              World       Asia and the Pacific
                                                             Latin America and the Caribbean
to more than half the world’s
                                                Source: ADB (2012).
urban residents in 2010.

      As of 2010, Asia and Latin America had 16 of the world’s 22
megacities—12 in Asia and 4 in Latin America—(megacities are cities with
populations exceeding 10 million). And the number of megacities is expected
to rise considerably by 2025, to 20 in Asia and 6 in Latin America (Figure
2). Asia is already home to almost half the world’s urban residents and its
urban population is more than three times that of Europe—the region with
2 Sustainable Urbanization in Asia and Latin America
the second largest urban population. Meanwhile, Latin America is the second
most urbanized region after North America and has the highest urbanization
rate in the developing world (well ahead of Asia). Nearly 80% of Latin
America’s people now live in cities; consequently, city dwellers provide the
bulk of the region’s demand for housing and social services. The region’s 198
cities that each have populations of 200,000 or more currently host a total
of 260 million people and have a combined gross domestic product (GDP) of
$3.6 trillion (McKinsey 2011). By 2025, Latin American cities are expected to
have 315 million inhabitants and to generate 65% of the region’s GDP, which is
estimated at $3.8 trillion (McKinsey 2011). Even though the region has already
undergone the wave of urbanization that most other developing regions are
expected to experience in the next 15 years, Latin America will experience
important changes in income, population, and household formation patterns
in the coming decades (Bouillon 2012).
Rapid urbanization often means that governments are ill prepared
to handle the negative spillovers or to maximize the benefits that usually
accompany the process. The combined characteristics of speed and density
mean little time for adjustment or learning. The virtual permanence of built-
up areas also means that the growing size and number of megacities may
continue to be difficult to manage, and high population density leaves urban
populations vulnerable to catastrophic events and diseases.
Already, accelerated urban growth in developing countries has worsened
cities’ local environmental problems. People experience significant difficulties
in their daily lives as a consequence of air quality deterioration, traffic
congestion, noise pollution, and the unsustainable use of limited land resources.
As a result, the increasing demands and outputs of human activities exceed
environmental capacities (Donatiello 2001). The capacity of many urban areas
is overstretched by the demands of human activity, increasing the need for and
threatening the quality of basic services. These challenges are compounded
by higher inequality, congestion, and expansion of slums (lower quality or
informal housing). As a result of this lower quality of life, governments must,
as a high priority, formulate policies that have environmental protection as an
integral part of them.Introduction 3
Figure 2 Megacities, 2010 and 2025
2a 2010
Paris
Istanbul
Beijing Tokyo New York
Delhi Shanghai Osaka-Kobe
Cairo Karachi Dhaka Guangzhou Los Angeles
Lagos Mumbai Kolkata Shenzhen Mexico City
Manila
Rio de Janeiro
São Paulo
Buenos Aires
world 12-2551b AV
2b 2025
Moscow
London
Paris
Istanbul
Beijing Tokyo Chicago New York
Delhi Wuhan Tianjin
Lahore Osaka-Kobe
Cairo Chongqing Shanghai Los Angeles
Karachi DhakaGuangzhou
KolkataShenzhen
Mumbai Hyderabad
Lagos Manila Mexico City
Bangalore
ChennaiBangkok Bogotá
Kinshasa
Jakarta Lima
Rio de Janeiro
São Paulo
Buenos Aires
world 12-2551a AV
Note: The circles indicate population sizes ranging from (10 million) to (39 million). The circles do not
reflect the physical extents of the cities and any overlap between them merely reflects their relative
population sizes and not any official acceptance or endorsement of any geographical sovereignty.
Source: ADB (2012).4 Sustainable Urbanization in Asia and Latin America
But just as urbanization poses incredible challenges to economies, it
also has the potential of solving many of the environmental and sustainability
issues faced by the world because of the sheer influence cities have on resource
management and use. UNEP (2013) estimates that, as of 2005, 75% of global
energy and material consumption was accounted for by cities—which cover a
mere 2% of the world’s land area. Agglomeration makes it possible for cities to
be more productive than rural areas: 80% of the world’s output, measured in
GDP, is generated in cities (UNEP 2013). Agglomeration also enables synergies
in ideas and industries. Bettencourt et al. (2007) show that a 1% increase
in population in cities leads to a 1.13%–1.34% increase in GDP and in other
indicators of innovation, such as the number of new patents and the number
of research establishments. Moreover, urbanization is often associated with
the development of the service sector, which generally pollutes less than
manufacturing; facilitates innovation (including for green technologies); and,
under intelligent regulation, prompts traditional manufacturers to relocate
away from major city centers. A high density of people and activities helps
economize on the per capita provision of infrastructure and basic services
such as health, education, piped water, sanitation, and solid waste disposal.
A 1% increase in city population only needs 0.77%–0.83% of infrastructure
expansion to service the expanded population (Bettencourt et al. 2007).
Finally, rising educational attainment, an increasing middle class, and
declining birth rates are typically associated with urbanization and can have
broadly beneficial implications for resource use and the environment.
Cities in developing countries are currently subject to a variety of
problems associated with the provision of basic needs, increasing rates of car
and land use, and rising consumption of energy and water. Cities face challenges
from both over- and under-consumption, which differ by socioeconomic
group and across geographical boundaries within cities. Growing urban areas
require better regulation, investment, and spatial and sector planning in the
medium and long term, based on the main principles and criteria of sustainable
urban development. Planning, regulation, and investments for the cities of the
future should incorporate and foster innovations in technology, materials, and
processes, as well as “best practices” and the empowerment of groups within
urban society.Introduction 5
There is a growing recognition that sustainable conditions of urban
development are an input as well as a result of economic development
(Monkkonen and Ronconi 2013). Therefore, this report focuses on the physical
aspects of the environmental sustainability of urbanization more than on the
social or economic aspects. Urban sustainability is the capacity of a territory to
sustain a development model that balances economic growth, environmental
protection, and social integration, while upholding endogenous capacities,
territorial autonomy, and resource availability. By attaining such balance,
cities can fulfill their potential roles as mechanisms for addressing growing
environmental challenges faced by local as well as global communities
(Kennedy et al. 2012).
Sustainability is a pressing issue for Asia and Latin America, both of
which are expected to continue urbanizing. Already, slum dwellers accounted
for close to 30% of the urban population in the late 2000s,1 implying that a
substantial part of the urban population lacked access to basic sanitary services.
In Asia, this translates to close to 500 million slum dwellers, and almost 408
million people without access to improved sanitation facilities. The figures
are equally discouraging for Latin America, where almost 24% of the urban
population, or 115 million Latin Americans, are slum dwellers (ECLAC 2013).
Pollution and pollution-related health problems are among the most
conspicuous aspects of the sustainability issue in the two regions. Figure 3
shows that, of the cities monitored by the World Health Organization (WHO)
from 2007 to 2010, particulate matter (PM) in the air of 42 Latin American
cities had PM10 exceeding the 40 micrograms per cubic meter (μg/m3)
threshold prescribed the European Union as safe.2 In Asia, 116 cities exceeded
the European PM10 threshold. Almost all cities in both regions exceeded the
recommended WHO threshold of 20 μg/m3, and had some of the highest
1 Estimated using data from the UN Millennium Indicators Database Online (UN 2013a), and the
World Development Indicators (World Bank, WDI database). Both databases were accessed on 3
September 2013.
2 Data are from the WHO Outdoor Air Pollution in Cities Database (WHO 2011), accessed 3 September
2013. PM10 refers to “the fraction of particulates in air of very small size (6 Sustainable Urbanization in Asia and Latin America
concentrations in the world. Asian cities such as Beijing, Delhi, and Mumbai
have triple the amount of air pollution considered tolerable by the European
Union. Greenhouse gases (GHGs) tend to exacerbate air pollution. More than
half the world’s most polluted cities are in Asia, and air pollution contributes
to half a million deaths a year in the region. Addressing these issues and
anticipating them should be a priority. With populations living in urban areas
continuing to expand in the two regions, the negative effects of challenges
to sustainability will become even more dire if they are not addressed and
managed.
Figure 3 Annual Mean PM10 for Selected Cities
200
180
160
140
Annual mean PM10
120
100
80
60
40 EU
20 WHO
0
ab i
D d
D iro
um a
Be bai
a S an
an ra
Li i
Bo ma
nt a
o
Ja ul
on M tan o
G on co l
ala a
Ja on
Bu o ta
os ulo
Ca ires
Q as
Lo uito
To n
Zü yo
ew ch
Ca r
ng y
Sy ork
ey
te Ch F
z d Te ing
lam lh
a
g K ex bu
a
Ki Cit
M ak
Sa got
m in
ua g, D
a
iag
Is ir
o
gh
de Seo
Sh ier
ak
Sa kar
c
dn
Is De
k
e l hr
N ri
st
nd
ne
ij
en Pa
Y
ra
h
A
i
o
Ri
ru
aC
H
nt
Sa
Asia Europe
Latin America and the Caribbean North America
Middle East and Northern Africa Oceania
Subsaharan Africa
DF = federal district, EU = European Union, PM10 = Particulate matter with diameter of 10 micrograms or less,
WHO = World Health Organization.
Note: Annual mean PM10 (Particulate matter with diameter of 10 μm or less).
Source: WHO (2011).
In this context, both the Asian Development Bank (ADB) and the Inter-
American Development Bank are supporting research needed to develop a
rigorous and quantitative characterization of urbanization patterns. The aimIntroduction 7
is to use the results to identify the mechanisms that link urban patterns to the
character and intensity of urban resource consumption and waste generation.
This in turn can inform policy makers of bottlenecks that result in inefficient
resource consumption and waste generation.
Glaeser (2013) points out that the massive expansion of urbanization in
the high-income countries and that of the developing world started in very
different contexts. Whereas the West started the process in relatively closed
economies with wealth preceding urbanization, the process in the developing
world commenced and is continually occurring in the context of more open
economies, and is usually unfolding faster than income and governance
institutions can support. The different periods and contexts in the last half of
the 20th century, when the rapid expansion of urban areas took place in Asia
and Latin America, therefore offers a unique opportunity for the two regions
to learn from each other.8
2 Characterizing Urban Form
This section describes the dynamics of urban form in Asian and Latin
American cities, focusing on the key attributes of urbanization, decongestion
and suburbanization, fragmentation, and dispersion.
Urbanization refers to the increase in the shares of urban populations
over time. Figure 4 shows that the process is an older phenomenon in Latin
America, which also displays a higher level of urbanization. While Latin
America took 2 centuries to achieve a 50% level of urbanization, the region
took only 55 years more to have 80% of its population living in cities, a much
faster urbanization rate than that of North America or Europe. Asia started
urbanizing much later, but the speed and intensity of the process in Asia has
also been remarkable. From 1980 to 2010, Asia added over a billion people to its
cities—more than all other regions combined—with a further billion set to be
city dwellers by 2030. The People’s Republic of China (PRC) transitioned from
10% of its population in urban areas to 50% in just 60 years—a process that
took 210 years in Latin America and the Caribbean. Moreover, Asia’s urban
population is projected to continue growing faster than that of other regions.
Figure 4 Years to Progress from about 10% to 50% Urbanization
Latin America and the Caribbean 10% 210 years 49% 55 years 80%
9% 105 years 51% 75 years 81%
Northern America
Europe 12% 150 years 51% 90 years 80%
Asia 11% 95 years 51%
Viet Nam 12% 90 years 50%
Indonesia 12% 65 years 54%
Lao People's Democratic Republic 10% 60 years 52%
10% 55 years 51%
Bhutan
China, People's Rep. of 11% 61 years 51%
1725 1750 1775 1800 1825 1850 1875 1900 1925 1950 1975 2000 2025 2050
2010
Note: Extrapolation and interpolation were used to estimate urbanization level and corresponding starting
years for Latin America and the Caribbean and Northern America.
Sources: Estimates based on Bairoch (1988) and UN (2013b).Characterizing Urban Form 9
As of 2010, Asia and Latin America were home to the densest cities in
the world, with average city populations of 9.4 million in Asia and 4.6 million
in Latin America (EIU 2012). The density of Asian cities, in particular, stands
out, as is evident by the number of blue columns in Figure 5a. Nonetheless,
Figures 5b and 5c show that urban density has declined and is projected to
continue doing so in cities throughout the region, though this is primarily
due to expansion of physical urban areas rather than a decline in the urban
populations. The reduction in densities has been particularly striking in
Ho Chi Minh City, Kolkata, and Manila. Decreasing population densities in
Asian and Latin American cities calls for careful management to optimize
infrastructure investment.
Countries in Asia and Latin America have experienced an increasing
“metropolitanization”—the physical expansion of urban areas. Angel et
al. (2005) observed that all Asian and Latin American cities in their study
increased their built-up area during 1990–2000. This massive expansion
has resulted in new mega urban forms, with new externalities that arise
from the networks of centers and urban systems that operate on different
scales (Dematteis 1998). The expanded metropolitanization reflects two
separate processes: the expansion of big cities into adjacent areas and the
interconnection of preexisting towns (De Mattos and Fuentes 2012b). This
implies that some of the biggest urban areas “are evolving from monocentric
agglomerations to more complex systems made of integrated urban centers
(cores) and subcenters. In other territories, a considerable number of cities
and towns are increasingly linking up, forming polycentric integrated areas”
(OECD 2012b: 20).
Indeed, most cities have expanded horizontally faster than vertically, as
technological capacities have reduced the barriers to interaction determined
by distance. Glaeser and Kohlase (2003), for example, estimate that intercity
transport costs in the United States declined by 90% during the 20th century.
Other factors fueling urban expansion in recent years include re-invigorated
road-building activities, low-density suburban development, distant public
housing projects, and squatter settlements at the urban fringe. An increasing
number of industries, and hence settlements, also sprang up on the outskirts
of cities as land prices in urban centers tend to be exponentially higher and10 Sustainable Urbanization in Asia and Latin America
Figure 5 City Population Densities
5a Selected Cities Ranked by Population Density
45,000
40,000
35,000
Density (people/km2)
30,000
25,000
20,000
15,000
10,000
5,000
0
Ko ai
Ka ta
Sh chi
en i
Ki en
Ch sa
Ti i
jin
Be i
ta
a
o Ban gos
in re
La d
Sh ore
Sa hran
o
ng e
Ba ore
Se xic d
on
yd ity
l/I ity
Bo g
Te g
Sh gha
na
h
m
ijin
n
Si cif
a
ul
a
b
el
lka
go
i M alo
ha
an
ab
M hd
C
ya
ou o C
zh
he
um
ra
en
Li
Pa
h
ap
La
D
Re
an
ns
h
en
er
Ch g
g
nc
o
M
e
H
H
Asia Latin America and the Caribbean Middle East and Northern Africa Subsaharan Africa
5b Evolution of Built-Up Area Densities of Selected Cities, 1990–2000
50,000
45,000
Built-up area density (people/km2)
40,000
35,000
30,000
25,000
20,000
15,000
10,000
5,000
0
in ai
Ko ty
ta
Se yde ila
In d
n
o
ico l
ng y
Sh ore
Te i
Ba an
Sa ok
o
Te yo
Ca iv
Sa cas
da lo
os a
s
Lo g
s A on
es
ex bu
a
re
Si Cit
ijin
en jar
l– ba
eo
r
iag
v
iM b
gh
ua u
Ci
lka
i
el
H an
k
k
hr
Lo nd
Ca
lA
Ai
Ch um
M tan
G Pa
ra
ap
ng
To
la
ou ra
ch
ng
Be
an
nt
h
M
o
M
Is
Bu
o
1990 2000
H
5c Urban Density Projections for 2020
16,000
Urban density projections for 2020
14,000
Urban density (people/km2)
12,000
10,000
8,000
6,000
4,000
2,000
0
am
re
s
ea
a
n
sia
s
sia
ile
d
il
ia
a
r
C
do
ra
ne
az
bi
tin
pa
an
liv
PR
o
Ch
or
y
ne
du
m
tN
ap
Br
ua
pi
Ja
ail
ala
en
Bo
K
lo
do
lip
on
ng
Ec
Th
g
e
of
M
Co
Ar
Vi
i
In
H
Si
Ph
ic
bl
pu
Re
0% annual density decline 1% annual density decline 2% annual density decline
Note: km = square kilometer; PRC = People’s Republic of China
2
Sources: Angel et al. (2010c) and UNDESA (2013).Characterizing Urban Form 11
the assembly of small parcels more difficult than in peri-urban areas. Thus,
developers may consider locating outside a city if adequate transport facilities
and infrastructure are available.
In the broadest sense, the configuration of cities is largely determined by
geography and history. Cities traditionally emerged in areas that were easily
accessible through waterways and had reliable supplies of basic needs such
as water or fertile land. Hence, the cities tended to be located in the plains
or near waterways, and from there, grew to their current size and form. But,
since the industrial revolution, technology has played an increasing role in
influencing urban form. An empirical investigation of 120 cities by Angel et
al. (2005) identifies urban population, income, and linkages via air transport
as primary drivers of urban land area expansion—a 100% increase in each
of these factors can expand urban area by 66%, 50%, and 12%, respectively.
As a result of increased access to information, policy tools (such as land and
building taxes, zoning, and regulations; reconfiguration of infrastructure;
and governance) also influence urban form, and therefore the efficiency of
cities. Hong Kong, China; Singapore; and Tokyo all demonstrate how using
these policies to engender an environment where human capital is harnessed
to work collaboratively can make for successful as well as sustainable cities
(Glaeser 2011).
Urban form and the spatial pattern of land use influence the way cities
use and generate resources and waste, and ultimately the quality of life of
city dwellers (Dempsey and Jenks 2010). Forman (2008) established that two
general patterns of urban growth yield particularly favorable results—“satellite
cities” and “compact concentric zones.” These patterns help preserve large
patches and corridors of green space for ecosystems while at the same time
providing for human development. Other patterns of urban growth, such as
urban sprawl, produce less optimal results. This pattern, “which jumbles
together fine-scale patches of people and nature on the land is one of the
least attractive designs. In addition to conserving fewer large patches of land
for ecosystems, sprawl tends to increase vehicle miles driven by commuters,
resulting GHG emissions, and infrastructure costs” (UN–HABITAT 2011c:
2). The greater dispersion of population makes it difficult to concentrate
enough demand to efficiently deliver public services (OECD 2012a). In Asia’s
dense cities, with critical masses of people in relatively small areas, supplying
essential services such as piped water and sanitation is less complex and more12 Sustainable Urbanization in Asia and Latin America
cost effective than in dispersed settlements. Asia’s late-comer advantage, plus
developments in transport and communications technology, facilitate linkage
and distribution of economic activities in new spatial patterns, mixing city
center density with new frontiers in an innovative pattern of city systems.
Figure 6 shows the built-up areas of six Asian cities. The boundaries
between the amber and gray areas distinguish the metropolitan areas, and
the red areas represent the built-up or impervious portions of the metropolis.
Based on these snapshots and analysis of spatial metrics by Ferrao et al.
(2013) and an analysis of population density, Bangalore, Manila, and (to lesser
extents) Bangkok and Shanghai exhibit concentric patterns of formation
while Ho Chi Minh City and Seoul tend to exhibit satellite patterns. In
Manila, the pattern evolved with 98% of its population growth from 2000 to
2010 taking place outside of the core city, so that the urban built-up area now
exceeds the jurisdictional boundary of the Metropolitan Manila Development
Authority. The same phenomena have been observed in cities in the PRC
and Mexico, where administrative boundaries adjusted as a response to the
Figure 6 Spatial Analysis of Selected Asian Cities
6a. Manila Metropolitan Region 6b. Ho Chi Minh Metropolitan Region 6c. Bangkok Metropolitan Region
6d. Seoul Metropolitan Region 6e. Bangalore Metropolitan Region 6f. Shanghai Metropolitan Region
Impervious surface Pervious surface Water
Note: Scales are not standardized.
Source: Ferrao et al (2013).Characterizing Urban Form 13
expansion of contiguous built-up areas stemming outward from the core.
Still, general patterns of concentricity or satellite form alone do not give
conclusive information on the actual sustainability of a city’s urban form.
For example, the supposedly “optimal” concentric patterns observed in
Bangkok and Manila belie the fact that intense human activities are taking
place in purportedly ecologically sensitive areas and along limited access
thoroughfares, contributing to environmental degradation and to the over 1.3
million traffic accident cases globally per year (UN–HABITAT 2011c).
In the Seoul Metropolitan area (SMA), population density at 10,400
people per square kilometer (km2) is among the highest of the world’s affluent
urban areas, exceeded only by Hong Kong, China. From 1950 to 2010, the SMA
added over 20 million people (Cox 2011). The speed of its population expansion
has been unprecedented except in Tokyo–Yokohama. Figure 7 shows how the
urban areas have evolved in a span of 18 years. The satellite pattern is easily
discernable, and is part of a conscious government effort to decongest the core
city. The area now accounts for 40% of the SMA’s population, down from a
peak of 62% in 1970. A significant portion of heavy manufacturing industry
in the SMA is in the northwest (Incheon), for easy access to deepwater
ports (Ferrao et al. 2013), supported by accompanying investments in well-
connected transport systems. This has allowed for a satellite pattern of
development. Statistics Korea (2010) predicts that the SMA population will
continue to expand, from 24 million people in 2010 to more than 31 million by
2030, although most of the increase will occur in Incheon and Gyeonggi.
Figure 7 Evolution of Built-up Area in Seoul
Seoul
Gyeonggi
Incheon
7a Republic of Korea 7b Built Up Area 1985 7c Built Up Area 2003
Source: Kim (2012).14 Sustainable Urbanization in Asia and Latin America
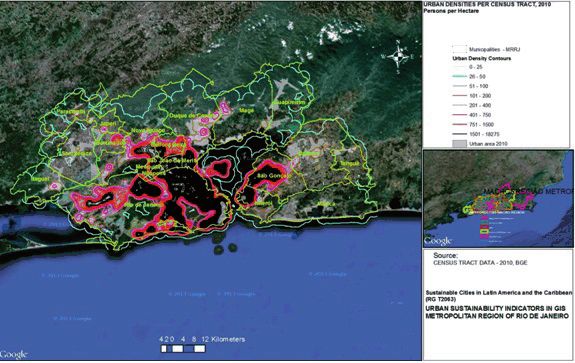
In Latin America, the development of urban land uses in the Metropolitan
Region of Rio de Janiero (“metropolitan Rio”) has taken place with decreasing
density, following the transformation of rural and undeveloped areas into
urban land. In 1975, metropolitan Rio covered about 434 km2 of land and the
urban resident population was about 8 million people, for a density of over
18,000/km2. But, between 2001 and 2010, the total urbanized area jumped
from about 1,200 km2 to 1,700 km2, an incorporation of about 55 km2 per year
into urban uses in a nonplanned process. The annual growth rate was almost
5 times the population growth rate, so that metropolitan Rio’s density in 1975
was three times that in 2010. This rapid expansion is shown as a pink shade in
Figure 8a. The expansion from 1975 to 2001, while also substantial, occurred
over a longer period of time and is represented by the pastel yellow shade.
The effect of both irregular and lower density development in
metropolitan Rio is illustrated in Figure 8. Figure 8b maps the densities of
different metropolitan areas. The irregular occupation of often unsuitable or
environmentally sensitive areas and low-density uncontrolled plot schemes
in the periphery, and densification of neighborhoods with better services and
amenities can be explained in part by market forces operating in the context
of insufficient land-use planning, regulation, and control, and the absence of
intelligent public housing programs. Figure 9 illustrates the patterns of low-
income settlements in metropolitan Rio. The image on the left shows informal
settlements that arose in fringe areas in low densities, but without access to
major infrastructure. The picture shows irregular plots of 300 meters or more
in the periphery of metropolitan Rio—550 km2 were developed in the city’s
periphery in this manner during the previous decade (Gemal et al. 2014). The
image on the right shows a dense slum (favela) in a sensitive and high-risk
area subject to flooding, and such slums were often built in land reserved for
preservation.
The middle and upper classes, both in the metropolitan core, i.e. Rio’s
central districts, and in the conurbation that represents the actual megalopolis
of metropolitan Rio, are presently the target of high-rise private redevelopment
in the traditional neighborhoods, with the best services and amenities, as
well as new private resort-type condominiums, i.e. closed, isolated, low- and
average-density development patterns.Characterizing Urban Form 15
Figure 8 Metropolitan Region of Rio de Janeiro
8a Municipalities and Urban Expansion
Guapimirim
Tanguá
Haguaí
Rio de
Janeiro
Municipalities-Metropolitan Region Urban expansion 1975–2001
Urban surface area 1975 Urban expansion 2001–2010
8b Classes of Urban Densities per Census Tract (as contours)
Guapimirim
Paracambi Magé
Duque de Caxias
Japeri
Nova Iguaçu
Queimados
Seropédica Belford Roxo Itaboraí
Sao João de Meriti Tanguá
Nilópolis
Haguaí Sao Gonçalo
Niteról Maricá
Rio de Janeiro
Municipalities Urban surface area 1975
Urban density contours
0–25 51–100 201–400 751–1500
21–50 101–200 401–750 1501–18275
Source: Gemal et al. (2014).16 Sustainable Urbanization in Asia and Latin America
Figure 9 Irregular Low-Income Group Settlement Patterns
Source: Gemal et al. (2014).
Mexico City, one of the heavily populated cities in Latin America, has
likewise experienced de-densification of 60% during a span of 3 decades.
The city’s population increased 40% between 1980 and 2010, while the
metropolitan area expanded by 250% (SEDESOL 2011). Figures 10 and
11 demonstrate the physical evolution of Mexico City during 4 centuries,
following a concentric pattern. The enlargement of the metropolitan area
imposed major transformations in the surrounding rural and urban centers,
generating growth and development in the region. The use of land surrounding
small towns changed when it was acquired by industries established outside
the city. The natural environment of the formerly sparsely populated areas
became housing land and recreational space for increasing numbers of city
dwellers and traditional land use changed with little deliberate or adequate
planning. In effect, Mexico City’s growth promoted the urbanization of
the municipalities of Cuernavaca, Pachuca, and Toluca, which are beyond
Mexico City’s metropolitan area (Figure 10) and have traditionally provided
environmental services to the city. These municipalities now have a
predominantly urban character and a high urban density. They retain a strong
level of functional relationships with Mexico City, such as having a significant
number of residents commuting to work within the central municipalities
of the metropolitan area and providing work to residents of the central
municipalities. A high percentage of the three municipalities’ populations
now work in industrial, commercial, and service activities.
Figures 11 and 12 show a predominant growth of Mexico City along a
northeast–southwest axis, with Pachuca to the northeast and Cuernavaca and
Toluca to the southwest.Characterizing Urban Form 17
Figure 10 Growth of Mexico City’s Urban Area, 1910 to 1970
Source: Ugalde et al. 2014, based on Mejia (n.d.).
Figure 11 Growth of Mexico City
Year
1519
1524
1555
1628
1753
1793
1853
1867
1880
1910
1942
1971
1993
Source: INEGI (2000).
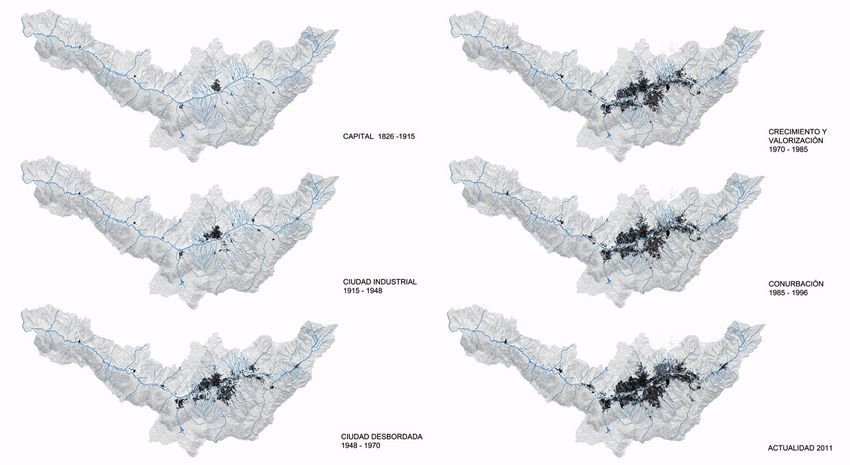
In Medellin, Colombia, the industrial development of the Medellin area
combined with violence that forced large numbers of people out of rural areas
triggered an urban growth rate that reached 6% per annum between 1940 and
1970. The evolution of Medellin’s size is clear from Figure 13. The Medellin
Aburra Valley’s permanent urbanization process has decreased in intensity in
recent decades, and currently shows much more moderate growth rates.18 Sustainable Urbanization in Asia and Latin America
Figure 12 Mexico City’s Urban System
Metropolitan areas of Queretaro,
Mexico City, and Puebla-Tlaxcala
Metropolitan area of Pachuca
Metropolitan area of Toluca
Metropolitan area of Morelos
Sources: Ugalde et al. 2014, modified from Rhoda and Burton (2010).
In physical terms, the last 60 years of urban growth in Medellin has
resulted in the pattern of a dense central urban core with several minor centers
north and south of Medellin, in the Aburra Valley. This urban form has been
described as concentric and therefore of low spatial footprint (UN–HABITAT
2011c). Connectivity in Medellin metropolis is achieved by a high capacity
road system that also functions as a national road. Topographic conditions
preclude building ring roads. Most urban facilities, services, and functions are
located along the road system, as are the industry and the main mass transport
system—an elevated metro system built in the 1990s that guarantees good
accessibility to urban centers within the valley. Residential areas, both formal
and informal, tend to occupy steeper zones.
Nonetheless, the dynamics of city expansion implied the development
of informal settlements in the city because the growing demand for housing
generated by the exodus from rural areas was unmet. At first, the informal
settlement process in Medellin focused on the steepest areas on the city’s
northern, central-east, and western hillsides, which had adverse conditions
for human occupation and provision of public services. Conventional real
estate and urbanization processes focused on the flattest areas of the valley,
with better accessibility, topography, and location conditions. The highest
population densities are on the northeastern and northwestern hill slopes,Characterizing Urban Form 19
which support 20,000–52,000 inhabitants/km2 (AMVA 2012). The lowest
densities occur on the southwestern hill slope, at 4,000–20,000 inhabitants/
km2, and along the river, where some city areas have no housing.
Figure 13 Urban Growth in Medellin, Aburra Valley
1970–1985
1826–1915
1915–1948 1985–1996
1948–1970 1996–2011
Sources: Orsini et al. (2014), from AMVA (2012).
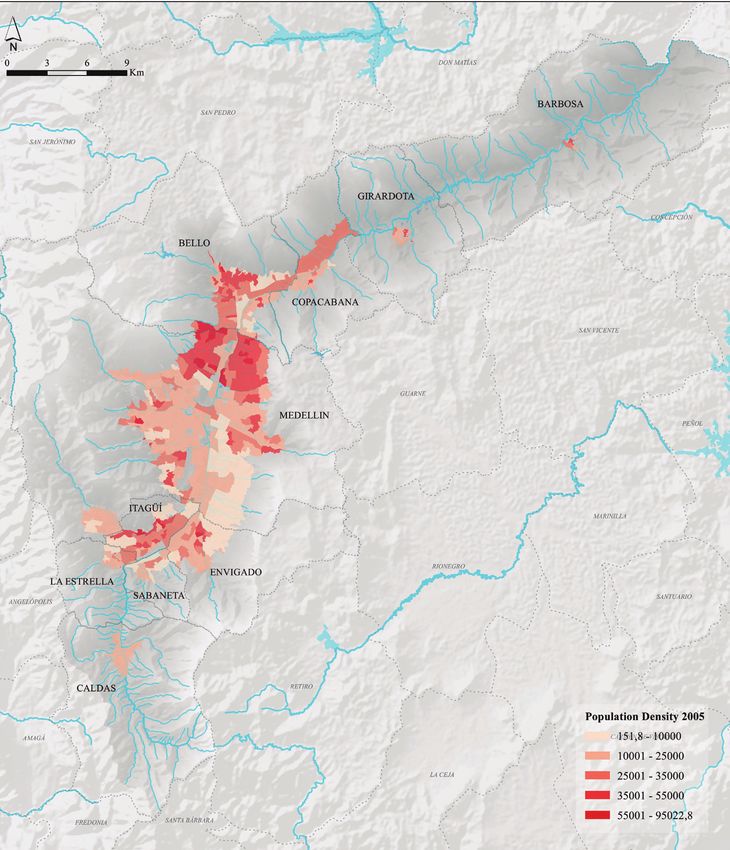
Figure 14 illustrates the issue, with most services and urban infrastructure
concentrated along the river, where the settlement density is relatively low
compared to that of the hillsides. Such a settlement pattern implies that
managing the area will be complex; due to geotechnical factors, the pattern will
result in environmental impacts associated with the alteration of hydrological
dynamics, and will involve high costs for mobilizing and operating public
utilities.
In Latin America, the decline in most cities’ population densities has been
accompanied by diseconomies and inequities in urban growth due to the lack
of integrated public investment planning and land-use planning or control.
The historical problem of income concentration has thus been aggravated by
urban sprawl and the illegal occupation/densification of unsuitable land (such
as by the favelas), where provision of public services has not kept pace with
needs for them.20 Sustainable Urbanization in Asia and Latin America
Figure 14 Population Density in the Aburra Valley
Population
Density 2005
≤ 10,000
10,001–25,000
25,001–35,000
35,001–55,000
55,001 ≤
Source: AMVA (2012).
Broadly speaking, the rapid drop in urban density signals a problematic
global phenomenon. Angel et al. (2005: 1) notes: “If average densities continue
to decline at the annual rate of 1.7% as they have during the past decade, the
built-up area of developing-country cities will increase from 200,000 km2 in
2000 to more than 600,000 km2 by 2030, while their population doubles.”
The looming outcome is fragmentation—scattered development whereCharacterizing Urban Form 21
spatial structures are fragmented by noncontiguous expansion to adjacent
countryside (Angel et al. 2010b). The implied results are wasteful and high
levels of land consumption, higher environmental impacts of urbanization,
and reduced modal share of public relative to private transport (Camagni et
al. 2002) In addition, because cities historically formed in highly fertile areas,
their expansion can have negative consequences for food security. Angel et
al. (2005) argue that the large majority of urban authorities in developing
countries should prepare realistically for growth, such as by securing the
necessary public lands and public rights-of-way needed to serve future urban
growth, by protecting sensitive lands from building activities, or by efficiently
investing in the infrastructure needed to accommodate growth.
High density tends to make cities more efficient. It allows quantitatively
fewer linkages and lower investment in transport and other infrastructure
to bring things into physical proximity with each other. Figure 15 is one
illustration of this point. Population density and energy consumption are
clearly correlated with transport, explained by distances travelled and by the
tendency to have more competitive public transport in denser cities (Camagni
et al. 2002). Economies of scale strongly associated with high density also
allow for lower costs of managing wastes and providing basic services. In
addition, the proximity and diversity of other industries holds the promise of
industrial symbiosis, where the waste of one sector in the economy can be
used as an input by another.
Nonetheless, density alone is not a desirable characteristic. Densities must
be sustainable. A low density may mean fewer benefits from agglomeration, but
a high density without institutional capacity and infrastructure for delivering
basic services and managing the volume of people, activities, and wastes also
means congestion, pollution, and a poor quality of life. The result is ultimately
a drag on productivity and well-being. For example, the Japan International
Cooperation Agency estimates that the Philippines forgoes 5% of its annual
output due to productivity losses from traffic congestion in Metro Manila
(JICA 2013). In a survey by Burton et al. (2004), aspects of urban living that
were observed to have worsened with densification include noise, road safety,
amount of open space, crime, and privacy.You can also read