Suzlon Energy Limited - H1 FY18 10 November 2017

Page created by Travis Wang
 
CONTINUE READING
Suzlon Energy Limited - H1 FY18 10 November 2017
Suzlon Energy Limited
H1 FY18

10 November 2017
Suzlon Energy Limited - H1 FY18 10 November 2017
Disclaimer

    •    This presentation and the accompanying slides (the “Presentation”), which have been prepared by Suzlon Energy Limited (the “Company”), have been
         prepared solely for information purposes and DOES not constitute any offer, recommendation or invitation to purchase or subscribe for any securities,
         and shall not form the basis of or be relied on in connection with any contract or binding commitment whatsoever. The Presentation is not intended to
         form the basis of any investment decision by a prospective investor. No offering of securities of the Company will be made except by means of a
         statutory offering document containing detailed information about the Company.
    •    This Presentation has been prepared by the Company based on information and data which the Company considers reliable, but the Company makes
         no representation or warranty, express or implied, whatsoever, and no reliance shall be placed on, the truth, accuracy, reliability or fairness of the
         contents of this Presentation. This Presentation may not be all inclusive and may not contain all of the information that you may consider material. Any
         liability in respect of the contents of or any omission from, this Presentation is expressly excluded. In particular, but without prejudice to the generality of
         the foregoing, no representation or warranty whatsoever is given in relation to the reasonableness or achievability of the projections contained in the
         Presentation or in relation to the bases and assumptions underlying such projections and you must satisfy yourself in relation to the reasonableness,
         achievability and accuracy thereof.
    •    Certain matters discussed in this Presentation may contain statements regarding the Company’s market opportunity and business prospects that are
         individually and collectively forward-looking statements. Such forward-looking statements are not guarantees of future performance and are subject to
         known and unknown risks, uncertainties and assumptions that are difficult to predict. These risks and uncertainties include, but are not limited to, the
         performance of the Indian economy and of the economies of various international markets, the performance of the wind power industry in India and
         world-wide, the Company’s ability to successfully implement its strategy, the Company’s future levels of growth and expansion, technological
         implementation, changes and advancements, changes in revenue, income or cash flows, the Company’s market preferences and its exposure to market
         risks, as well as other risks. The Company’s actual results, levels of activity, performance or achievements could differ materially and adversely from
         results expressed in or implied by this Presentation. The Company assumes no obligation to update any forward-looking information contained in this
         Presentation. Any forward-looking statements and projections made by third parties included in this Presentation are not adopted by the Company and
         the Company is not responsible for such third party statements and projections.
    •    No responsibility or liability is accepted for any loss or damage howsoever arising that you may suffer as a result of this Presentation and any and all
         responsibility and liability is expressly disclaimed by the Management, the Shareholders and the Company or any of them or any of their respective
         directors, officers, affiliates, employees, advisers or agents.
    •    No offering of the Company’s securities will be registered under the U.S. Securities Act of 1933, as amended (the “Securities Act”). Accordingly, unless
         an exemption from registration under the Securities Act is available, the Company’s securities may not be offered, sold, resold, delivered or distributed,
         directly or indirectly, into the United States or to, or for the account or benefit of, any U.S. Person (as defined in regulation S under the Securities Act).
    •    The distribution of this document in certain jurisdictions may be restricted by law and persons into whose possession this presentation comes should
         inform themselves about and observe any such restrictions. Any failure to comply with these restrictions may constitute a violation of the laws of such
         jurisdiction.

2
Suzlon Energy Limited - H1 FY18 10 November 2017
FY18: Year of Transition

3
Suzlon Energy Limited - H1 FY18 10 November 2017
FY18: Strategy During Transition Period

                                                         Volume Uncertainty

                           Suzlon USP                                                     Suzlon Strategy

                                                                   • Target high market share of bid volumes through
    • Execution of potential PPA backed orders
                                                                       ‒ Strategic customer tie ups (25 – 40% Share)
    • Capitalizing strength in captive & PSU customer base
                                                                       ‒ Best in class technology and project pipeline
    • Stable revenue base from 14+GW fleet under service
                                                                   • Targeting >50% market share of Captive Market
    • Third party component sale in SE Forge
                                                                   • Exploring select international markets on lean cost structure

                                               Declining Tariff, Increased Competition

                           Suzlon USP                                                     Suzlon Strategy

    • Best in class technology, execution track record & service   • 10% LCOE reduction through technology
    • Turnkey and end-to-end solution provider                     • Accelerate project pipeline investment
    • Strong project pipeline across windy states                  • COGS optimization through technology, value engineering
    • Strong & diverse pan India customer base                       & vendor negotiation
    • Vertically integrated manufacturing                          • Focused fixed cost optimization
    • 22+ years of leadership track record                         • Interest cost reduction by refinancing high cost debt

                                             Opportunities from short term adversities

                                              • FY19 volumes expected to be 6+ GW
4                                             • Increase in Suzlon market share
Suzlon Energy Limited - H1 FY18 10 November 2017
FY19: Strong Volume Visibility

       Central Auctions Completed                  2.2 GW
                                                                  Central Level Auctions
                                                                  SECI 1     1,050 MW      Completed
                                                                  SECI 2     1,100 MW      Completed
      H2 FY18 target for Central Auctions          4.5 GW

                                                                  State Level Auctions
                                                                  TN         500 MW        Completed
      State Auctions under Process                 1.0 GW         GJ         500 MW        In Process
                                                                  RJ              Under Discussion
                                                                  MP              Under Discussion

      Central PSU Tenders                          309 MW         Central PSU Tenders
                                                                  NTPC       250 MW        In Process
                                                                  Various     59 MW        In Process

      Strong Captive + PSU Demand (FY19 E)         500 MW

5                         Strong outlook for FY19 (6+ GW) and beyond
Suzlon Energy Limited - H1 FY18 10 November 2017
Poised To Become A 10+ GW Market

                                India Annual Wind Market Potential Size and Segmentation

                                                                           1 GW

                                           3-4 GW

                                                                                                   8-10 GW

              4-6 GW

         Central Auctions               State Auctions                  Captive / PSU            Annual Market

                                                    Central Auctions                         State Auctions
    Power Consuming State                           Non Wind States                           Wind States
    Project Installations                                Windy State                          Windy State
    Project Grid Connectivity                            Central Grid                          State Grid
    PPA Counter Party                                    SECI / PTC                     Respective State DISCOM
    Annual Market Size depends on           Non Windy State Power Demand                Windy State Power Demand

6                                          High volume market
Suzlon Energy Limited - H1 FY18 10 November 2017
Positive Aspects of Competitive Bidding

                       Until FY17                                           FY19 onwards

                                                                            Pan India Demand
            Demand from Wind States only
                                                                         (Wind + Non Wind States)

                FiT + Incentive Regime                           Auction based / Market Based pricing
                (High tariff uncertainties)                             (Reduced uncertainties)
               (Reluctance from DISCOM)                            (Most competitive source of power)

                   Back Ended Volume
                                                                     Reduced Seasonality in Volumes
         (H2 typically 60-70% of full year volumes)
                                                                       (Optimized Working Capital)
                (Inefficient Working Capital)

        Moderate scale Order Size (50 – 100 MW)                      Large Scale Orders (200-250 MW)

                   High Regulatory Risk                                  Reduced Regulatory Risk
                  (Back ended PPA signing                             (upfront signing of PPAs and tariff
         Tariff depending on commissioning timing)                              determination)

7                              India wind industry is transforming
Suzlon Energy Limited - H1 FY18 10 November 2017
Suzlon Best Positioned in Auction Regime

                                                 Auction Regime – Path Ahead

       Reduced Risk Profile
    • Reduced Counterparty Risk
    • Reduced grid risk
    • 25 years PPA
                            Lower Cost of Capital
                                                                                               Lower Power Cost
                        • Lower Cost of Debt                                                                +
                        • Longer Maturity Profile
                        • Lower Cost of Equity
                                                            Technology                         Market Expansion
                                                    • Increased generation
                                                    • Greater reliability
                                                    • Lower LCOE

                                                   Suzlon Competitive Edge

         Cost Competitiveness                                                Strong Market Positioning

         • Large Scale Operations                                            • Robust & Proven Technology
         • Vertically Integrated Manufacturing                               • 2+ Decades Track Record
         • Highest degree of localization                                    • Strong Customer Relationships
         • In-house Technology                                               • Pan India Project Pipeline

8                     To strongly benefit from market expansion through auctions
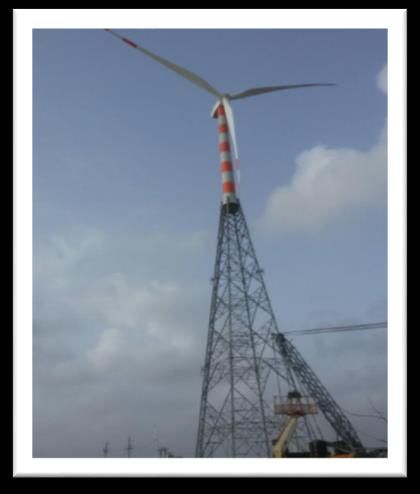
Suzlon Energy Limited - H1 FY18 10 November 2017
Financial Update

9
Suzlon Energy Limited - H1 FY18 10 November 2017
H1 FY18 Performance Despite Transition Period

                                     Despite Ongoing Transition period

                                    • 527 MW Delivery Volumes

                                    • ₹ 3,852 Cr. Revenues

                                    • $76M FCCBs converted (Debt Reduction)

                                     Despite Lower Operating Leverage

                                    • 15.1% EBITDA margins(1)

                                    • Rs. 117 crs Reported PAT

                                    • 94 Days NWC (Vs 89 days YoY)

10                                 Delivering performance in challenging period
     (1) EBITDA Margin is pre-FX
H1 FY18 Result Snapshot

     (₹ Crs.)

     Particulars                                H1 FY18      H1 FY17
                                                Unaudited    Unaudited

     Revenue                                      3,852        4,384      Transition period impacted volume
     Gross Profit                                 1,659        1,995      Revenue Mix impacted margins
     Gross Margin                                43.1%        45.5%       (19% Solar Volume Share)

     Employee Expenses                             409         514
                                                                          Result of ongoing optimization efforts
     Other Expenses (net)                          668         745
     EBITDA (Pre FX)                               582         736        Reflection of Gross Profit reduction due to
     EBITDA Margin (Pre FX)                      15.1%        16.8%       Solar

     Depreciation                                  161         173
     Net Finance Cost                              589         568        Due to higher working capital debt
     Taxes, Non Controlling Interest & Others      28           17
     Net Profit (Pre Fx and Ex. Items)            -196          -22
     Exchange Loss / (Gain)                        141          -3        Primarily Translational
                                                                          Gain on de-recognition of asset and liability and
     Exceptional Loss / (Gain)                    -455           0        release of foreign currency translation gain on
                                                                          account of overseas business subsidiary
     Reported Net Profit                           117          -20

11                          Performance despite temporary industry standstill
Q2 FY18 Result Snapshot

     (₹ Crs.)

     Particulars                                Q2 FY18     Q2 FY17
                                                Unaudited   Unaudited

     Revenue                                     1,187       2,736      Transition period impacted volume
     Gross Profit                                 557        1,268
     Gross Margin                                46.9%       46.3%
     Employee Expenses                            208         257
                                                                        Optimization efforts + Lower volumes
     Other Expenses (net)                         242         452
     EBITDA (Pre FX)                              107         559
                                                                        Lower Operating Leverage
     EBITDA Margin (Pre FX)                      9.0%        20.4%
     Depreciation                                  79          92
     Net Finance Cost                             303         276       Due to higher working capital debt
     Taxes, Non Controlling Interest & Others      12          7
     Net Profit (Pre Fx and Ex. Items)            -288        184
     Exchange Loss / (Gain)                        99         -60       Primarily Translational
                                                                        Gain on de-recognition of asset and liability and
     Exceptional Items                            -455         0        release of foreign currency translation gain on
                                                                        account of overseas business subsidiary
     Reported Net Profit                           68         244

12                                Transition period impacting volumes
H1 Deliveries

     Wind Solar Mix                     Customer Mix - Wind (%)                  Product Mix - Wind (%)

                                                  Others
                          Solar                                                       S9x
                                        Captive         6%
                       19%                                                               21%
                                                  14%

             81%                                             80%                                    79%
         Wind                                                  IPP / Utilities                            S111x

                                     • >30% volumes from Solar and Captive

                                     • New products gaining traction

13                 Right customer and product mix supports volume and profitability
Order Backlog

                                                                    Wind

                                                                    SECI I            PPA based      250 MW

     Firm Backlog                      670                          SECI II           PPA based      252 MW
     (As on Date)
                                       MW                           Others            Captive        38 MW

                                                                    Solar

                                                                    Solar Projects    PPA based      130 MW

            Firm Order Criterion changed from “Threshold level of Customer Advance” to “Certainty of PPA”

                                                        • Orders contingent upon projects getting PPA
                                                        • Key PPA Developments:
     Framework Agreements            >1 GW                ‒ AP: PPAs cleared by Cabinet, tariff ratification pending
                                                          ‒ KN: Rs. 3.74 / unit tariff notified, PPA process underway
                                                          ‒ GJ: Pre-bid tie up with customers participating in bid

                     OMS and SEFL order backlog not included in the above

14                               Strong customer tie ups in place
Steady Growth of Service Business

      (₹ Crs.)

      Operation and Maintenance Revenues

                                                            Growing into a sizeable & profitable business

                                                              ― External OMS revenue is ~21% of total revenue
                           +0.5%
                   883               888                        (H1 FY18)
      Internal     71                70
                                                 +0.7%
                                                            Annuity like business

                                                              ― Non cyclical (Annuity) nature of business

                                                              ― Steady cash flow generation
      External     812               818

                                                            100% renewal track record in India

                                                              ― Every turbine sold by us in India is under our Service fold

                 H1 FY17           H1 FY18                    ― Custodian of >11 GW of assets (US$ 11 bn) in India

                                                              ― 22 years of track record in India

15                                         Stable cash generation
Net Working Capital And Working Capital Debt

                    Seasonal build-up of working capital in lean quarters for strong execution in Q4

                                        NWC Days (NWC / LTM Revenues) X 365
     Net Working Capital
                                        NWC %     (NWC / LTM Revenues) X 100

                                            89                                                           94
                                                             83
                            63                                                               59
           51                                                                    47

         13.9%           17.4%            24.3%            22.8%               12.8%       16.1%       25.8%

        Mar’16           Jun’16          Sep’16            Dec’16              Mar’17     Jun’17       Sep’17

     Working Capital Debt (Rs. Crs.)

                                          3,182            3,151                                       3,244
                           2,468                                                           2,545
         1,894                                                                 2,076

        Mar’16           Jun’16          Sep’16            Dec’16              Mar’17     Jun’17       Sep’17

16                            Seasonality to normalize under auction regime
July 2019 FCCB Series Overview

     (US$ Mn)

     FCCB Principal Value

                                    31% of opening bond balance converted in H1 FY18

          547

                                                                                      No. of Shares (Crs.)
                                                                                      Current Outstanding       532
                          299
                                                                                      Pending Conversion        67

                                                                                      Post Full Conversion      599
                                           248                       (₹ 1,143 Crs*)
                                                             76           172         Conversion Details
                                                                                      Price (Per Share)      ₹ 15.46
                                                                                      Exchange Rate          ₹ 60.225

         Jul’14       Conversions       March’17       Conversions      Sep’17
                       Till FY17                       in H1 FY18

17                                   69% FCCBs already converted till date
     Note: 1 US$ = ₹ 65.28; *Numbers post impact of Ind-AS
Debt Profile

      (Excl. FCCB)                          30th Sep’17      5 year Maturity Profile

                                                             • Current bullet maturity of March 2018
                                           ₹ 4,068 Crs.*
     SBLC Backed AERH Debt                                   • SBLC facility lenders consented to SBLC extension till 2023
                                           (US$ 626 M)
                                                             • RBI approval received

                                                               (₹ Crs.)
                                             ₹ 456 Crs.
     Other FX Term Debt
                                            (US$ 70 M)                                                            814
                                                                                                      731
                                                                                            565
                                                                               388

                                                                   78
     Rupee Term Debt                        ₹ 2,860 Crs.
                                                                  FY18        FY19          FY20     FY21        FY22

                                                             • Non recourse project loan
     Solar Project Debt                      ₹ 168 Crs.
                                                             • Project SPV to be divested

     Gross Term Debt                        ₹ 7,552 Crs.

     Net Term Debt                          ₹ 6,747 Crs.

18                    Back ended maturity profile; Sufficient headroom for operations
     Note: 1 US$ = ₹ 65.28; *Numbers post impact of Ind-AS
Technology Update

19
S111-140 First Turbine Commissioned

                                          First 12 Months PLF

                         ~20%                                          ~5-6%
                  Higher Energy Yield                            Higher Energy Yield

      ~35% PLF                                 ~42% PLF                                ~44% PLF (Est.)

                    LCOE reduction                                  LCOE reduction

       S97-120                                   S111-120                               S111-140

       June’14                                   Mar’16                                    Aug’17

                                        Prototype Installation Dates

20                   Tallest all steel hybrid tower offering in India
S111-140: Most Competitive Across Suzlon 2.1 MW Series

                                        • 17% higher hub height enables:
                                             ‒ Accessing better wind profile;
                                             ‒ Increasing the attractiveness / viability of the low wind sites
                                             ‒ Unlocking unviable sites

                                        • Award winning tubular-lattice tower:
                                             ‒ Enables to achieve higher hub height at optimized cost
                                             ‒ Reduced steel requirement; reduced overall weight
                                             ‒ Lower foundation cost
                                             ‒ Simplified logistics
                                             ‒ 24 sq. m. base enhances stability and strength of the structure

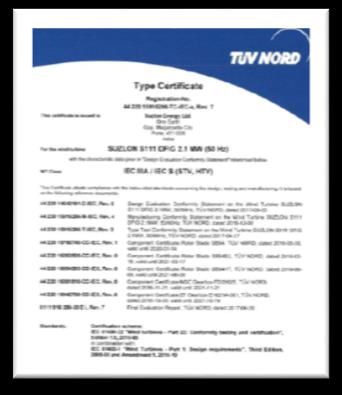
                                        • Product Development Update
                                             ‒ Received Type Certification from TUV NORD
                                             ‒ First turbine commissioned at the Gujarat

                 Surpassing its own benchmark of installing the highest 120 M tower

                            Tower height greater than 40 storey building

21                 Lowers LCOE further; Strong competitive edge
2.1 MW Series: Proven Platform with >100,000,000 Operating Hours

            Higher energy yield                           Lower cost of energy                           Sustains Lower Tariffs

                                                   >70% Increase in Energy Yield

     S88-80            S9X – 80/90/100            S97-120             S111-90                S111-120               S111-140

     >5.7 GW                >2.3 GW               >1.0 GW              >670 MW                 10 MW                1st Turbine
 Installed till date    Installed till date   Installed till date   Installed till date   Installed till date     Commissioned

22                       Over 4,500 turbines of 2.1 MW platform across 17 countries
Next Generation Products

                                    ~10% LCOE Reduction

                                     Enables lower tariffs bids
                                   while protecting OEM margins
                                       and Developer returns

               S111                                                        S128

               Product               S128 – 2.6 MW                S128 – 3.X MW
            Rotor Diameter             128 meters                  128 meters

             Tower Height            120 m - 140 m                 86 m - 140 m

             Wind Class             IEC III (Low Wind)                IEC II

            Focus Markets               Domestic                   International

            Time to Market                2018                        2019

23                           Committed to lower LCOE
Global In-House R&D Capabilities

                              Suzlon Technology Locations:
                                                                                         Hamburg
                                        - Development & Integration
                          Hamburg
                                        - Certification
         Germany
                                        - Development & Integration                      Rostock
                          Rostock       - Design & Product Engineering
                                        - Innovation & Strategic Research

      The Netherlands     Hengelo       - Blade Design and Integration                   Hengelo

                                        -   Design & Product Engineering
                                        -   Turbine Testing & Measurement
                           Pune
                                        -   Technical Field Support                      Pune
                                        -   Engineering
           India
                         Vadodara       - Blade Testing Center

                                                                                         Aarhus
                         Hyderabad      - Design & Product Engineering (BOP team)

                          Chennai       - Design & Product Engineering (Gear Box Team)

                           Aarhus       - SCADA                                          Vejle
         Denmark
                            Vejle       - Blade Science Center

24           Best match between skills & location – Efficient leverage of R&D spending
Industry Update

25
Government Strongly Committed to Renewables

     Fastest Growing Segment in Power Sector            Strong Government Backing due to:

                                                        • Sustainability: Clean Power
                             175 GW
                               15     Others
                                                        • Scalability: Short execution cycle and quickly deployable
                               40     Rooftop Solar

                                                        • Affordability: At Grid Parity (Cheaper than thermal)

                               60     Grid Solar
                                                        • Energy security: Self Sufficiency; No import dependency
                  58 GW

                                                        • Attracting Foreign Investments: Drawing Investments,
                               60     Wind
       19 GW                                               Pension funds, SWF, Multilateral

        2010       2017    2022 Target                  • Green Commitments: 33-35% emission reduction by 2030

26                Annual renewables capacity addition exceeding that of conventional
Wind Emerging As Most Competitive Source Of Power

                                                                            Tariff Levels
                                                                                                                       (₹ /unit)
      India APPC                                                                                                                   3.48

                                          3.18
                                                                                     2.65                  2.64

                                          Coal*                                     Solar#                 Wind

     Equipment                     Domestic / Imported                       Largely Imported        “Made in India”

     Fuel                          Domestic / Imported                         No Fuel Cost           No Fuel Cost

     Tariff Stability                      Variable                       Constant for 25 years   Constant for 25 years

     Set up Time
                                          ~4-5 years                           ~6-9 months            ~6-9 months
     (Scalability)

     Source: CERC, NTPC, SECI and State bid for Solar
     * Coal tariff is of NTPC’s average coal plant tariff for FY17
     # Solar tariff for Gujarat state bid for 500 MW, received after ₹ 2.44 SECI tariff

27                        Renewables is now an affordable “mainstream” source of energy
Suzlon Strengths in India Wind Market

                 Full Turnkey Solution                                        Pan India Presence
                        Provider

                                                     Target

                                                                                    Strong Customer
           Technology Leadership
                                                                                      Relationship
                                                REGAIN
                                          50%+ MARKET SHARE

                Best In Class Service                                      22+ Years Track Record
                    Capabilities

28   End-to-end service provider with strong presence across value chain & customer segments
Increasing Market Share in Growing India Market

      India Commissioning Volumes (MW)

          37%         24%            19%          19%                     26%            32%

                                                                                  +61%
                                                                                         5,502

                                                                                         1,779
                                                               +48%

                      -19%                                                3,415
          3,179
                                                                          900
          1,161                                    2,312
                                     2,077
                      1,721                         442
                                      403                                                3,723
                       415
                                                                          2,515
          2,018                                    1,870
                      1,306          1,674

          FY12        FY13           FY14          FY15                   FY16           FY17

          Suzlon    Others          Suzlon Market Share

     Source: MNRE

29                            Growing faster than market and peer group
Surpassed 11 GW Wind Energy Installations In India

        Ranked No. 1 in Renewables Sector                                  Largest fleet under Operation and Maintenance fold in India
        Ranked No. 2 in Power Sector

                                                                                           (31st Mar’17)         # of Turbines              MW
                                                                                           1 MW < 2 MW               4,268                5,774
                                                                                           =>2 MW                     2,258                4,742
                                                                                           Total                      8,204               11,293

              2.0 GW
                                                                                       •      35% - All India installed wind capacity
             2.4
             GW           0.4 GW                                                       •      ~20% - All India installed renewable capacity

                                                                                       •      ~1,800 customer relationships
                     2.1 GW
                               0.1                                                     •      22 years of operating track record
                               GW
                              1.5                                                      •      25 TWh estimated of annual clean energy;
                       0.8
                       GW     GW                                                               =2,030 mn trees planting p.a.

                              2.1
                                                                                               =~18.5 mn tonnes coal avoidance p.a.
                              GW                                                               =~24.4 mn tonnes CO2 emission savings p.a.

30              Custodian of 2nd highest installed power capacity (from all sources) in India
     Map not to scale. All data, information, and map is provided “as is” without warranty or any representation of accuracy, timeliness or completeness.
Suzlon’s Global Presence

                                                                                                                                 As on 30th Sep 2017

                                               2                                5
                 2                                                                          1

            North
           America                                                              6
                                                           3                                                                                     1
          2,779 MW
                                                                                                         4
                                                                                                                                   Asia
                                         3                                          5                                           12,521 MW

                              South America                                             Europe
                                 806 MW                                                 508 MW                            4
                                                                South
                                                                Africa                                        Australia
                                                               139 MW                                         764 MW
                                                                            6

31                        Suzlon’s strong relationships across regions positions it well
     Map not to scale. All data, information, and map is provided “as is” without warranty or any representation of accuracy, timeliness or completeness.
USA PTC Volume: ~500 MW Pipeline Created for 100% PTC Projects

     Production Tax Credit (PTC) Extension: Huge Volume Opportunity

     • PTC in USA extended until 2019 with benefits stepping down every year before phase out

     • In order to qualify, projects only need to start construction and make a minimum 5% investment

       (“Safe Harbour Investments”)

     • Thus projects which meet safe harbour investments in 2016, will be eligible for 100% PTC benefit, while projects
       which meet safe harbour investments in 2017 will be eligible for 80% PTC benefit

     • Timeline for completion of the projects is 4 years from the start of construction

         Start Construction/Safe                Timeline for
                 Harbor                         Completion                                 Suzlon Strategy

                   100% PTC
     2016                              2020
                                                                       • Established SPVs to implement Safe Harbor
                                                                         Projects and develop project pipeline
                          80% PTC
            2017                               2021                    • ~500 MW Pipeline created of projects eligible for
                                                                         100% PTC
                                 60% PTC                               • To translate into firm orders for execution over the
                   2018                               2022
                                                                         next couple of years

                                         40% PTC
                          2019                               2023

32                                     Re-entering international market
Detailed Financials

33
Consolidated Income Statement

      (₹ Crs.)
      Particulars                                H1 FY18     H1 FY17      FY17
                                                 Unaudited   Unaudited   Audited
      Revenue from operations                     3,852       4,384      12,693
      Less: COGS                                  2,193       2,389      7,543
      Gross Profit                                1,659       1,995      5,150
      Margin %                                    43.1%       45.5%      40.6%
      Employee benefits expense                    409         514       1,046
      Other expenses (net)                         668         745       1,901
      Exchange Loss / (Gain)                       141          -3        -297
      EBITDA                                       441         739       2,499
      EBITDA (Pre-FX Gain / Loss)                  582         736       2,203
      Margin %                                    15.1%       16.8%      17.4%
      Less: Depreciation                           161         173         389
      EBIT                                         280         565       2,110
      EBIT (Pre-FX Gain / Loss)                    421         563       1,813
      Margin %                                    10.9%       12.8%      14.3%
      Net Finance costs                            589         568       1,199
      Profit / (Loss) before tax                   -310         -3        912
      Less: Exceptional Items                      -455          0          0
      Less: Taxes and Non Controlling Interest      28          17         54
      Net Profit / (Loss) after tax                117         -20        858

34
Consolidated Net Working Capital

      (₹ Crs.)

                                         30th Sep’17   30th Jun’17   30th Sep’16

      Inventories                          4,518         3,952         3,450

      Trade receivables                    3,131         3,532         3,083

      Loans & Advances and Others          1,900         2,051         1,733

      Total (A)                            9,549         9,535         8,266

      Sundry Creditors                     3,390         4,594         3,029

      Advances from Customers              1,616          945          1,312

      Provisions and other liabilities     1,411         1,784         1,624

      Total (B)                            6,417         7,323         5,965

     Net Working Capital (A-B)             3,131         2,212         2,300

35
Consolidated Balance Sheet

     (Rs. Crs.)
      Liabilities                               Sep-17   Mar-17    Assets                               Sep-17   Mar-17
      Shareholders' Fund                        -6,525   -6,841    Non Current Assets
      Non controlling interest                    16        9      (a) Property, Plant and Equipment    1,369    1,420
                                                -6,509   -6,833    (b) Intangible assets                 181      211
                                                                   (c) Investment property                33       34
                                                                   (d) Capital work-in-progress          307      206
                                                                                                        1,890    1,871
      Non-Current Liabilities
      (a) Financial Liabilities                                    (e) Financial assets
          (i) Long Term Borrowings              4,409    4,841         (i) Investments                   253      189
          (ii) Other Financial Liabilities       287      225          (ii) Loans                         6        6
      (b) Provisions                              76      127          (iii) Trade receivables           35        46
      (c) Other Non-Current Liabilities           50       40          (iv) Other Financial Assets       931      712
                                                                   (f) Other non-current assets          113      166
                                                4,823    5,234                                          1,338    1,118

      Current Liabilities                                          Current Assets
      (a) Financial Liabilities                                    (a) Inventories                      4,518    3,469
         (i) Short-term borrowings              3,244    2,076     (b) Financial Assets
         (ii) Trade payables                    3,390    4,812        (i) Investments                     20       481
         (iii) Other financial liabilities      4,939*   4,927*       (ii) Trade receivables            3,096     3,628
      (b) Other current liabilities                                   (iii) Cash and bank balances       176       336
         (i) Due to customers                     18        17        (iv) Loans                          43        49
         (ii) Other non-financial liabilities   1,714     1,105       (v) Other financial assets         203       149
     (c) Short-term provisions                   880       822     (c) Other current assets             1,216     1,059
                                                14,185   13,759                                         9,271     9,171
     Total Equity and Liabilities               12,499   12,160    Total Assets                         12,499   12,160
     *Includes SBLC backed debt due current maturity in March / April 2018. However, lender’s consent
36   as well as RBI approval for extending the SBLC and Debt until 2023 already obtained.
Key Accounting Policies – Revenue Recognition and Order Booking

     Opening Order Book

                                     • Sales (WTG Revenue Recognition)
     (-) Sales during the period         ‒ WTG revenue is recognised upon transfer of risks and rewards to the buyer of
                                           complete WTG viz: Nacelle, Blade and Tower.

     (+) Order Intake during the     • Order Intake during the period
     period                              ‒ Only orders backed by certainty of PPAs

                                     • Closing Order Book
     Closing Order Book
                                         ‒ Represents MW value of contract against which no revenue is recognized in the
                                           income statement

37                        Adherence to best accounting and reporting practices
Key Accounting Policy: Maintenance Warranty Provisions

     Maintenance Warranty Provisions

        Accounting Policy:

         ― Comprise of provisions created against maintenance warranty issued in connection with WTG sale

               Created when revenue from sale of wind turbine is recognized

         ― Provisions estimated based on past experience

         ― Reversals of unused provision on expiry of Maintenance warranty period

        Global Wind Industry Standard Practice:

         ― Followed by top listed global industry leaders

         ― Despite Insurance and back to back warranty from suppliers

38                        Adherence to best accounting and reporting practices
CIN of Suzlon Energy Ltd - L40100GJ1995PLC025447

                                         THANK YOU

 39
You can also read