Sweat Rates and Hydration in CrossFit Athletes - Scientific ...
←
→
Page content transcription
If your browser does not render page correctly, please read the page content below
International Journal of Sports Science 2021, 11(2): 25-30
DOI: 10.5923/j.sports.20211102.01

             Sweat Rates and Hydration in CrossFit Athletes
                                  Jorge L. Ceja*, Andrew Harveson, Levi Garrett, Ed Garrett

                       Department of Health Science, California Baptist University, Riverside, California, United States

Abstract Given the intense and varied physical demands placed on CrossFit athletes, especially during competition, it is
vital that more information be gathered to best inform safe practice. The purpose of this study was to analyze the sweat rates
(L/h) and hydration indices (USG) of CrossFit athletes throughout a weekend long mock competition. Ten participants were
recruited, eight male (34.5 ± 4.7 y; 81.5 ± 2.12 kg) and two female (31.5 ± 4.8 y; 65.45 ± 2.3 kg). All participants were
pre-registered for a local competition that was canceled due to the COVID-19 pandemic. In its place, a mock competition
took place over two days, with a total of five workouts (WODs) completed. Body weight was obtained before and after each
WOD. USG was assessed on both days of the competition prior to starting any physical activity and after the completion of
the last workout. Mean sweat rate was 1.59 ± 0.34 L/h, averaging a body mass loss of 2.025 ± 0.439 percent per hour of
training. Pre-competition USG indices indicated that six athletes arrived with significant dehydration (USG 1.021-1.030) and
one athlete with serious dehydration (USG >1.030). Post-competition four athletes remained well-hydrated (USG
26 Jorge L. Ceja et al.: Sweat Rates and Hydration in CrossFit Athletes
systems that can be utilized during physical activity, such as 2.1. Participants
cardiovascular and muscular endurance, muscular strength, For the present study 10 participants were recruited by the
and power output. Most of the physiological systems utilized principal investigator using convenience sampling from a
during exercise are negatively affected by dehydration, local CrossFit affiliate. All participants were registered for a
jeopardizing an athlete’s performance. Dehydration during local CrossFit competition prior to its cancellation due to
prolonged strenuous aerobic exercise, affects performance COVID-19. Participants included eight male (34.5 ± 4.7 y;
by increasing core temperature, reducing blood plasma 81.5 ± 2.12 kg) and two female (31.5 ± 4.8 y; 65.45 ± 2.3 kg)
volume leading to an increase in heart rate and a reduction in CrossFit athletes that had all been training for more than one
stroke volume. This changes in the systemic blood flow, year. From those participants, seven athletes were in the Elite
reduce Oxygen delivery and consequently suppressing the category and three athletes were in the Masters category
aerobic metabolism [21]. Dehydration also affects the (40-44 years of age). Descriptive characteristics are included
maximum oxygen consumption in the body (VO2 max), in Table 1. This study did not jeopardize the performance of
when compared to an euhydrated state, increasing the the athletes, as it was not an invasive study, and athletes were
possibility of premature muscle fatigue and respiratory able to maintain their normal training/warm-up routines.
exhaustion [1]. California Baptist University’s Institutional Review Board
The anaerobic system also appears to be affected by approved all research procedures and local CrossFit affiliate
dehydration, but it is still unclear how the neuromuscular owners granted permission and allowed a mock competition
function and muscle contraction is impaired by dehydration. for data collection. A detailed description of the WODs are
A recent study by Pallares et.al. [17], examined the described in Table 2.
effects that severe dehydration has on muscle contraction
velocity, strength and power output. Researchers tested 163 Table 1. Descriptive Characteristics
competitive Olympic combat sport athletes and concluded Variable Mean ± SD
that severe hypohydration (1081–1500 mOsm · kg H2O−1)
Age (years) 33.9 ± 4.18
in elite combat athletes, affected the neuromuscular bench
Height (cm) 170.4 ± 3.3
press muscle contraction velocity by 7.3 ± 2.6% and jumping
power by 2.8 ± 3.9%. Researchers also concluded that Mass (kg) 78.3 ± 4.6
2
neuromuscular performance impairments can be reverse BMI (kg/m ) 26.94 ± 1.97
within a few hours after fluid replacement. A small reduction
in muscle contraction and power output during a competition The sample size was determined by power analysis
can be the difference between winning or losing, reinforcing (G*Power 3.1), with an α error level set at 0.05 and a
the importance of water in the body. As such, there is a need medium effect size of 0.5. The minimum number of
to add to the body of knowledge on the hydration status of participants needed to obtain appropriate power for the
CrossFit athletes during competition, which to this point has design in question was 45 volunteers [6]. However, due to
not yet been studied. the cancellation of the programmed competition, sample size
was not met and only 10 subjects were able to complete the
mock competition.
2. Methods
Table 2. Detailed Description of the WODs Performed by the Athletes During the Mock Competition
DAY 1 DAY 2
WOD 1 & 2 WOD 3 WOD 4 WOD 5
5 Rounds: For time For time 5 Rounds: (Elite)
30 Double unders 100 Fat bar Overhead squats 28/42kg 80 Wall-balls 16/20lbs (Elite, 10 Handstand push up
12 Chest to bar (Elite/Master) Master) 40 Toes to bar
4 Bar muscle up
6 Clean & Jerk 43/60kg (Elite) *Every time an athlete brings the bar 30 Kettle bell swings 24/32kg
3 Ring muscle up
40/56kg (Master) down, 2 legless short rope climbs (man) (Elite, Master)
2 Deadlift (100/160kg)
Time cap 10 min 1 Legless short rope climb (woman) 20 Box jump (Elite) 15 Box
jump (Master) 24/30 inch Time cap 8’
Rest 2 min *Master athletes: 1 legless short rope
Then climb (man), 1 short rope climb (women) 10 Snatches 45/70kg (Elite)
Time cap 8’ 40/65kg (Master) 5 Rounds: (Master)
WOD 2
Time cap 11’ 7/10 Handstand push up
3 minutes to find max weight for
3/4 Bar muscle up
the following complex
2/3 Ring muscle up
1 Clean
2 Deadlift (95/150kg)
1 Hang clean
Time cap 8’
1 Front squat
1 Shoulder to overhead
*(women/men)International Journal of Sports Science 2021, 11(2): 25-30 27
This research was carried out fully in accordance to the measurements after exercise, participants were asked to
ethical standards of the International Journal of Exercise towel-dry prior to weigh-in. A digital weight scale (model
Science [14]. The principal investigator had a meeting newfeel 100; Decathlon) was placed near the workout floor
with all participants prior to data collection to explain and to allow quick transitions between weighing-in- workout
answer any questions from the participants prior to signing and vice-versa. The time each athlete took to complete the
the informed consent. All personal information was workout was also collected. Average temperature and
de-identified after the data had been transferred into a data humidity during the competition were also collected to
sheet and had been stored on a password protected device provide information on the type of climate in which athletes
where only the researcher and faculty advisors had access to were competing but were not used as variables. USG was
the data to avoid private information leakage. assessed on both days of the competition prior to starting any
physical activity and after the completion of the last workout
2.2. Protocol using the RPT-20 ATC manual refractometer with graduated
This study utilized a pre-experimental, one-group intervals of 0.010 units and a scale ranging from 1.000 to
pretest-posttest design. This method allowed the researcher 1.050. Participants received an empty container with their
to understand any significant changes from the beginning name and ID number to collect urine and were accompanied
to the end of the study, and to analyze if CrossFit athletes by either the principal investigator or a female volunteer
are properly replenishing fluid throughout the competition. (CrossFit coach) to a private bathroom. Participants were
The independent variable was participating in a two-day discreetly observed voiding urine to ensure accuracy and
CrossFit mock competition, and the dependent variables avoid tampered samples. USG was analyzed by the principal
were hydration status and sweat rate. The scheduled investigator. The results were compared to the National
competition for data collection was a qualifier for Brazil’s Athletic Trainers Association’s indices of hydration status
largest CrossFit championship that features the best athletes Table (3). Data was collected in a non-air-conditioned
in the country called Torneio CrossFit Brasil (TCB). During facility, with an average inside temperature of 22°C (71.6°F)
this qualifier participants from all over the country compete and average humidity of 65%.
during a full weekend (Saturday and Sunday), to qualify for
the largest CrossFit competition in Brazil (TCB). For this 2.3. Statistical Analysis
qualifier there were 5 total workouts, 3 performed in day 1, Differences in USG before and after competition for both
with WOD 1 & 2 being together and number 3 a few hours days were compared using paired sample t-tests to determine
later, and workouts 4 and 5 on Sunday. The workouts are any significant differences between pretest and posttest
completed by heats and due to a large number of athletes, values with a confidence level of 95% [12]. Descriptive
heats can be a few hours apart, allowing time for athletes to statistics were used to organize and interpret data using
rest, eat, and rehydrate. In the mock competition for this means, standard deviations and standard error of the means.
research, athletes were given 2.5-hour break in between The software that was used to analyze the data (weight, times,
workouts, to mimic a real competition scenario. The WODs and USG) was Microsoft Excel, (Version 16.4). Also, the
for each age group were designed by the organizers of the following formulas were used to calculate the net body fluid
event. loss and sweat rates (L/h);
The data collection method for this research was Equation 1: WBSL (L) = [Body MassPRE-EX – (Body
performed as a field experiment. Urine samples and body MassPOST-EX – Fluid IntakeEX + Urine OutputEX)]
weight measurements were collected to analyze hydration Equation 2: WBSR (L/h) = WBSL/ Exercise Duration
status and sweat rates. For this research, body weight Where EX is during exercise, PRE-EX is pre-exercise,
changes were used to analyze fluid loss and consequently POST-EX is post-exercise, WBSL is whole-body sweat loss,
sweat rates throughout the competition. Assessment of USG and WBSR is whole-body sweating rate (2).
indicated the hydration levels of each participant. Fluid
intake during each workout was assessed for all participants
using a digital kitchen scale (model Casita FS-400) by 3. Results
measuring the amount of water the athletes took into the
workout and the difference after they finished the workout. 3.1. Sweat Rates
Athletes were encouraged to avoid pouring water on their Participants did not consume any fluids during the
bodies as it would affect the water intake measurements. workouts, primarily due to the nature of the mock
Food and fluid intake were not recorded in between competition, which included high intensities and short
workouts. Body weight in this research was obtained before duration workouts. None of the participants lost more than
and after each workout, and prior to ingestion of 1% of body weight during a single workout, or throughout
post-exercise food or drink. Male participants were weighed the competition, with an absolute sweat loss of 0.247 ± 0.088
with compression shorts only and female participants were L. Mean sweat rate was 1.59 ± 0.34 L/h, averaging a body
weighed with shorts and sports bra. For the body weight mass percentage loss of 2.025 ± 0.439% per hour of training.28 Jorge L. Ceja et al.: Sweat Rates and Hydration in CrossFit Athletes
Table 3. Pre and Post Competition Hydration Indices
Day 1 Day 2
Hydration status (USG) Pre-competition Post-competition Pre-competition Post-competition
Well hydrated 1.030 1 0 0 0
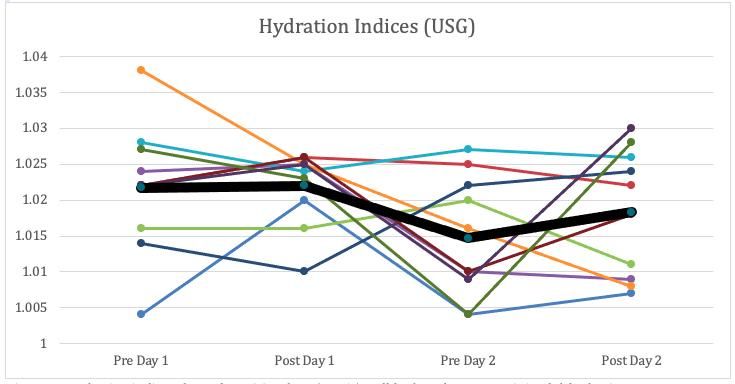
Figure 1. Hydration indices shown by USG values (x-axis) well hydrated 1.030. Black line indicates the mean USG of all participants (n=10)
Table 4. Pre- and Post-Competition Average USG Values
Pre-competition Post-competition
Day 1 1.0217 ± 0.0056 1.022 ± 0.0032
Day 2 1.0147 ± 0.0052 1.018 ± 0.0055
Table 5. Final Leaderboard
Place Mean USG WOD 1 WOD 2 WOD 3 WOD 4 WOD 5
1st 1.021 7:20 107kg 5:10 10:08 7:59
2nd 1.019 7:33 102kg 6:42 9:20 7:05
rd
3 1.008 8:23 111kg 6:54 8:45 7:14
4th 1.023 7:20 70.5kg 5:42 10:38 7:05
5th 1.017 9:11 102kg 6:22 10:22 71reps
6th 1.021 8:06 111kg 87 reps 10:58 90 reps
7th 1.015 9:51 66kg 7:47 9:56 56 reps
8th 1.020 9:19 84kg 85 reps 172 reps 35reps
9th 1.017 181 reps 89kg 71 reps 168 reps 54 reps
10th 1.026 111 reps 78.5kg 54 reps 158 reps 67 reps
kg = Kilograms
(USGInternational Journal of Sports Science 2021, 11(2): 25-30 29
However, there was a significant difference in hydration explanation as to why these subjects became more hydrated
levels when comparing day one pre-competition USG on day two, aside from non-regulatory fluid ingestion. The
measurements with day two pre-competition (p = 0.039), researchers believe that the mock competition may have also
which indicates the subjects replenished enough fluid and influenced participants to consciously or subconsciously
returned on day two with better hydration indices than after ingest more fluid in between days. Throughout day two,
completing day one. Pre- and post-competition average USG however, athletes did become more dehydrated, with 40%
indices are described in Table 4. finishing day two with a significant dehydration compared
WOD times and weights were collected (Table 5), without to 70% on day one. A study from Chapelle et al. [4]
any significant difference in performance when comparing hypothesized that athletes do not comprehend the purpose
the mean USG between the top five and bottom 5 athletes of the rest period and underestimate the importance of
(p=0.28). hydration in between event days to maximize performance
and prepare for future efforts. Athletes who begin an event
significantly dehydrated can expect higher core temperatures
4. Conclusions and reduced plasma volume, leading to an increase in heart
rate and reduction in stroke volume. Such effects reduce
The purpose of this study was to examine sweat rates and aerobic performance and aerobic work capacity by reducing
hydration status before and after competition. Previous the oxygen delivery to the working muscles [22] and
research indicates that athletes neglect the amount of fluid significantly affect performance of multi-repetition,
needed to be properly hydrated and a high percentage of multi-set exercises [10] typically found in CrossFit
them arrive to sport events in some state of dehydration workouts.
[16,7,22]. With this in mind, the authors hypothesized that In the current study the sweat rates during competition
CrossFit athletes would arrive on both days to the were 1.59 ± 0.35 L/h, which is slightly higher than the 1.316
competition in a state of dehydration and would not replenish ± 0.539 L/h rate seen in CrossFit classes [5]. However, the
enough fluid in between competition days. In accordance difference in sweat rates can likely be attributed to a large
with the primary research hypothesis, the majority of percentage (60%) of participants in the Cronin et al. [5] study
participants (n = 6) arrived on day one with significant training in an air-conditioned facility, and the differences in
dehydration, mean USG (1.0217 ± 0.0056). According to workout intensities. There is evidence that sweat rates are
NATA, a significant dehydration denotes a body weight greater in games/competitions than during practice/training
change of -3 to -5%, which has been shown to increase rate [15], which is likely explained by the correlation between
of perceived exertion and decrease time to exhaustion (3), sweat rates and exercise intensity. Maximal exercise
two variables that can have a significant impact on intensity seen in competition leads to greater sweat rates
performance when working at high intensities. However, compared to moderate or low intensity exercise [9]. Sweat
contrary to what was expected, day two (pre-competition) rates from the present study are similar to what have been
only three participants arrived with a significant dehydration demonstrated in other high-intensity sports. Cross Country
and USG indices improved from 1.0217 ± 0.0056 on day 1 to runners have exhibited a daily mean sweat rate of 1.77 ± 0.4
1.0147 ± 0,0052 on day 2, a significant change (p=0.039). L/h, soccer players’ sweat rates during games have been
These results indicate that CrossFit athletes may have better shown to range from 1.2 L/h to 1.67L/h, and basketball
hydration behaviors to replenish fluids in multiple day players competing indoors have exhibited 1.6 L/h fluid
events. loss [8]. Given that sweat rates during competition can
Interestingly, 20% of participants increased hydration reach 2% body weight loss per hour, which negatively
levels between workouts on the first day. While food impacts performance [3], some hydration strategies are
and fluid intake were not tracked between workouts, the recommended to prepare for lengthier WODs. Given the
authors believe that such findings are likely explained by findings of this study, the primary focus would be on
non-regulatory fluid ingestion. This type of fluid ingestion is pre-competition hydration, athletes should drink 5-7mL/kg
not meant to quench thirst but as components of everyday per body weight at least 4 h before exercise [20]. During
living. Foods and beverages like pre-workout and lengthier WODs is recommended that athletes match the
post-workout recovery drinks consumed during the rest fluid intake with fluid loss [3], thus, a fluid intake of 300ml
period between competition heats contribute to the higher for every 15 min may be ideal given the sweat rates.
fluid intake [18]. The primary limitation to this study came in the form of
There is evidence that athletes who participate in a series a global pandemic, which was obviously unexpected and
of events over multiple days do not replenish the fluid lost limited the ability to recruit the necessary participants to
during previous days [4,7]. For this reason, authors expected power such a study and generalize findings to a broader
participants to arrive on day two with equal or worse population. However, some of the results from the data
hydration indices. Unanticipated, the hydration indices collected in the mock competition provide a glance at
improved significantly (p = 0.039), with 60% of participants hydration status of CrossFit athletes and can be built upon
arriving well hydrated (USG30 Jorge L. Ceja et al.: Sweat Rates and Hydration in CrossFit Athletes
influence hydration status and performance. Also, further and humid environment. Br J Sports Med 39(4): 205-211,
research should look to collect sweat loss data from the 2005.
warm-up period, together with observation and collection of [9] Holmes N, Bates G, Zhao Y, Sherriff J, & Miller V. The
food and fluid intake in between workouts. Future research effect of exercise intensity on sweat rate and sweat sodium
should also examine hydration relative to gender differences, and potassium losses in trained endurance athletes. Ann
as the current study could not find any notable statistical Sports Med Res, 3(2): 1063-1067, 2016.
differences from the data due to the low number of [10] Judelson AD, Maresh CM, Anderson JM, Armstrong LE,
participants. Casa DJ, Kramer WJ, & Volek JF. Hydration and muscular
The results from this study reiterate that CrossFit performance: Does fluid balance affect strength power and
athletes do not drink enough water and therefore arrive to high-intensity endurance? Sports Med, 37(10): 907-921,
2007.
mock competitive events in a state of dehydration, which is
likely to impair performance. However, one of the most [11] Judelson AD, Maresh CM, Yamamoto LM, Farrell MJ,
interesting findings of the study was the improvement in Armstrong LE, Kraemer WJ, Volek JS,… & Anderson JM.
pre-competition hydration markers from day one to day two. Effect of dehydration state on resistance exercise-induced
endocrine markers of anabolism, catabolism, and metabolism.
The sweat rates from the current research are higher, but J Appl Physiol 105(3): 816-824, 2008.
not significantly different from previous research about this
population. It is the hope of the authors that such results [12] Kenton W. Fundamental analysis. 2019. Retrieved from
will inform the practice of coaches and athletes alike to https://www.investopedia.com/terms/t/t- test.asp.
create hydration strategies that could improve CrossFit [13] Manore, M, Meyer NL, & Thompson, J. Sport nutrition for
performance and athlete health. health and performance (2nd ed.). Champaign, IL: Human
Kinetics, 2000.
[14] Navalta JW, Stone WJ, Lyons TS. Ethical issues relating to
scientific discovery in exercise science. Int J Exerc Sci 12(1):
1-8, 2019.
REFERENCES
[15] McDermott BP, Casa DJ, Yeargin SW, Ganio MS, Lopez RM,
[1] Aldiridge G, Baker JS, & Davies B. Effects of hydration & Mooradian EA. (2009). Hydration status, sweat rates, and
status on aerobic performance for a group of male university rehydration education of youth football campers. J Sport
rugby players. J Exerc Physiol Online, 8(5): 36-42, 2005. Rehabil 18(4): 535-552, 2009.
[2] Baker BL. Sweat testing methodology in the field: Challenges [16] Osterberg KL, Horswill CA, & Baker LB. Pregame urine
and best practices. Sports Sci Exchange, 28(161): 1-6, 2017. specific gravity and fluid intake by national basketball
association players during competition. J Athl Train 44(1):
[3] Casa DJ, Armstrong LE., Hillman SK, Montain SJ, Reiff RV, 53-57, 2009.
Rich BSE, Stone JA. National athletic trainers’ association
position statement: Fluid replacement for athletes. J Athl [17] Pallares JG, Martinez AA, Lopez GJ, Moran NV, De la Cruz
Train, 35(2): 212-224, 2000. E, & Mora RR. Muscle contraction velocity, strength and
power outputs changes following different degrees of
[4] Chapelle L, Tassignon B, Aerenhouts D, Mullie P, & Clarys P. hypohydration in competitive Olympic combat sports. J Int
The hydration status of young female elite soccer players Soc Sports Nutr, 13(10): 1-9, 2016.
during an official tournament. J Sports Med Phys Fitness
57(9): 1186-94, 2017. [18] Popkin BM, D’Anci KE, & Rosenberg IH, (2011). Water,
Hydration and Health. Nutr Rev, 68(8): 439-458, 2011.
[5] Cronin CC, Miller BL, Simpson JD, Boman SM, Green JM,
Allen JAH, & O’Neil EK. Natural training hydration status, [19] Sawka MN, Noakes TD. Does dehydration impair exercise
sweat rates, and perception of sweat losses during CrossFit performance? Med Sci Sports Exerc, 39(8): 1209-1217, 2007.
training. Int J Exerc Sci 9(5): 576-586, 2016.
[20] Sawka MN, Burke LM, Eichner RE, Maughan RJ, Montain
[6] Faul, F., Erdfelder, E., Buchner, A., & Lang, A.-G. (2009). SJ, & Stachenfeld NS. Exercise and fluid replacement.
Statistical power analyses using G*Power 3.1: Tests for American College of Sports Medicine, 39(2): 377-390, 2007.
correlation and regression analyses. Behav Res Methods
41(4): 1149-1160, 2009. [21] Steven T, & Gonzales-Alonso J. New insights into the
impact of dehydration on blood flow and metabolism during
[7] Finn JP, Wood RJ. (2004). Incidence of pre-game exercise. Exerc Sport Sci Rev 45(3): 146-153, 2017.
dehydration in athletes competing in an international event in https://emergefitness.com/blogs/fit/evolution- of-crossfit.
dry tropical conditions. Nutr Diet 61(4): 221-225, 2004.
[22] Volpe SL, Poule KA, & Bland EG. Estimation of pre-practice
[8] Godek SF, Bartolozzi AR, & Godek JJ. Sweat rates and fluid hydration status of national collegiate athletic association
turnover in American football compared with runners in a hot division 1 athletes. J Ath Train 44(6): 624-629, 2009.
Copyright © 2021 The Author(s). Published by Scientific & Academic Publishing
This work is licensed under the Creative Commons Attribution International License (CC BY). http://creativecommons.org/licenses/by/4.0/You can also read