The ANTARES Collaboration: 31st International Cosmic Ray Conference (ICRC 2009)
←
→
Page content transcription
If your browser does not render page correctly, please read the page content below
PROCEEDINGS OF THE 31st ICRC, ŁÓDŹ 2009                                                                         1

                                                               The ANTARES Collaboration:
                                                                              contributions to the
                                                                st
                                                             31 International Cosmic Ray Conference (ICRC 2009),
arXiv:1002.0701v1 [astro-ph.HE] 3 Feb 2010

                                                                                 Lodz, Poland,
                                                                                   July 2009

                                              Abstract The Antares neutrino telescope, operating at 2.5 km depth in the Mediterranean Sea, 40 km off the
                                             Toulon shore, represents the world’s largest operational underwater neutrino telescope, optimized for the detection
                                              of Cerenkov light produced by neutrino-induced muons. The main goal of Antares is the search of high energy
                                               neutrinos from astrophysical point or transient sources. Antares is taking data in its full 12 lines configuration
                                                  since May 2008: in this paper we collect the 16 contributions by the ANTARES collaboration that were
                                             submitted to the 31th International Cosmic Ray Conference ICRC 2009. These contributions includes the detector
                                                 performances, the first preliminary results on neutrino events and the current physics analysis including the
                                                sensitivity to point like sources, the possibility to detect high energy neutrinos in coincidence with GRB, the
                                                                                    search for dark matter or exotic particles.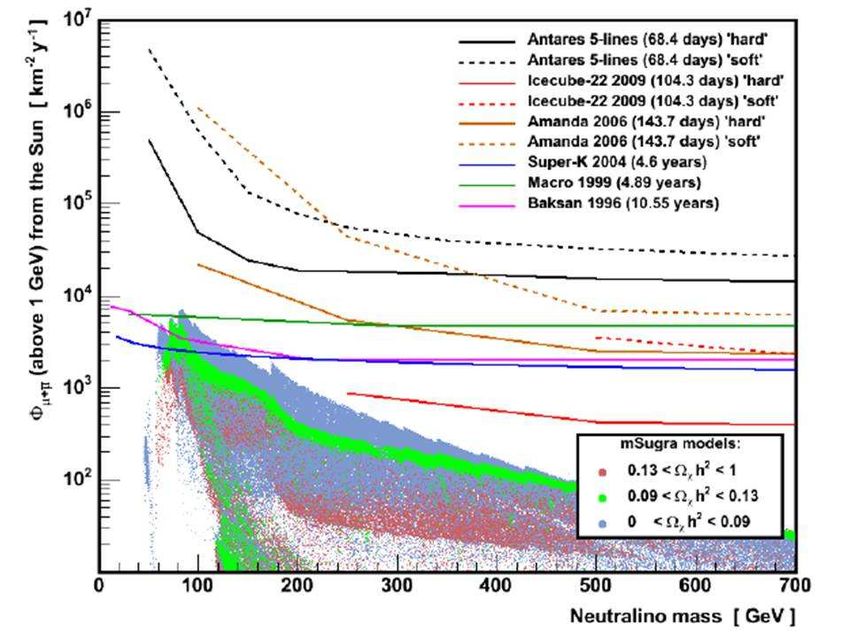
2                                                                                            THE ANTARES COLLABORATION

                                                ANTARES Collaboration

  J.A. Aguilar1 , I. Al Samarai2 , A. Albert3 , M. Anghinolfi4 , G. Anton5 , S. Anvar6 , M.
Ardid7 , A.C. Assis Jesus8 , T. Astraatmadja8, a , J.J. Aubert2 , R. Auer5 , B. Baret9 , S. Basa10 ,
M. Bazzotti11, 12 , V. Bertin2 , S. Biagi11, 12 , C. Bigongiari1 , M. Bou-Cabo7 , M.C. Bouwhuis8 ,
A. Brown2 , J. Brunner2, b , J. Busto2 , F. Camarena7 , A. Capone13, 14 , C.Cârloganu15 , G.
Carminati11, 12 , J. Carr2 , E. Castorina16, 17 , V. Cavasinni16, 17 , S. Cecchini12, 18 , Ph. Charvis19 , T.
Chiarusi12 , N. Chon Sen3 , M. Circella20 , H. Costantini4 , N. Cottini21 , P. Coyle2 , C. Curtil2 , G.
De Bonis13, 14 , I. Dekeyser22 , A. Deschamps19 , C. Distefano23 , C. Donzaud9, 24 , D. Dornic2, 1 , D.
Drouhin3 , T. Eberl5 , U. Emanuele1 , J.P. Ernenwein2 , S. Escoffier2 , F. Fehr5 , V. Flaminio16, 17 ,
U. Fritsch5 , J.L. Fuda22 , P. Gay15 , G. Giacomelli11, 12 , J.P. Gómez-González1 , K. Graf5 , G.
Guillard25 , G. Halladjian2 , G. Hallewell2 , H. van Haren26 , A.J. Heijboer8 , Y. Hello19 , J.J.
Hernández-Rey1 , B. Herold5 , J. Hößl5 , M. de Jong8, a , N. Kalantar-Nayestanaki27 , O. Kalekin5 ,
A. Kappes5 , U. Katz5 , P. Kooijman8, 28, 29 , C. Kopper5 , A. Kouchner9 , W. Kretschmer5 , R.
Lahmann5 , P. Lamare6 , G. Lambard2 , G. Larosa7 , H. Laschinsky5 , D. Lefèvre22 , G. Lelaizant2 ,
G. Lim8, 29 , D. Lo Presti30 , H. Loehner27 , S. Loucatos21 , F. Lucarelli13, 14 , S. Mangano1 ,
M. Marcelin10 , A. Margiotta11, 12 , J.A. Martinez-Mora7 , A. Mazure10 , T. Montaruli20, 31 , M.
Morganti16, 17 , L. Moscoso21, 9 , H. Motz5 , C. Naumann21 , M. Neff5 , R. Ostasch5 , D. Palioselitis8 ,
G.E.Păvălaş32 , P. Payre2 , J. Petrovic8 , P. Piattelli23 , N. Picot-Clemente2 , C. Picq21 , V. Popa32 ,
T. Pradier25 , E. Presani8 , C. Racca3 , A. Radu32 , C. Reed2, 8 , G. Riccobene23 , C. Richardt5 , M.
Rujoiu32 , G.V. Russo30 , F. Salesa1 , P. Sapienza23 , F. Schoeck5 , J.P. Schuller21 , R. Shanidze5 , F.
Simeone13, 14 , M. Spurio11, 12 , J.J.M. Steijger8 , Th. Stolarczyk21 , M. Taiuti33, 4 , C. Tamburini22 ,
L. Tasca10 , S. Toscano1 , B. Vallage21 , V. Van Elewyck 9 , G. Vannoni21 , M. Vecchi13 , P. Vernin21 ,
G. Wijnker8 , E. de Wolf8, 29 , H. Yepes1 , D. Zaborov34 , J.D. Zornoza1 , J. Zúñiga1 .
    1
     IFIC - Instituto de Fı́sica Corpuscular, Edificios Investigación de Paterna, CSIC - Universitat de València, Apdo. de Correos
22085, 46071 Valencia, Spain
2
  CPPM - Centre de Physique des Particules de Marseille, CNRS/IN2P3 et Université de la Méditerranée, 163 Avenue de
Luminy, Case 902, 13288 Marseille Cedex 9, France
3
  GRPHE - Institut universitaire de technologie de Colmar, 34 rue du Grillenbreit BP 50568 - 68008 Colmar, France
4
  INFN - Sezione di Genova, Via Dodecaneso 33, 16146 Genova, Italy
5
  Friedrich-Alexander-Universität Erlangen-Nürnberg, Erlangen Centre for Astroparticle Physics, Erwin-Rommel-Str. 1, D-91058
Erlangen, Germany
6
  Direction des Sciences de la Matière - Institut de recherche sur les lois fondamentales de l’Univers - Service d’Electronique
des Détecteurs et d’Informatique, CEA Saclay, 91191 Gif-sur-Yvette Cedex, France
7
  Institut d’Investigació per a la Gestió Integrada de Zones Costaneres (IGIC) - Universitat Politècnica de València. C/ Paranimf,
1. E-46730 Gandia, Spain.
8
  FOM Instituut voor Subatomaire Fysica Nikhef, Science Park 105, 1098 XG Amsterdam, The Netherlands
9
  APC - Laboratoire AstroParticule et Cosmologie, UMR 7164 (CNRS, Université Paris 7 Diderot, CEA, Observatoire de Paris)
10, rue Alice Domon et Léonie Duquet 75205 Paris Cedex 13, France
10
   LAM - Laboratoire d ’ Astrophysique de Marseille, Pôle de l’Étoile Site de Château-Gombert, rue Frédéric Joliot-Curie 38,
13388 Marseille cedex 13, France
11
   Dipartimento di Fisica dell’Università, Viale Berti Pichat 6/2, 40127 Bologna, Italy
12
   INFN - Sezione di Bologna, Viale Berti Pichat 6/2, 40127 Bologna, Italy
13
   Dipartimento di Fisica dell’Università La Sapienza, P.le Aldo Moro 2, 00185 Roma, Italy
14
   INFN -Sezione di Roma, P.le Aldo Moro 2, 00185 Roma, Italy
15
   Laboratoire de Physique Corpusculaire, IN2P3-CNRS, Université Blaise Pascal, Clermont-Ferrand, France
16
   Dipartimento di Fisica dell’Università, Largo B. Pontecorvo 3, 56127 Pisa, Italy
17
   INFN - Sezione di Pisa, Largo B. Pontecorvo 3, 56127 Pisa, Italy
18
   INAF-IASF, via P. Gobetti 101, 40129 Bologna, Italy
19
   Géoazur - Université de Nice Sophia-Antipolis, CNRS/INSU, IRD, Observatoire de la Côte dAzur and Université Pierre et
Marie Curie F-06235, BP 48, Villefranche-sur-mer, France
20
   INFN - Sezione di Bari, Via E. Orabona 4, 70126 Bari, Italy
21
   Direction des Sciences de la Matière - Institut de recherche sur les lois fondamentales de l’Univers - Service de Physique
des Particules, CEA Saclay, 91191 Gif-sur-Yvette Cedex, France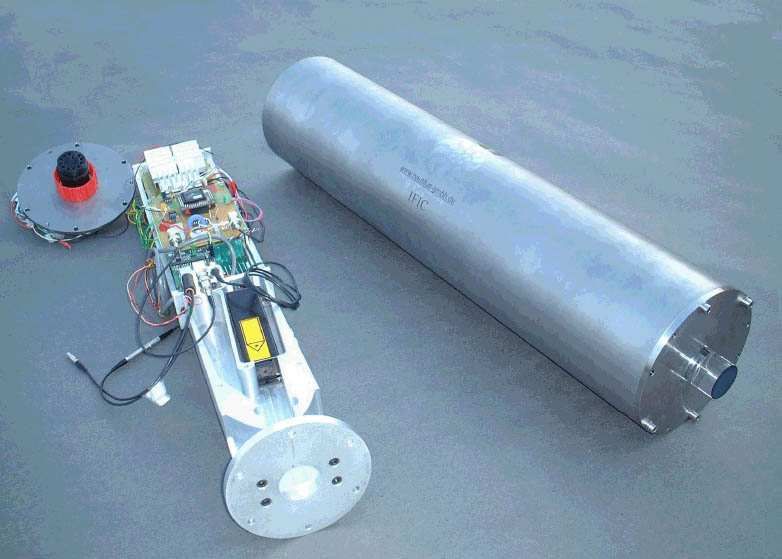
PROCEEDINGS OF THE 31st ICRC, ŁÓDŹ 2009                                                                               3

22
   COM - Centre dOcéanologie de Marseille, CNRS/INSU et Université de la Méditerranée, 163 Avenue de Luminy, Case 901,
13288 Marseille Cedex 9, France
23
   INFN - Laboratori Nazionali del Sud (LNS), Via S. Sofia 62, 95123 Catania, Italy
24
   Université Paris-Sud 11 - Département de Physique - F - 91403 Orsay Cedex, France
25
   IPHC-Institut Pluridisciplinaire Hubert Curien - Université de Strasbourg et CNRS/IN2P3 23 rue du Loess -BP 28- F67037
Strasbourg Cedex 2
26
   Royal Netherlands Institute for Sea Research (NIOZ), Landsdiep 4,1797 SZ ’t Horntje (Texel), The Netherlands
27
   Kernfysisch Versneller Instituut (KVI), University of Groningen, Zernikelaan 25, 9747 AA Groningen, The Netherlands
28
   Universiteit Utrecht, Faculteit Betawetenschappen, Princetonplein 5, 3584 CC Utrecht, The Netherlands
29
   Universiteit van Amsterdam, Instituut voor Hoge-Energie Fysika, Science Park 105, 1098 XG Amsterdam, The Netherlands
30
   Dipartimento di Fisica ed Astronomia dell’Università, Viale Andrea Doria 6, 95125 Catania, Italy
31
   University of Wisconsin - Madison, 53715, WI, USA
32
   Institute for Space Sciences, R-77125 Bucharest, Măgurele, Romania
33
   Dipartimento di Fisica dell’Università, Via Dodecaneso 33, 16146 Genova, Italy
34
   ITEP - Institute for Theoretical and Experimental Physics, B. Cheremushkinskaya 25, 117218 Moscow, Russia
4                                                                             THE ANTARES COLLABORATION

                                             Table of Contents
Status Report
    1) Paschal Coyle on Behalf of the ANTARES Collaboration, ”The ANTARES Deep-Sea Neutrino Telescope:
       Status and First Results.”, pages 5-12.
Detector Operation
    1) Bruny Baret on behalf of the ANTARES Collaboration, ”Charge Calibration of the ANTARES high energy
       neutrino telescope.”, pages 13-17.
    2) Mieke Bouwhuis on behalf of the ANTARES collaboration, ”Concepts and performance of the ANTARES
       data acquisition system”, pages 18-21.
    3) Anthony M Brown on behalf of the ANTARES Collaboration ”Positioning system of the ANTARES Neutrino
       Telescope”, pages 21-24.
    4) Juan Pablo Gómez-González on behalf of the ANTARES Collaboration ”Timing Calibration of the ANTARES
       Neutrino Telescope”, pages 25-28.
Reconstruction
    1) Marco Bazzotti on the behalf of the ANTARES coll., ”Measurement of the atmospheric muon flux with the
       ANTARES detector”, pages 29-32.
    2) Aart Heijboer, for the ANTARES collaboration, ”Reconstruction of Atmospheric Neutrinos in Antares”, pages
       33-37.
Physics Analyses
    1) Mieke Bouwhuis on behalf of the ANTARES collaboration, ”Search for gamma-ray bursts with the ANTARES
       neutrino telescope”, pages 38-41.
    2) Damien Dornic, Stéphane Basa, Jurgen Brunner, Imen Al Samarai, José Busto, Alain Klotz, Stéphanie
       Escoffier, Vincent Bertin, Bertrand Vallage, Bruce Gendre, Alain Mazure and Michel Boer on behalf the
       ANTARES and TAROT Collaboration, ”Search for neutrinos from transient sources with the ANTARES
       telescope and optical follow-up observations”, pages 42-44.
    3) Goulven Guillard, for the A NTARES Collaboration ”Gamma ray astronomy with ANTARES”, pages 45-48.
    4) G.M.A. Lim on behalf of the ANTARES collaboration ”First results on the search for dark matter in the
       Sun with the ANTARES neutrino telescope”, page s 49-52.
    5) Salvatore Mangano, for the ANTARES collaboration, ”Skymap for atmospheric muons at TeV energies
       measured in deep-sea neutrino telescope ANTARES”, pa ges 53-55.
    6) Gabriela Pavalas and Nicolas Picot Clemente, on behalf of the ANTARES Collaboration, ”Search for Exotic
       Physics with the ANTARES Detector”, pages 56-60.
    7) Francesco Simeone, on behalf of the ANTARES Collaboration. ”Underwater acoustic detection of UHE
       neutrinos with the ANTARES experiment”, pages 61-64
    8) Simona Toscano, for the ANTARES Collaboration ”Point source searches with the ANTARES neutrino
       telescope”, pages 65-68
    9) Véronique Van Elewyck for the ANTARES Collaboration, ”Searching for high-energy neutrinos in coinci-
       dence with gravitational waves with the ANTARES and VIRGO/LIGO detectors”, pages 69-72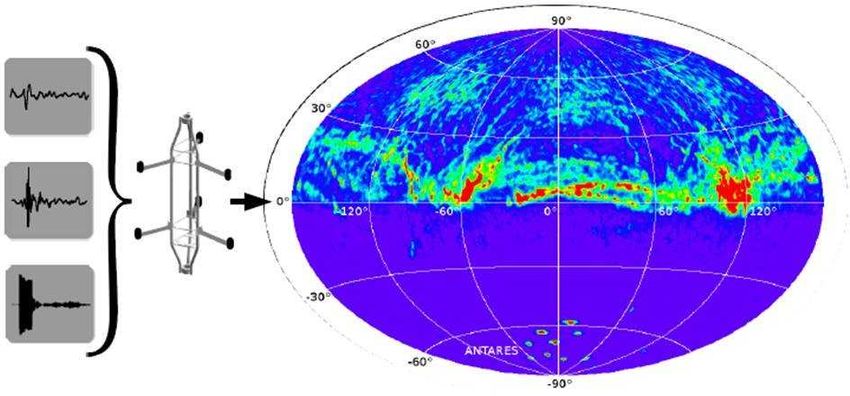
PROCEEDINGS OF THE 31st ICRC, ŁÓDŹ 2009                                                                              5

                  The ANTARES Deep-Sea Neutrino Telescope:
                          Status and First Results
                                              Paschal Coyle ∗
                                  On Behalf of the ANTARES Collaboration

                                                 ∗
                                                 coyle@cppm.in2p3.fr
                                    Centre de Physique des Particules de Marseille
                                          163 Avenue de Luminy, Case 902,
                                          13288 Marseille cedex 09, France

  Abstract. Various aspects of the construction, op-
eration and calibration of the recently completed
deep-sea ANTARES neutrino telescope are described.
Some first results obtained with a partial five line
configuration are presented, including depth depen-
dence of the atmospheric muon rate, the search for
point-like cosmic neutrino sources and the search for
dark matter annihilation in the Sun.
  Keywords: ANTARES, neutrino, point source, dark
matter

                    I. I NTRODUCTION
   The undisputed galactic origin of cosmic rays at             Fig. 1: The layout of the completed ANTARES detector.
energies below the so-called knee implies an existence          The top insert shows an image of an acoustic storey with
of a non-thermal population of galactic sources which           its six acoustic sensors and the lower insert an image of
effectively accelerate protons and nuclei to TeV-PeV            an optical storey with its three photomultipliers.
energies. The distinct signatures of these cosmic ac-
celerators are high energy neutrinos and gamma rays
produced through hadronic interactions with ambient
                                                                           II. T HE ANTARES D ETECTOR
gas or photoproduction on intense photon fields near
the source. While gamma rays can be produced also                  The ANTARES detector is located at a depth of
by directly accelerated electrons, high-energy neutrinos        2475 m in the Mediterranean Sea, 42 km from La Seyne-
provide unambiguous and unique information on the               sur-Mer in the South of France (42◦ 48N, 6◦ 10E). A
sites of the cosmic accelerators and hadronic nature of         schematic of the detector layout is shown in Figure 1.
the accelerated particles.                                      It is equipped with 885 optical sensors arranged on 12
   ANTARES (http://antares.in2p3.fr/) is a deep-sea neu-        flexible lines. Each line comprises up to 25 detection
trino telescope, designed for the detection of all flavours     storeys each equipped with three downward-looking 10-
of high-energy neutrinos emitted by both Galactic (su-          inch photo-multipliers (PMTs), orientated at 45◦ to the
pernova remnants, micro-quasars etc.) and extragalactic         line axis. The lines are maintained vertical by a buoy at
(gamma ray bursters, active galactic nuclei, etc.) as-          the top of the 450 m long line. The spacing between
trophysical sources. The telescope is also sensitive to         storeys in 14.5 m and the lines are spaced by 60-
neutrinos produced via dark matter annihilation within          70 m. An acoustic positioning system provides real-time
massive bodies such as the Sun and the Earth. Other             location of the detector elements to a precision of a few
physics topics include measurement of neutrino oscil-           centimeters. A system of optical beacons allows in-situ
lation parameters, the search for magnetic monopoles,           time calibration. The first detection line was installed
nuclearites etc.                                                in 2006. Five lines have been operating since March
   The recently completed ANTARES detector is cur-              2007. Ten lines were operational in December 2007.
rently the most sensitive neutrino observatory studying         With the installation of eleventh and twelfth lines in
the southern hemisphere and includes the particularly in-       May 2008, the detector construction was completed. An
teresting region of the Galactic Centre in its field of view.   additional line (IL07) contains an ensemble of oceano-
ANTARES is also a unique deep-sea marine observatory            graphic sensors dedicated measurement of the environ-
providing continuous, high-bandwidth monitoring from            mental parameters. The twelfth line and the IL07 also
a variety of sensors dedicated to acoustic, oceanographic       includes hydrophone-only storeys dedicated to the study
and Earth science studies.                                      of the ambient acoustic backgrounds; R&D for possible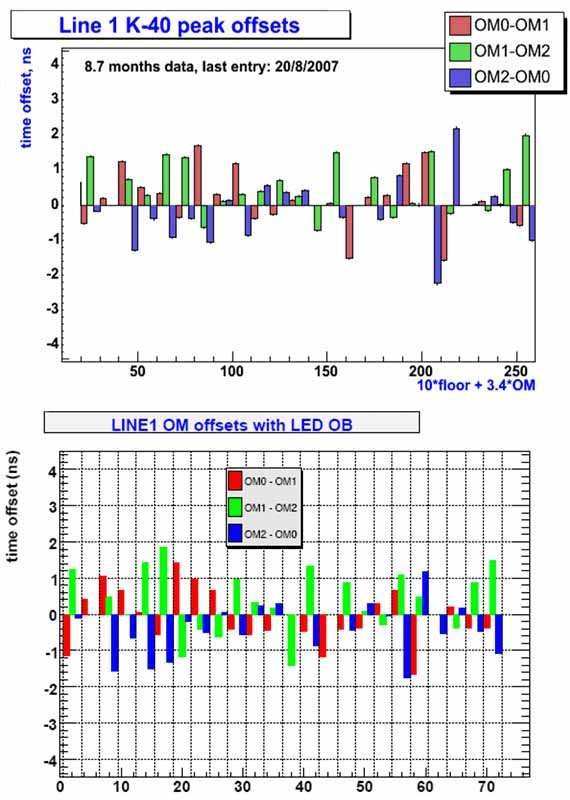
6                                                             P. COYLE et al. ANTARES STATUS AND FIRST RESULTS

acoustic detection of ultra-high energy neutrinos.
   The ANTARES Collaboration currently comprises 29
particle physics, astrophysics and sea science institutes
from seven countries (France, Germany, Italy, Nether-
lands, Romania, Russia and Spain).
   The three-dimensional grid of photomultiplier tubes
is used to measure the arrival time and position of
Cherenkov photons induced by the passage of relativistic
charged particles through the sea water. The reconstruc-
tion algorithm relies on the characteristic emission angle
of the light (about 43 degrees) to determine the direction
of the muon and hence infer that of the incident neutrino.
The accuracy of the direction information allows to
distinguish upward-going muons, produced by neutrinos,
from the overwhelming background from downward-
going muons, produced by cosmic ray interaction in the
                                                              Fig. 2: The horizontal movements relative to the bottom
atmosphere above the detector. Installing the detector
                                                              of the line, of all hydrophones on Line 11 for a 6 month
at great depths serves to attenuate this background and
                                                              period; black points is the hydrophone on Storey 1, red
also allows to operate the PMTs in a completely dark
                                                              is on Storey 8, blue is on Storey 14, green is on Storey
environment.
                                                              22 and magenta is on Storey 25.
   At high energies the large range of the muon allows
the sensitive volume of the detector to be significantly
greater than the instrumented volume. Although opti-          tion. For neutrino energies above 10 TeV the angular
mised for muon neutrino detection, the detector is also       resolution is determined by the intrinisic detector res-
sensitive to the electron and tau neutrinos albeit it with    olution i.e. the timing resolution and accuracy of the
reduced effective area.                                       location of the PMTs. The energy measurement relies
   The total ANTARES sky coverage is 3.5πsr, with an          on an accurate calibration of the charge detected by each
instantaneous overlap of 0.5πsr with that of the Icecube      PMT [3].
experiment at the South Pole. Together ANTARES and
Icecube provide complete coverage of the high-energy          A. Acoustic Positioning
neutrino sky. Compared to detectors based in ice, a              The positions of the PMTs are measured every two
water based telescope benefits from a better angular          minutes with a high-frequency long-baseline acoustic
resolution, due to the absence of light scattering on dust    positioning system comprising fixed acoustic emitters-
and/or bubbles trapped in the ice. On the other hand,         receivers at the bottom of each line and acoustic re-
it suffers from additional background light produced by       ceivers distributed along a line [4]. After triangulation
beta decay of 40 K salt present in the sea water as well as   of the positions of the moving hydrophones, the shape
bioluminescent light produced by biological organisms.        of each line is reconstructed by a global fit based on
Furthermore, the continual movement of the detector           a model of the physical properties of the line and
lines, in reaction to the changing direction and intensity    additional information from the tiltmeters and compass
of the deep-sea currents, must be measured and taken          sensors located on each storey. The relative positions
into account in the track reconstruction.                     of the PMTs are deduced from this reconstructed line
   The ANTARES data acquistion [1] is based on the            shape and the known geometry of a storey. The system
’all-data-to-shore’ concept, in which all hits above a        provides a statistical precision of a few mm. The final
threshold of 0.3 single photon-electrons are digitised and    precision on the PMT locations is a few cm, smaller
transmitted to shore. Onshore a farm of commodity PCs         than the physical extension of the PMTs, and is limited
apply a trigger based on requiring the presence of a 4-5      by the systematic uncertainties on the knowledge of the
causally connected local coincidences between pairs of        speed of sound in the sea water.
PMTs within a storey. The typical trigger rate is 5-10 Hz,       Figure 2 shows the movements of various storeys
dominated by downgoing muons. In addition, an external        on a line, relative to its centre axis. The extent of the
trigger generated by the gamma-ray bursts coordinates         displacement depends on the intensity of the sea current.
network (GCN) will cause all the buffered raw data (two       For typical currents of a few centimetres per second, the
minutes) to be stored on disk. This offers the potential      displacement is a few metres for the topmost storeys.
to apply looser triggers offline on this subset of the data
[2].                                                          B. Time Calibration
                                                                 The relative time calibration of ANTARES is per-
            III. D ETECTOR C ALIBRATION                       formed via a number of independent and redundant
  The precision on the neutrino direction is limited at       systems [5]. The master clock system features a method
low energies by the kinematics of the neutrino interac-       to measure the transit time of the clock signals to the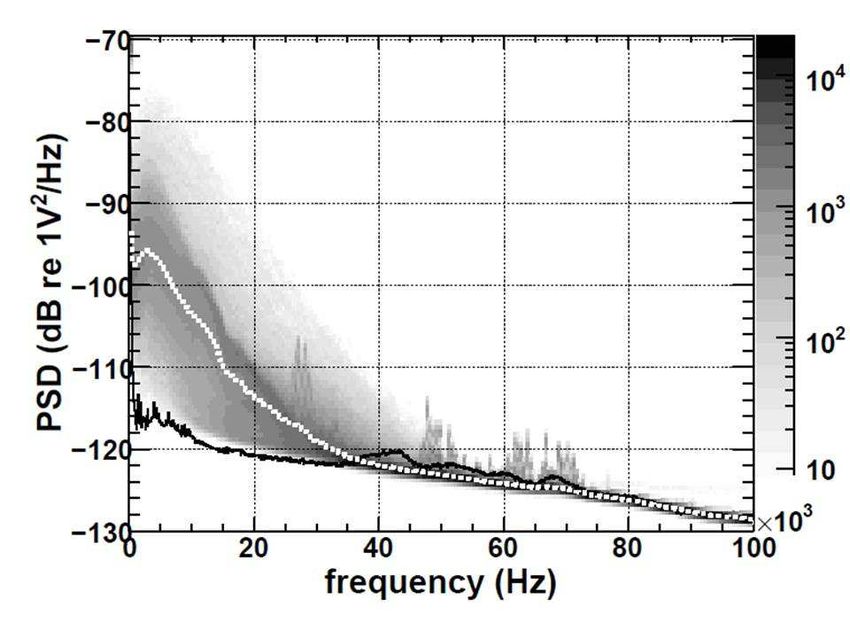
PROCEEDINGS OF THE 31st ICRC, ŁÓDŹ 2009 7
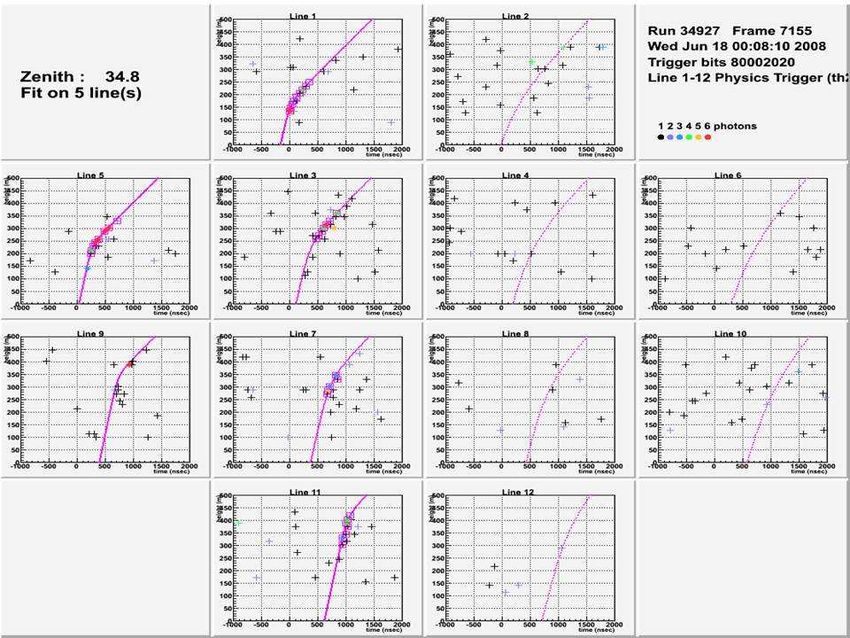
Fig. 3: Conicidence peak due to 40 K decays for a single Fig. 4: Time offsets for all photomultipliers as extracted
pair of photomultipliers in one storey. using the LED beacons and independently checked by
the K40 conicidence method.
electronics located in each storey of the detector. The
determination of the remaining residual time offsets
within a storey, due to the delays in the front-end
electronics and transit time of the PMTs, are based on
the detection of signals from external optical beacons
distributed throughout the detector. The presence of 40 K
in the sea water also provides a convenient source of
calibrated light which is used to verify the time offsets
between the triplet of PMTs within a storey as well as
study the long term stablity of the PMTs efficiencies.
Every fifth storey of a line contains an optical beacon
emitting in the blue. Each beacon illuminates the neigh-
bouring storeys on its line. Comparison of the arrival Fig. 5: Example display of a neutrino candidate. The
hit times within a storey provides the relative inter- 2D plots, one for each line, show on the y axis the
storey time offsets. Intra-storey time offsets can also be vertical position of the PMT with a hit and on the x
established after corrections are applied for time walk axis the arrival time of the hit. The fit to the arrival time
and ’first photon’ effects. distribution corresponds to the chi-square algorithm.
Potassium-40 is a radioactive isotope naturally present
in the sea water. The decay 40 K → e− νe40 Ca yields an
electron with an energy up to 1.3 MeV. This energy integral under the peak of Figure 3 and is used to monitor
exceeds the Cherenkov threshold for electrons in water the relative efficiencies of all PMTs and their temporal
(0.26 MeV), and is sufficient to produce up to 150 stability.
Cherenkov photons. If the decay occurs in the vincinity
of a detector storey, a coincident signal may be recorded IV. M UON R ECONSTRUCTION
by pairs of PMTs on the storey. In Figure 3 the distri- Two alternative algorithms for reconstruction of the
bution of the measured time difference between hits in muon trajectories have been developed [6]. In the first
neighbouring PMTs of the same storey is shown. The approach, a simple chi-square fit is applied to a high
peak around 0 ns is mainly due to single 40 K decays purity sample of pre-selected hits. In addition, this
producing coincident signals. The fit of the data is the algorithm merges the hits observed by the PMTs of
sum of a Gaussian distribution and a flat background. the triplet and assumes that they are located on the
The full width at half maximum of the Gaussian function line axis, i.e. the azimuthal orientation of the storey,
is about 9 ns. This width is mainly due to the spatial measured by the compasses, is ignored. In Figure 5 an
distribution of the 40 K decays around the storey. The upgoing neutrino candidate fitted using this algorithm
positions of the peaks of the time distributions for is shown. This algorithm was initially adopted as a
different pairs of PMTs in the same storey are used to fast reconstruction for online monitoring of the detector.
cross-check the time offsets computed by the optical Although it provides an non-optimum angular resolution
beacon system. This is illustrated in Figure 3 which (typically 1-2 degrees above 10 TeV) it has been used
shows a comparision of the time offsets calculated by the in a number of analyses for which the ultimate angular
optical beacons and that extracted from the 40 K analysis; resolution is not crucial.
an rms of 0.6 ns is obtained. In the second approach a full maximum likelihood
The rate of genuine 40 K coincidences is given by the fit is applied, which uses a detailed parameterisation,
8                                                           P. COYLE et al. ANTARES STATUS AND FIRST RESULTS

Fig. 6: Attenuation of the flux of muons as a function of
depth, as extracted using the adjacent storey coincidence
method. The shaded band represents the systematic           Fig. 7: Vertical depth intensity relation of atmospheric
uncertainties due to detector effects. Predictions from     muons with Eµ > 20 GeV (black points). The error
MUPAGE and Corsika Monte Carlo simulations are also         band represents systematic uncertainties. A compliation
shown.                                                      of data from other experiments are also shown.

derived from simulation, of the probability density
function for the track residuals. The fit includes most
hits in the event and the PDF takes into account the
probability that photons arrive late due to Cherenkov
emission by secondary particles or light scattering. A
number of increasingly sophisticated prefits are used
to aid in the location of the correct maxima of the
likelihood. This algorithm makes use of the maximum         Fig. 8: Identification of energetic electromagnetic show-
amount of information, including the line shape and         ers: (left) Data and Monte Carlo comparison of the
storey orientation, and provides an angular resolution      number of reconstructed electromagnetic showers for the
better than 0.3 degrees above 10 TeV.                       5-line data, assuming the nominal primary cosmic-ray
              V. ATMOSPHERIC M UONS                         composition. (right) dependence on primary cosmic-ray
                                                            composition (proton versus iron).
   The dominant signal observed by ANTARES is due
to the passage of downgoing atmospheric muons, whose
flux exceeds that of neutrino-induced muons by several
orders of magnitude. They are produced by high energy       [8]. Taking into account the known angular distribution
cosmic rays interacting with atomic nuclei of the upper     of the incident muons, a depth intensity relation can
atmosphere, producing charged pions and kaons, which        be extracted (Figure 7). The results ae in reasonable
subsequently decay into muons. Although an important        agreement with previous measurements.
background for neutrino detection, they are useful to          The composition of the primary cosmic rays in the
verify the detector response. In particular, with three     knee region is of particular interest. As the number of
years of data taking, a deficit in the muon flux in         identified electromagnetic showers in an event depends
the direction of the moon should allow an important         on the muon energy and the number of muons present
verification of the pointing accuracy of the detector.      in a muon bundle, it is sensitive to the primary cosmic
   Two different studies of the vertical depth intensity    ray composition. An algorithm has been developed to
relation of the muon flux have been performed. In the       estimate the number of energetic electromagnetic (EM)
first, the attenuation of the muon flux as a function       showers generated along the muon trajectory [9]. This
of depth is observed as a reduction in the rate of          algorithm relies on the fact that the emission point of
coincidences between adjacent storeys along the length      Cherenkov photons from the muon are uniformly dis-
of the detection lines [7]. This method has the advantage   tributed along the muon trajectory whereas Cherenkov
that it does not rely on any track reconstruction. In       photons orginating from an electromagnetic shower will
Figure 6 the depth dependence of the extracted flux for     tend to cluster from a single point. The efficiency and
the 24 inter-storey measurements averaged over all lines    purity of the algorithm to identify a shower depends on
is shown.                                                   the shower energy, for example the efficiency to identify
   In the second study, a full track reconstruction is      a 1 TeV shower is 20% with a purity of 85%. In Figure
performed and the reconstructed zenith angle is con-        8 (left) the distribution of the number of reconstructed
verted to an equivalent slant depth through the sea water   energetic showers per event in the 5-line data is shown.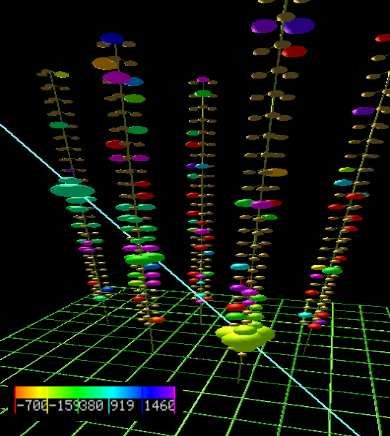
PROCEEDINGS OF THE 31st ICRC, ŁÓDŹ 2009                                                                                     9

                                                               Source name         δ (◦ )   RA (◦ )   nbin.   p-value   φ90
                                                               PSR B1259-63       -63.83    195.70      0        -      3.1
                                                               RCW 86             -62.48    220.68      0        -      3.3
                                                               HESS J1023-575     -57.76    155.83      1      0.004    7.6
                                                               CIR X-1            -57.17    230.17      0        -      3.3
                                                               HESS J1614-518     -51.82    243.58      1      0.088    5.6
                                                               GX 339             -48.79    255.70      0        -      3.8
                                                               RX J0852.0-4622    -46.37    133.00      0        -      4.0
                                                               RX J1713.7-3946    -39.75    258.25      0        -      4.3
                                                               Galactic Centre    -29.01    266.42      1      0.055    6.8
                                                               W28                -23.34    270.43      0        -      4.8
                                                               LS 5039            -14.83    276.56      0        -      5.0
                                                               HESS J1837-069       -6.95   279.41      0        -      5.9
                                                               SS 433                4.98   287.96      0        -      7.3
                                                               HESS J0632+057        5.81    98.24      0        -      7.4
                                                               ESO 139-G12        -59.94    264.41      0        -      3.4
                                                               PKS 2005-489       -48.82    302.37      0        -      3.7
Fig. 9: Zenith distribution of reconstructed muons in the      Centaurus A        -43.02    201.36      0        -      3.9
2008 data. The Mone Carlo expectation for the atmo-            PKS 0548-322       -32.27     87.67      0        -      4.3
                                                               H 2356-309         -30.63    359.78      0        -      4.2
spheric muon and atmospheric neutrino backgrounds are          PKS 2155-304       -30.22    329.72      0        -      4.2
indicated.                                                     1ES 1101-232       -23.49    165.91      0        -      4.6
                                                               1ES 0347-121       -11.99     57.35      0        -      5.0
                                                               3C 279               -5.79   194.05      1      0.030    9.2
                                                               RGB J0152+017         1.79    28.17      0        -      7.0
                                                               IC22 hotspot        11.4     153.4       0        -      9.1

                                                              TABLE I: Results of the search for cosmic neutrinos corre-
                                                              lated with potential neutrino sources. The sources are divided
                                                              into three groups: galactic (top), extra-galactic (middle) and
                                                              the hotspot from IceCube with 22 lines (bottom). The source
                                                              name and location in equatorial coordinates are shown together
                                                              with the number of events within the optimum cone for the
                                                              binned search, the p-value of the unbinned method (when
                                                              different from 1) and the corresponding upper limit at 90%
                                                              C.L. φ90 is the value of the normalization constant of the
                                                              differential muon-neutrino flux assuming an E −2 spectrum
                                                              (i.e. E 2 dφνµ /dE ≤ φ90 × 10−10 TeV cm−2 s−1 ). The
                                                              integration energy range is 10 GeV - 1 PeV.
Fig. 10: Sky map, in geocentric coordinates, of the
upgoing neutrino candidates for the 2007 data.
                                                                 For a subset of this data (the 5-line data of 2007)
                                                              the angular resolution has been improved by applying
Good agreement with the Corsika Monte Carlo is ob-
                                                              the pdf based track reconstruction, which makes full use
tained when the 22Horandel primary composition model
                                                              of the final detector alignment. After reoptimisation of
is assumed. In Figure 8 (right) the data distribution is
                                                              the selection cuts for the best upper limits, 94 upgoing
compared with that obtained assuming a pure proton or
                                                              neutrino candidates are selected [12]. The corresponding
a pure iron primary cosmic ray composition.
                                                              sky map for these events is shown in Figure 10. An
   A search for a large-scale anistropy in the arrival
                                                              all sky search, independent of assumption on the source
directions of the atmospheric muons has been performed
                                                              location, has been performed on these data. The most
but with the current statistics is not yet sensitive to the
                                                              significant cluster was found at (δ = −63.7◦ , RA =
0.1% level variations reported by other experiments [10].
                                                              243.9◦ ) with a corresponding p-value of 0.3 (1σ excess)
The possibilty for detection of gamma ray induced air
                                                              and is therefore not significant.
showers with ANTARES is also under evaluation [11].
                                                                 A search amongst a pre-defined list of 24 of the most
                                                              promising galactic and extra-galactic neutrino sources
    VI. S EARCH FOR C OSMIC N EUTRINO P OINT
                                                              (supernova remnants, BL Lac objects, Icecube hot spot,
                   S OURCES
                                                              etc.) is reported in Table I. The lowest p-value obtained
   The muons produced by the interaction of neutrinos         (a 2.8σ excess, pre-trial) corresponds to the location
can be isolated from the muons generated by the cosmic        (δ = −57.76◦ , RA = 155.8◦ ). Such a probablity
ray interactions by requiring that the muon trajectory is     or higher would be expected in 10% of background-
reconstructed as up-going. In Figure 9 the zenith angular     only experiments and is therefore not significant. The
distribution of muons in the 2007+2008 data sample by         corresponding flux upper limits, assuming an E −2 flux,
the χ2 reconstruction algorithm is shown. A total of 750      are plotted in Figure 11 and compared to published upper
mulitline up-going neutrinos candidates are found, in         limits from other experiments. Also shown in Figure 11
good agreement with expectations from the atmospheric         is the predicted upper limit for ANTARES after one full
neutrino background.                                          year of twelve line operation.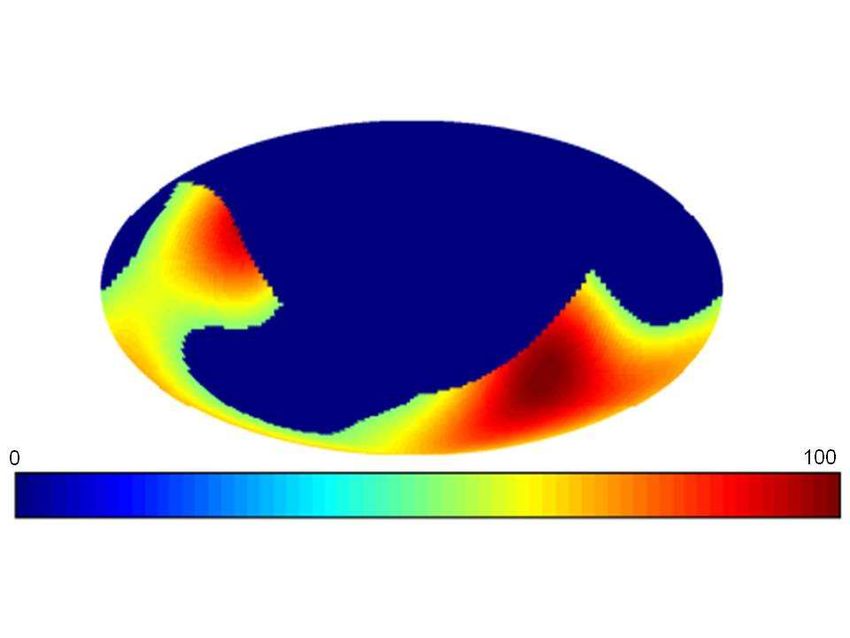
10 P. COYLE et al. ANTARES STATUS AND FIRST RESULTS
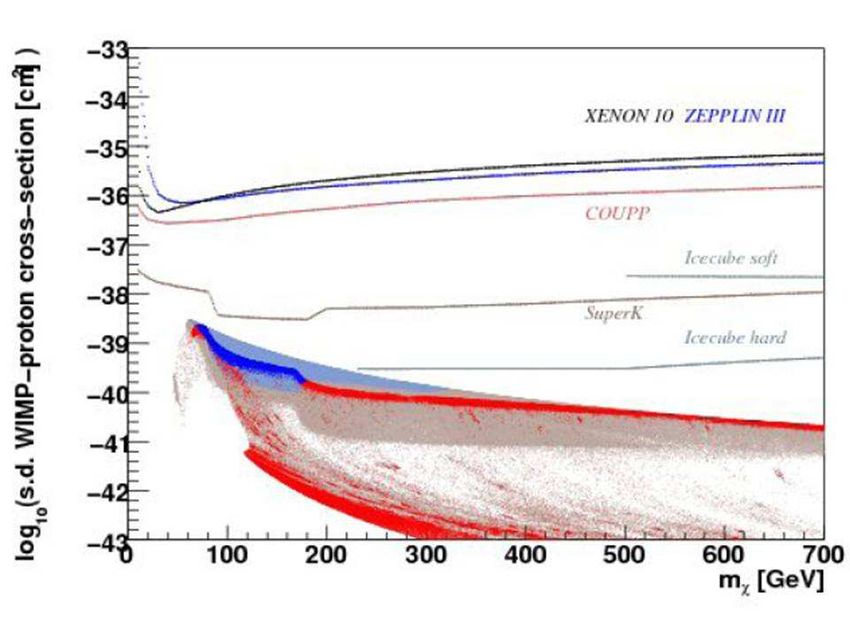
Fig. 13: The spin dependent WIMP-proton cross-section
versus neutralino mass in the mSUGRA model. The
Fig. 11: Neutrino flux upper limits at 90% C.L. ob- points are the results of the scan over the range of
tained by this analysis (solid squares), compared with model parameters. The points in blue would be excluded
published results from other experiments (IceCube [24], at 90% CL after three years of ANTARES operation.
AMANDA [25], SuperKamiokande [26] and MACRO Existing upper limits from a variety of direct and indirect
[27]). The expected sensitivity of ANTARES for one direction experiments are shown.
year with twelve lines is also shown (solid line). The
source spectrum assumed in these results is E 2 , except
for MACRO, for which an E 2.1 spectrum was used.
stable and is the WIMP candidate. In order to predict
the expected solar neutrino fluxes the constrained phe-
nomenological framework of the minimal Supergravity
model (mSUGRA, computations using ISASUGRA[5])
has been adopted. Figure 10 shows the predicted in-
tegrated neutrino fluxes above 10 GeV in ANTARES
as a function of neutralino mass for the scan of the
model parameters: scalar mass m0 in [0,8000] GeV,
gaugino mass m1/2 in [0,2000] GeV, tri-linear scalar
coupling A0 in [−3m0 , 3m0 ], sign of the Higgsino
mixing parameter: µ > 0, ratio of Higgs fields vacuum
expectation values tanβ in [0,60], mtop = 172.5 GeV .
The local Dark Matter halo density (NFW-model) was
set to 0.3 GeV /cm3 . The most favourable models for
Fig. 12: Upper limit on the muon flux from the Sun as neutrino telescopes are in the so-called focus point
a function of neutralino mass. The expected fluxes for region, for which the decays are mainly via W + W −
a scan of mSUGRA parameters is shown as well as a leading to a harder neutrino spectra. Thanks to its low-
variety of limits from other experiments. energy threshold ANTARES is ideally suited to address
low-mass neutralino scenarios.
A search for neutrinos from the direction of the Sun
VII. S EARCH FOR DARK M ATTER in the 5-line data [13], showed no excess with respect
In many theoretical models a Weakly Interacting to background expectations. The corresponding derived
Massive Particle (WIMP), a relic from the Big Bang, limit on the neutrino flux is shown in Figure 12. Also
is proposed to explain the formation of structure in shown is the expected limit with 5 years of data taking
the universe and the discrepancy observed between the with the full 12-line detector; a large fraction of the focus
measured rotation curves of stars and the associated point region could be excluded.
visible matter distribution in galaxies. A generic property Due to the capture of the WIMPs inside the Sun,
of such WIMPs is that they gravitationally accumulate which is mainly hydrogen, neutrino telescopes are par-
at the centre of massive bodies such as the Sun or the ticularly sensitive to the spin-dependent coupling of
Earth, where they can self annihilate into normal matter. the WIMPs to standard matter. In Figure 13 the cor-
Only neutrinos, resulting from the decay of this matter, responding limit on the spin-dependent WIMP-proton
can escape from the body and be detected by a neutrino cross-section after three years of ANTARES operation
telescope. is shown. For this case, the neutrino telescopes are
Within Supersymmetric models with R-parity con- significantly more sensitive than the direct direction
servation, the lightest supersymmetric particle (LSP) is experiments.PROCEEDINGS OF THE 31st ICRC, ŁÓDŹ 2009 11
Fig. 14: Common sky coverage for Fig. 15: Power spectral density (PSD) of the ambient
VIRGO/LIGO/ANTARES in geocentric coordinates. noise recorded with one sensor. Shown in grey shades
This map shows the combined antenna pattern for of grey is the occurence rate in arbirary units, where dark
the gravitational wave detector network (above half- colours indicate higher occurence. Shown as a white
minimum), assuming that ANTARES has 100% dotted line is the mean value of the in-situ PSD and as a
visibility in its antipodal hemisphere and 0% elsewhere. black solid line the noise level recorded in the laboratory
before deployment.
VIII. M ULTI -M ESSENGER A STRONOMY
In order to augment the discovery potential of
ANTARES, a program of collaboration with other types
of observatory have been established. In this ”multi-
messenger” approach the detection threshold can be
lowered in each separate experiment while preserving an
acceptable rate of accidental coincidences. One example
of such a program is being pursued with the gravi-
tational wave detectors VIRGO and LIGO [14]. Both Fig. 16: Map of the angular directions of the detected
of these detectors had a data-taking phase during 2007 transient acoustic signals at the ANTARES site.
(VIRGO science run 1 and LIGO S5) which partially
coincided with the ANTARES 5-line configuration. A
new common science run has also recently started in typical sensitivities around 1V/µPa. The sensors are
coincidence with the ANTARES 12-line operation. The distributed in six ”acoustic clusters”, each comprising six
common sky coverage for ANTARES-VIRGO+LIGO is acoustic sensors that are arranged at distances roughly
signifcant and is shown in Figure 14. 1 m from each other. The clusters are installed along
In a similar vein, a collaboration with the TAROT the line 1 and the IL07 line at a horizontal distance of
optical telescopes has been established [15]. The di- 240 m. The vertical spacing within a line range from
rections of interesting neutrino triggers (two neutrinos 15 m to 125 m (see Figure 1).
within 3 degrees within a time window of 15 minutes In Figure 15 is shown the measured power spec-
or a single neutrino of very high energy) are sent to the tral density of the ambient noise recorded with an
Chile telescope in order that a series of optical follow acoustic sensor. Due to wind generated surface noise,
up images can be taken. This procedure is well suited the observed noise level is larger than that measured
to maximise the sensitivity for transient events such as in the laboratory. Strong correlation of the measured
gamma ray bursters or flaring sources. acoustic noise with the measured surface wind speed
are observed.
IX. ACOUSTIC D ETECTION In Figure 16 an acoustic ”sea map” of all transient (not
Due to the large attenuation length, ≈ 5 km for just bipolar) signals detected by the apparatus during
10 kHz signals, the detection of bipolar acoustic pressure a one month period is shown. The acoustic pinger of
pulses in huge underwater acoustic arrays is a possible the ANTARES positioning system are clearly identified
approach for the identification of cosmic neutrinos with in the lower hemisphere. The acoustic activity in the
energies exceeding 100 PeV. To this end, the ANTARES upper hemisphere is presumably due to surface boats
infrastructure incorporates the AMADEUS system, an and possibly marine mammals.
R&D project intended to evaluate the acoustical back-
X. C ONCLUSION
grounds in the deep sea [16]. It comprises a set of piezo-
electric sensors for broad-band recording of acoustic After more than a decade of R&D and prototyping the
signals with frequencies ranging up to 125 kHz with construction of ANTARES, the first operating deep-sea12 P. COYLE et al. ANTARES STATUS AND FIRST RESULTS
neutrino telescope has been completed. Since the deploy- R EFERENCES
ment of the first line in 2006, data taking has proceeded [1] M. Bouwhuis, Concepts and performance of the Antares data
essentially continuously. During this time the methods acquisition system, ICRC2009, arXiv:0908.0811.
and procedures to calibrate such a novel detector have [2] M. Bouwhuis, Search for gamma-ray bursts with the Antares
neutrino telescope, ICRC2009, arXiv:0908.0818.
been developed, including in-situ time calibration with [3] B. Baret, Charge Calibration of the ANTARES high energy
optical beacons and acoustic positioning of the detector neutrino telescope, ICRC2009, arXiv:0908.0810.
elements with acoustic hydrophones. The presence of the [4] A. Brown, Positioning system of the ANTARES Neutrino Tele-
40 scope, ICRC2009, arXiv:0908.0814.
K in the sea water has proven particularly useful for [5] P. Gomez, Timing Calibration of the ANTARES Neutrino Tele-
monitoring the stability of the time calibration as well scope, ICRC2009, arXiv:0911.3052.
as the detector efficiency. [6] A. Heijboer, Reconstruction of Atmospheric Neutrinos in
Antares, ICRC2009, arXiv:0908.0816.
Based on data from the intermediate 5-line configu- [7] D. Zaborov, Coincidence analysis in ANTARES: Potassium-
ration, a number of preliminary analyses have been pre- 40 and muons, 43rd Rencontres de Moriond on Electroweak
sented; measurements of the atmospheric muon vertical Interactions and Unified Theories, La Thuile, Italy, 1-8 Mar 2008,
arXiv:0812.4886
depth intensity relation, a search for cosmic neutrino [8] M. Bazzotti, Measurement of the atmospheric muon flux with the
point sources in the southern sky, and a search for dark ANTARES detector, ICRC2009, arXiv:0911.3055.
matter annihilation in the Sun. For the latter two analyses [9] M. Mangano, Algorithm for muon electromagnetic shower
reconstruction, Nucl. Instrum. Meth. A588:107-110, 2008,
no significant signal was observed and competitive upper arXiv:0711.3158.
limits have been obtained. [10] M. Mangano, Skymap for atmospheric muons at TeV energies
The succesful operation of ANTARES, and analysis measured in deep-sea neutrino telescope ANTARES, ICRC2009,
arXiv:0908.0858.
of its data, is an important step towards KM3NET [17], [11] G. Guillard, Gamma ray astronomy with Antares, ICRC2009,
a future km3 -scale high-energy neutrino observatory and arXiv:0908.0855.
marine sciences infrastructure planned for construction [12] S. Toscano, Point source searches with the ANTARES neutrino
telescope, ICRC2009, arXiv:0908.0864.
in the Mediterranean Sea. [13] G. Lim, First results on the search for dark matter in the Sun with
the ANTARES neutrino telescope, ICRC2009, arXiv:0905.2316.
[14] V. Elewyck, Searching for high-energy neutrinos in coincidence
with gravitational waves with the ANTARES and VIRGO/LIGO
detectors, ICRC2009, arXiv:0908.2454.
[15] D. Dornic, Search for neutrinos from transient sources with
the ANTARES telescope and optical follow-up observations,
ICRC2009, arXiv:0908.0804.
[16] M. Simeone, Underwater acoustic detection of UHE neutrinos
with the ANTARES experiment, ICRC2009, arXiv:0908.0862.
[17] J. P. Ernenwein, Status of the KM3NeT project, this conference,
ICRC2009.PROCEEDINGS OF THE 31st ICRC, ŁÓDŹ 2009 13
Charge Calibration of the ANTARES high energy neutrino
telescope.
Bruny Baret∗ on behalf of the ANTARES Collaboration†
∗ Laboratoire
AstroParticle and Cosmology
10, rue A. Domon et L. Duquet, 75205 Paris Cedex 13, France.
† http://antares.in2p3.fr
Abstract. ANTARES is a deep-sea, large volume bed and kept close to vertical position by a top buoy.
mediterranean neutrino telescope installed off the The minimum distance between two lines ranges from
Coast of Toulon, France. It is taking data in its 60 to 80 m. Each detection line is composed by 25
complete configuration since May 2008 with nearly storeys, each equipped with 3 photomultipliers oriented
900 photomultipliers installed on 12 lines. It is downward at 45◦ with respect to the vertical. The storeys
today the largest high energy neutrino telescope of are spaced by 14.5 m, the lowest one being located
the northern hemisphere. The charge calibration about 100 m above the seabed. From the functional
and threshold tuning of the photomultipliers and point of view, each line is divided into 5 sectors, each
their associated front-end electronics is of primary of which consists typically of 5 storeys. Each storey is
importance. It indeed enables to translate signal controlled by a Local Control Module (LCM), and each
amplitudes into number of photo-electrons which sector is provided with a modified LCM, the Master
is the relevant information for track and energy Local Control Module (MLCM), which controls the data
reconstruction. It has therefore a strong impact on communications between its sector and the shore. A
physics analysis. We will present the performances String Control Module (SCM), located at the basis of
of the front-end chip, so-called ARS, including the each line, interfaces the line to the rest of the apparatus.
waveform mode of acquisition. The in-laboratory as Each of these modules consists of an aluminum frame,
well as regularly performed in situ calibrations will which holds all electronics boards connected through
be presented together with related studies like the a backplane and is enclosed in a water-tight titanium
time evolution of the gain of photomultipliers cylinder.
Keywords: neutrino telescope, front-end electronics,
calibration. III. T HE FRONT- END ELECTRONICS
The full-custom Analogue Ring Sampler (ARS) has
I. I NTRODUCTION been developed to perform the complex front-end opera-
ANTARES is an underwater neutrino telescope in- tions [3].This chip samples the PMT signal continuously
stalled at a depth of 2475 m in the Mediterranean Sea. at a tunable frequency up to 1 GHz and holds the
The site is at about 40 km off the coast of Toulon, analogue information on 128 switched capacitors when
France. The control station is installed in Institut Michel a threshold level is crossed. The information is then
Pacha in La Seyne Sur Mer, close to Toulon. The appa- digitized, in response to a trigger signal, by means
ratus consists of an array of 900 photo-multiplier tubes of two integrated dual 8- bit ADC. Optionally the
(PMTs) by which the faint light pulses emitted by rel- dynamic range may be increased by sampling the signal
ativistic charged particles propagating in the water may from the last dynode. A 20 MHz reference clock is
be detected. Based on such measurements, ANTARES used for time stamping the signals. A Time to Voltage
is capable of identifying neutrinos of atmospheric as Converter (TVC) device is used for high-resolution time
well as of astrophysical origin. In addition, the detector measurements between clock pulses. The ARS is also
is a monitoring station for geophysics and sea science capable of discriminating between simple pulses due to
investigations. For an introduction to the scientific aims conversion of single photoelectrons (SPE) from more
of the ANTARES experiment, the reader is referred to complex waveforms. The criteria used to discriminate
the dedicated presentation at this Conference [1]. between the two classes are based on the amplitude of
the signal, the time above threshold and the occurrence
II. T HE ANTARES APPARATUS of multiple peaks within a time gate. Only the charge
The detector consists of an array of 900 large area and time information is recorded for SPE events, while a
photomultipliers (PMTs), Hamamatsu R7081-20, en- full waveform analysis is performed for all other events.
closed in pressure-resistant glass spheres to constitute The ARS chips are arranged on a motherboard to serve
the optical modules (OMs)[2], and arranged on 12 the optical modules. Two ARS chips, in a “token ring”
detection lines. An additional line is equipped with configuration, perform the charge and time information
environmental devices. Each line is anchored to the sea of a single PMT. A third chip provided on each board14 BARET et al. ANTARES CHARGE CALIBRATION
(a)
Fig. 1: ARS architecture
Fig. 2: Distribution of the slope (in mV/bit) of the ADC Fig. 3: Distribution of the intercept (in mV) of the ADC
transfer function transfer function
LCM_1029 ARS_1 hAVC_1029_1
is used for triggering purposes. The settings of each Entries 13896
Hits
Mean 57.83
1800
individual chip can be remotely configured from the RMS 3.104
1600
shore. 2
χ / ndf 1097 / 34
794 ± 844.5
1400 Peak
Offset 51.98 ± 0.02
IV. T EST BENCH CALIBRATION 1200 Slope −50.38 ± 42.69
1000 Constant 1793 ± 16.8
The bare ARSs were calibrated at IRFU-CEA/Saclay. Center 57.87 ± 0.00
800
There, the transfer functions of the Amplitude to Voltage Sigma −2.571 ± 0.000
600
Converter (AVC) have been measured. This AVC trans-
400
fer function is an important parameter for the correction
200
of the walk of the PMT signal and also for measurement
0 20 30 40 50 60 70 80 90 100
of the amplitude of each PMT pulse. The principal AVC
component of this bench is a pulse generator which
Fig. 4: Example of AVC distribution of photoelectron
directly sends signals to a pair of ARSs operating in
like data with the corresponding fit (see text).
a flip-flop mode. The generated pulse is a triangle with
4 ns rise time and 14 ns fall, somewhat similar to the
electrical pulse of a PMT with variable amplitude. The
tranfer functions of the dynamic range of the ADCs are pedestal value of the AVC channel. Besides, the pho-
linear and parametrised by their slope and intercept. The toelectron peak can easily be studied with minimum
distributions of these two parameters for a large sample bias events since the optical activity due the 40 K decays
of ARS chips are presented on figure 2 and 3 and one and bioluminescent bacteria produces, on average, single
can see that they are homogeous which enables to use photons at the photocathode level. The knowledge of the
the same parameters for all ARSs. photoelectron peak and the pedestal is used to estimate
the charge over the full dynamical range of the ADC.
V. I N S ITU CALIBRATION The integral linearity of the ADC used in the ARS chip
Specials runs reading the PMT current at random has independently been studied using the TVC channel
times allow to measure the corresponding so-called and shows satisfactory results [4]. An example of in situPROCEEDINGS OF THE 31st ICRC, ŁÓDŹ 2009 15
Fig. 5: Example of the observed cross talk effect form
the time measurement channel affecting the charge mea- Fig. 6: Charge distribution in pe recorded by the detector.
surement channel.
ADC count
240
235
charge distribution for a particular ARS is shown on
230
figure 4. The values in AVC channel of the pedestal
225
and the photoelectron peak are used to convert indi-
220
vidual measurements into photoelectron units. Charge
215
distributions obtained with minimum bias data (based
210
on snapshot of the overall activity of an optical module 205
above a given threshold) can be parameterized using the 200
following simple formula: 0 20 40 60 80 100 120
Sampling cells (1.56 ns/bin)
−(x−xpe )2
Ae−α(x−xth ) + Be 2σ 2 (1) Fig. 7: Example of a waveform sampling of an OM
The first term accounts for the dark current of the signal
PMT, the second one describes the photoelectron dis-
tribution itself. The parameters xth and xpe are respec-
Entries
tively the effective thresholds (“offset”) and photoelec- 6000
tron peak (“center”) in AVC units. 5000
The charge measurements in the AVC channels appear
4000
to be influenced by the time measurements in the TVC
channel (the inverse effect does not apply). This effect, 3000
referred to as “cross talk effect” can be, considering the 2000
current settings of the ARS, on an event-by-event basis 1000
as high as 0.2 pe. It is thought to be due to a cross talk
0
of the capacitors inside the ARS pipeline. It is a linear 0 0.5 1 1.5 2 2.5 3 3.5 4
Number of SPE
effect that does not require correction on high statistics
basis (when hits populate the full range of the TVC, the Fig. 8: Charge distribution of the PMT signal obtained
effect washes out). Nevertheless a correction has to be by integrating the WF samples
applied to the measured charge of a single event. This
correction can be inferred with in situ measurements at
the level of the photoelectron by plotting the AVC value digitisations of the OM anode signal are provided, at a
against the TVC value as can be seen in figure 5. After sampling rate of 640 MHz. In order to obtain a precise
calibration including cross talk correction, minimum bias time stamping of the WF data, a synchronous sampling
events recorded by the detector, coming predominantly of the 50 MHz internal ARS clock is also performed
from 40 K decay and bioluminescence are dominated by and read out in addition to the OM data. An example
single photo-electron charges as is shown on figure 6 of a WF record is shown in figure 7. Figure 8 displays
the charge distribution of the OM signals obtained by
The ARS has also the capability to perform a full integrating the WF samples after baseline subtraction.
waveform sampling (WF) of the OM signal in addition The single photo-electron peak is clearly identified well
to the charge measurement of the PMT pulse and its above the electronics noise.
arrival time. Although this functionality is mainly used When the time over threshold of a pulse is too short,
to record double pulses or large amplitude signals, it is the ARS chip cannot properly generate the time stamp
useful to cross-check the computation of the SPE charge (TS) of the event, which remains null. This happens
by the integrator circuit of the ARS. In WF mode, 128 when the hit amplitude is just above the amplitude16 BARET et al. ANTARES CHARGE CALIBRATION
40
Mean = 0.53
35
Sigma = 0.17
30
25
20
15
10
5
Fig. 9: Example of an effective threshold transfer func- 0
0.2 0.4 0.6 0.8 1 1.2
tion of an ARS obtained with TS=0 events. Threshold (in PE units)
Fig. 11: Distributions of the effective thresholds before
24 (12/2007) in situ tuning procedure.
coincidence rate, Hz
22
20 Line 1
18
16 90
14 80 Mean = 0.35
70 Sigma = 0.06
12
60
10
50
8
40
6
30
4
20
2
10
0 31/12/06 02/04/07 02/07/07 01/10/07 01/01/08 01/04/08 01/07/08 01/10/08
0
0.2 0.4 0.6 0.8 1 1.2
date Threshold (in PE units)
Fig. 10: Time evolution of the counting rate due to Fig. 12: Distributions of the effective thresholds after
40
K desintegration measured with the first line of the (03/2008) in situ tuning procedure.
detector. Colours account for different threshold setting
periods.
period between july and september of 2008 when the
detector was off for cable repair, gain seems to be
threshold. The charge (AVC) and fine time of the events partially recovered when PMTs are off for some time.
(TVC) are recorded correctly. This specific behaviour Since all channels are tunned to have an effective
has negligible influence on efficiency but enables to threshold of 0.3 pe, one has to regularly check, and if
measure the effective threshold in AVC units for dif- necessary correct the value of the effective thresholds.
ferent DAC settings by selecting event with TS=0. For This is done thanks to the TS=0 events as explained
different slow control DAC values the mean AVC values earlier. The effect of this procedure can be seen on the
of events at the threshold are recorded during these effective threshold distribution on figure 11 and 12.
special calibration runs. The result of the linear fit of
VI. C ONCLUSIONS
the transfer function gives the intercept (DAC value for
null threshold) and slope. An example is shown on figure All the ARSs of the ANTARES neutrino telescope
9. have been calibrated prior to deployment in order to
This method can be applied to every readout ARS of the be able to translate the electrical signal from the chips
detector. There are therefore individual in situ calibration into number of photo-electrons which is the relevant
and transfer functions for each ARS. These monitored information for event recontruction and physics analysis.
values are stored in a dedicated database and used for Furthermore, in situ calibration procedures have been
further adjustments of the detector setting. In particular, developped and are regularly performed in order to
these effective calibrations are used to homogenize the monitor and control the detector response, especially to
individual thresholds to a value close to 1/3 pe. take into account PMTs gain evolution.
The desintegration of 40 K present in sea water can be VII. ACKNOWLEDGEMENT
used to monitor the evolution with time of the detector
This work was in part supported by the French ANR
response. Indeed, relativistic electrons produced by the
grant ANR-08-JCJC-0061-01.
β desintegration will produce Cerenkov photons which
can trigger two adjacent optical modules in the same R EFERENCES
storey. [1] P. Coyle, First Results from the ANTARES Deep-Sea Neutrino
As can be seen on figure 10, 40 K counting rate Telescope, Proc. of this Conference.
evolution with time have shown a regular decrease. This [2] P. Amram et al., The ANTARES optical module, Nucl. Instr. Meth.
in Phys. Res.,vol A 55, pp. 132, 2005.
PMTs gain drop effect is thought to be due to ageing [3] F. Feinstein, The analogue ring sampler: A front-end chip for
effect of the photocathode. As can be seen after the ANTARES, Nucl. Instrum. Meth., vol. A504, pp. 258, 2003.PROCEEDINGS OF THE 31st ICRC, ŁÓDŹ 2009 17
[4] J.-P. Gomez, Time calibration of the ANTARES neutrino tele-
scope, Proc. of this Conference.18 PROCEEDINGS OF THE 31st ICRC, ŁÓDŹ 2009
Concepts and performance of the ANTARES data acquisition
system
Mieke Bouwhuis∗ on behalf of the ANTARES collaboration
∗ National Institute for Subatomic Physics (Nikhef), Amsterdam, The Netherlands
Abstract. The data acquisition system of the the detector has a titanium cylinder which houses the
ANTARES neutrino telescope is based on the unique electronics for data acquisition and slow control. This
“all-data-to-shore” concept. In this, all signals from system is referred to as the local control module. In
the photo-multiplier tubes are digitised, and all dig- addition, each line has a line control module that is
ital data are sent to shore where they are processed located at the anchor.
in real time by a PC farm. This data acquisition Daylight does not penetrate to the depth of the
system showed excellent stability and flexibility since ANTARES site. Therefore the telescope can be operated
the detector became operational in March 2006. The day and night. But even in the absence of daylight, a
applied concept enables to operate different physics ubiquitous background luminosity is present in the deep-
triggers to the same data in parallel, each optimised sea due to the decay of radioactive isotopes (mainly 40 K)
for a specific (astro)physics signal. The list of triggers and to bioluminescence. This background luminosity
includes two general purpose muon triggers, a Galac- produces a relatively high count rate of random signals
tic Centre trigger, and a gamma-ray burst trigger. in the detector (60–150 kHz per PMT). This background
The performance of the data acquisition system is can be suppressed by applying the characteristic time-
evaluated by its operational efficiency and the data position correlations that correspond to a passing muon
filter capabilities. In addition, the efficiencies of the to the data.
different physics triggers are quantified.
Keywords: neutrino telescope; data acquisition sys- II. DATA ACQUISITION SYSTEM
tem; triggering The main purpose of the data acquisition (DAQ) sys-
tem is to convert the analogue pulses from the PMTs into
I. I NTRODUCTION a readable input for the off-line reconstruction software.
The ANTARES neutrino telescope is situated in the The DAQ system is based on the “all-data-to-shore”
Mediterranean Sea at a depth of about 2500 m, ap- concept [1]. In this, all signals from the PMTs that
proximately 40 km south east of the French town of pass a preset threshold (typically 0.3 photo-electrons)
Toulon. Neutrinos are detected through the detection of are digitised and all digital data are sent to shore where
Cherenkov light produced by the charged lepton that they are processed in real-time by a farm of commodity
emerges from a neutrino interaction in the vicinity of PCs.
the detector. Measurements are focused mainly on muon-
neutrinos, since the muon resulting from a neutrino inter- A. Network architecture
action can travel a distance of up to several kilometres. The network architecture of the off-shore DAQ sys-
Due to the transparency of the sea water (the absorption tem has a star topology. In this, the storeys in a line
length is about 50 m), the faint Cherenkov light can are organised into separate sectors, each consisting of
be detected at relatively large distances from the muon 5 storeys, and the detector lines are connected to a main
track. A large volume of sea water is turned into a junction box. The junction box is connected to a station
neutrino detector by deploying a 3-dimensional array of on shore via a single electro-optical cable. The network
light sensors in the water. consists of a pair of optical fibres for each detector line,
The ANTARES detector consists of thirteen lines, an 8 channel dense wavelength division [de-]multiplexer
each with up to 25 storeys. The storeys are connected (DWDM) in each line control module (200 GHz spac-
by cables which provide mechanical strength, electrical ing), a small Ethernet switch in each sector and a
contact and fibre-optic readout. Each line is held on the processor in each local control module. The Ethernet
seabed by a dead-weight anchor and kept vertical by switch in the sector consists of a combination of the
a buoy at the top of its 450 m length. Along eleven Allayer AL121 (eight 100 Mb/s ports) and the Allayer
lines, 25 storeys with three light sensors are placed at AL1022 (two Gb/s ports). One of the 100 Mb/s ports is
an inter-storey distance of 14.5 m starting 100 m above connected to the processor in the local control module
the seabed. On each storey three spherical glass pressure via its backplane (100Base–CX) and four are connected
vessels contain 10” Hamamatsu photo-multiplier tubes to the other local control modules in the same sector via
(PMTs), which are oriented with their axes pointing a bi-directional optical fibre (100Base–SX). One of the
downward at an angle of 45 degrees from the vertical. two Gb/s ports is connected to a DWDM transceiver
One line consists of 20 such storeys, and one line is (1000Base–CX). The DWDM transceiver is then 1–1
equipped with deep-sea instrumentation. Each storey in connected to an identical transceiver on shore using twoYou can also read