Measuring, understanding and adapting to nexus trade-offs in the Sekong, Sesan and Srepok Transboundary River Basins
←
→
Page content transcription
If your browser does not render page correctly, please read the page content below
Measuring, understanding and adapting to
nexus trade-offs in the Sekong, Sesan and
Srepok Transboundary River Basins
Jake Brunner, Jeremy Carew-Reid, Raphael Glemet
Matthew McCartney and Philip Riddell

INTERNATIONAL UNION FOR CONSERVATION OF NATURE
About IUCN

IUCN is a membership Union uniquely composed of both government and civil society organisations. It
provides public, private and non-governmental organisations with the knowledge and tools that enable
human progress, economic development and nature conservation to take place together.

Created in 1948, IUCN is now the world‘s largest and most diverse environmental network, harnessing the
knowledge, resources and reach of more than 1,300 Member organisations and some 13,000 experts. It is a
leading provider of conservation data, assessments and analysis. Its broad membership enables IUCN to fill
the role of incubator and trusted repository of best practices, tools and international standards.

IUCN provides a neutral space in which diverse stakeholders including governments, NGOs, scientists,
businesses, local communities, indigenous peoples organisations and others can work together to forge and
implement solutions to environmental challenges and achieve sustainable development.

Working with many partners and supporters, IUCN implements a large and diverse portfolio of conservation
projects worldwide. Combining the latest science with the traditional knowledge of local communities, these
projects work to reverse habitat loss, restore ecosystems and improve people‘s well-being.

www.iucn.org

https://twitter.com/IUCN/
Measuring, understanding and adapting to
nexus trade-offs in the Sekong, Sesan and
Srepok Transboundary River Basins
Jake Brunner, Jeremy Carew-Reid, Raphael Glemet,
Matthew McCartney and Philip Riddell
The designation of geographical entities in this Citation: Brunner, J., Carew-Reid, J., Glemet, R.,
report, and the presentation of the materials, do McCartney, M., and Riddell, P., (2019). Measuring,
not imply the expression of any opinion understanding and adapting to nexus trade-offs in
whatsoever on the part of IUCN or US State the Sekong, Sesan and Srepok Transboundary River
Department or Swiss Agency for Development Basins. Ha Noi, Viet Nam. IUCN: Viet Nam Country
and Cooperation (SDC) or the Building River Office. Viii + 70pp.
Dialogue and Governance programme (BRIDGE)
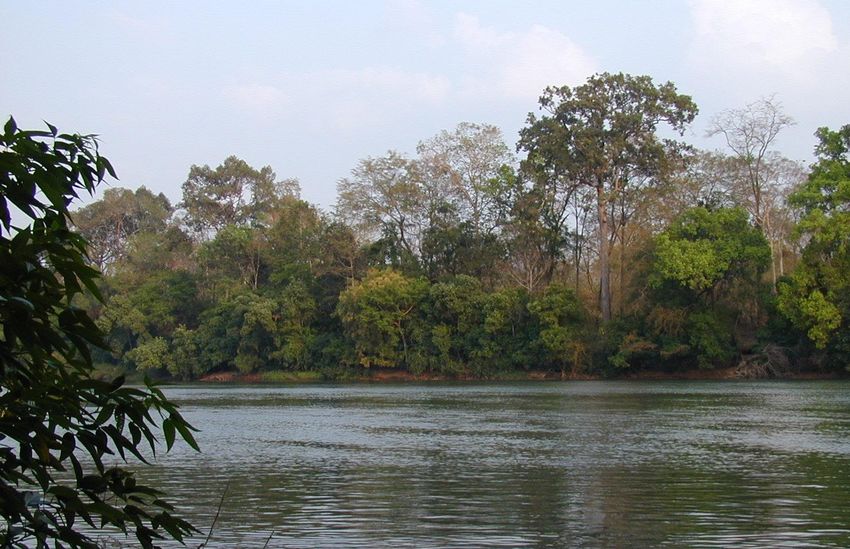
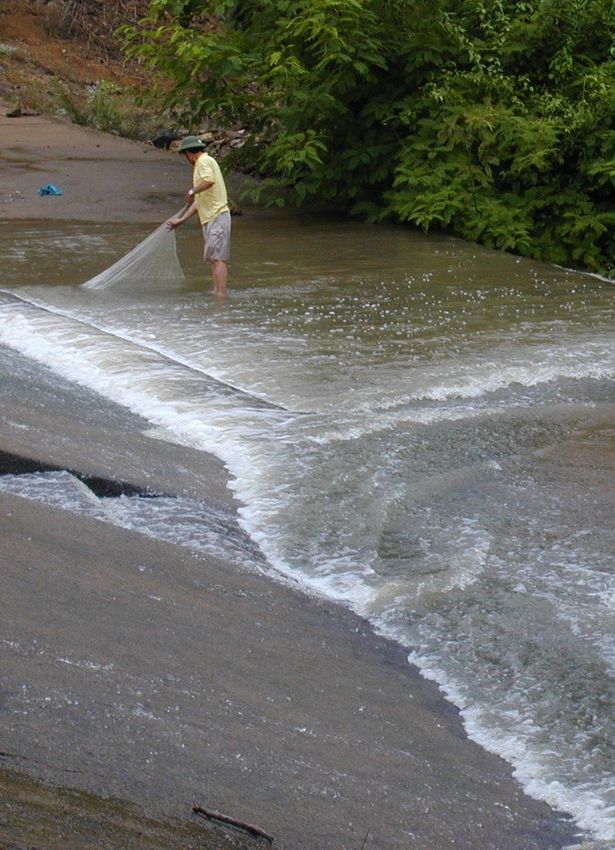
concerning the legal status of any country, Cover photo: Srepok river © Nguyen Duc Tu/IUCN
territory, or area, or of its authorities, or Viet Nam
concerning the delimitation of its frontiers or
boundaries. Back cover: A spillway in Srepok river © Nguyen Duc
Tu/IUCN Viet Nam
The views expressed in this publication do not
necessarily reflect those of IUCN, US State Layout by: Nguyen Thuy Anh
Department, SDC, BRIDGE or any other
participating organizations. Available from:
IUCN Viet Nam Country Office
Van Phuc Diplomatic Compound Area
This report has been made possible by funding 298 Kim Ma, Ba Dinh District
from US State Department, SDC, BRIDGE. Ha Noi, Viet Nam
Tel: +95 9 966 590 260
Published by: IUCN Viet Nam Country Office, Ha www.iucn.org/asia
Noi, Viet Nam
IUCN Asia Regional Office
63 Soi Prompong, Sukhumvit 39, Wattana 10110
Copyright: © 2019 IUCN, International Union for
Bangkok, Thailand
Conservation of Nature and Natural Resources Tel: +66 2 662 4029
www.iucn.org/asia
Reproduction of this report for educational or www.iucn.org/resources/publications
other non-commercial purposes is authorized
without prior written permission from the copyright
holder provided the source is fully acknowledged.
Reproduction of this report for resale or other
commercial purposes is prohibited without prior
written permission of the copyright holder.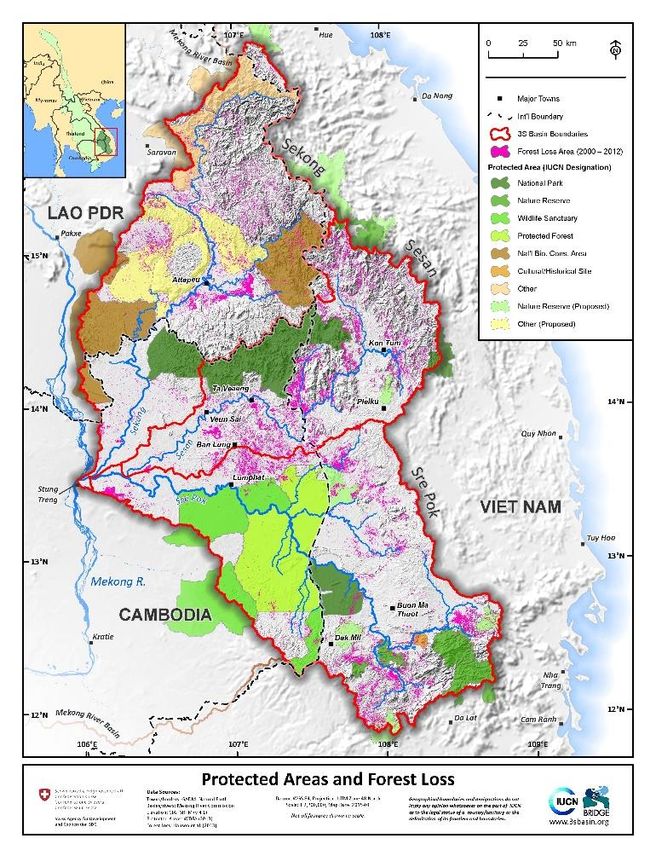
TABLE OF CONTENTS
EXECUTIVE SUMMARY ................................................................................................................................. v
1.     BACKGROUND ........................................................................................................................................ 1

     1.1     Sustainable development challenges in the 3S..................................................................... 1
     1.2     LMI and Nexus Futures Project ............................................................................................ 8
     1.3     Integration of assessment findings ....................................................................................... 9
2.     FUTURE EXPECTATIONS ................................................................................................................... 11

     2.1     Policy and planning framework ........................................................................................... 11
     2.2     Red flags ............................................................................................................................ 13
3.     NEXUS ASSESSMENT IN THE 3S ..................................................................................................... 15

     3.1     Nexus solutions .................................................................................................................. 19
     3.1.1 Multi-purpose dams/new operating rules: 8 threats ........................................................... 19
     3.1.2 Wetlands: 7 threats ........................................................................................................... 20
     3.1.3 Other natural infrastructure: 5 threats ............................................................................... 21
     3.1.4 Seepage troughs: 4 threats............................................................................................... 21
     3.1.5 Use of floodplains/restored floodplains: 3 threats .............................................................. 22
     3.1.6 Use of paddy fields: 2 threats ........................................................................................... 22
     3.1.7 Groundwater recharge infrastructure: 2 threats................................................................. 22
     3.2     Non-nexus solutions ........................................................................................................... 22
     3.2.1      New crops/farming systems ............................................................................................ 22
     3.2.2      Capacity building ............................................................................................................ 22
     3.2.3      Effective enforcement ..................................................................................................... 23
     3.2.4      Renewable energy technology ........................................................................................ 23
4.     TOWARD IMPROVED UNDERSTANDING ....................................................................................... 24

     4.1     Opportunity messages ........................................................................................................ 24
     4.2     Risk messages ................................................................................................................... 27
5.     ADVANCING THE NEXUS AGENDA ................................................................................................. 30

     5.1     Challenges ......................................................................................................................... 30
     5.2     Road map........................................................................................................................... 30
     5.3     Four possible futures .......................................................................................................... 30
     5.3.1      Scenario 1: Increasing tension ........................................................................................ 31
     5.3.2      Scenario 2: Lost opportunities......................................................................................... 31
     5.3.3      Scenario 3: Better than nothing....................................................................................... 31

                                                                            iii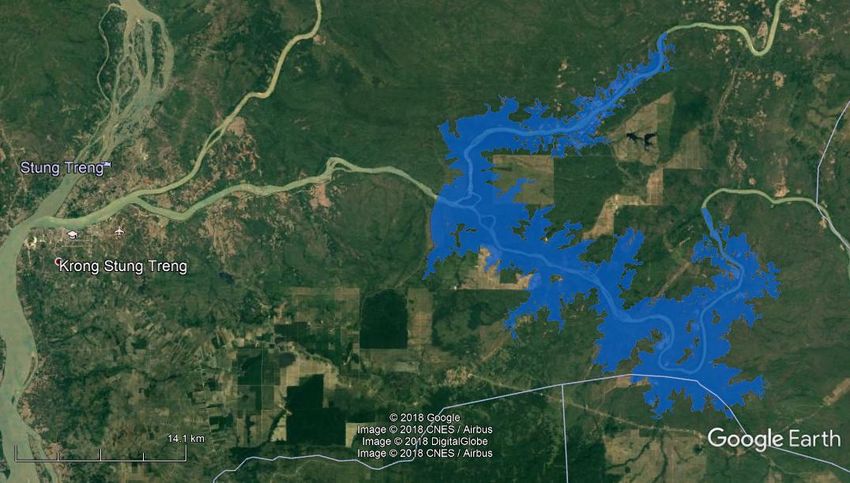
5.3.4       Scenario 4: Everyone‘s a winner ..................................................................................... 31
REFERENCES ................................................................................................................................................ 32
ANNEX 1: COLLABORATION AND PARTNERSHIPS .......................................................................... 39
ANNEX 2: 3S SECTOR SUMMARIES ....................................................................................................... 42
    1.     AGRICULTURE ................................................................................................................... 42
    2.     FISHERIES ......................................................................................................................... 44
    3.     HUMAN HEALTH ................................................................................................................ 48
    4.     HYDROPOWER .................................................................................................................. 49
    5.     MINING ............................................................................................................................... 53
ANNEX 3: POLICY AND PLANNING FRAMEWORK SUMMARY ....................................................... 57

                                                                             iv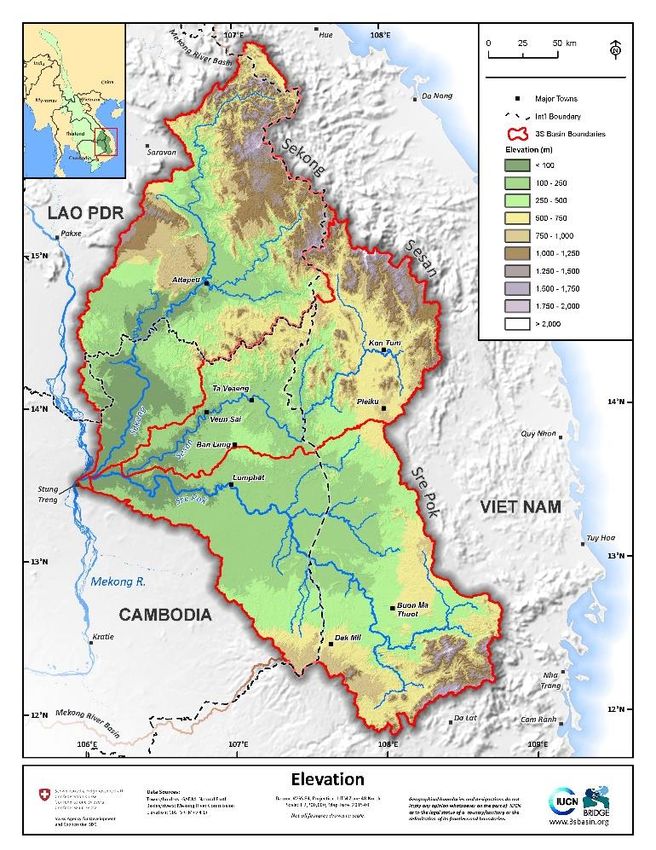
EXECUTIVE SUMMARY
The Lower Mekong Initiative (LMI) is a multi-donor, country-directed platform to coordinate and
address development challenges in three of the four Lower Mekong countries: Cambodia, Laos, and
Vietnam. The LMI is founded on the assumption that development challenges in the Lower Mekong
require stronger regional cooperation.1 One of LMI‘s components is an Environment and Water
Pillar. This component aims to advance sustainable economic development through regional
dialogue and capacity-building. It promotes cross-cutting strategies to achieve water, energy, food
and environmental security.
The LMI nexus Futures Program (NFP) is a subset of the LMI. It was created by merging LMI‘s
water, energy, food, and environment pillars. Its goals are:
the advancement of sustainable economic development;
strengthened regional integration; and
Resilience to the impacts of climate change.
A consortium comprising IUCN (International Union for Conservation of Nature), IWMI (International
Water Management Institute) and ICEM (International Centre for Environmental Management) was
engaged to assist the NFP by preparing a nexus assessment of the Sekong, Sesan, and Srepok
(3S) sub-basins in Cambodia, Laos, and Vietnam.
This report comprises a building block of the consortium‘s first deliverable which is:
“A nexus assessment produced in collaboration/partnership with key regional stakeholders to
facilitate improved understanding within existing local, national, and/or regional dialogues,
planning, and/or investments on the opportunities and risks from conjunctively managing
water, food, energy, and the environment”.
The term ―nexus assessment‖ refers to an integrated assessment of current and future trends of
water, energy, food, and environmental conditions to support integrated planning and development
decision-making at the regional level. The assessment also provides recommendations to overcome
data, technology, and capacity, institutional and financial barriers.
This report includes five sections and three annexes. Section 1 summarizes the key challenges in
the 3S. These include:
Rapid, unregulated land use change characterized by widespread deforestation.
Degradation of terrestrial and aquatic habitats, resulting in reduced biomass that provides
crucial nutritional value and livelihoods for the rural poor.
Poverty and malnutrition, especially among ethnic minorities.
Domestic immigration leading to unsustainable land use pressure, especially in Vietnam.
Squandering of water on economically low-value uses, resulting in declining basin welfare.
Global experience shows that the existing siloed approaches to water, food and energy will result in
continued degradation of the natural environment and with the poorest communities paying the
highest price. Hence the importance of the NFP dialogue, which seeks cross-sectoral and
integrated solutions.
To understand how a nexus approach can help avoid the problems of silo-based approaches to
water, food, energy and environment, it is necessary to know what is planned for these sectors in
each country. Section 2 therefore examines the policy and planning frameworks in Cambodia, Laos,
and Vietnam. It does this by consolidating the objectives in these frameworks into a set of
generalized objectives for each country. Redundancies are removed by further consolidation into 18
unique objectives of which:
Seven are concerned with water resources
1
https://www.lowermekong.org/
v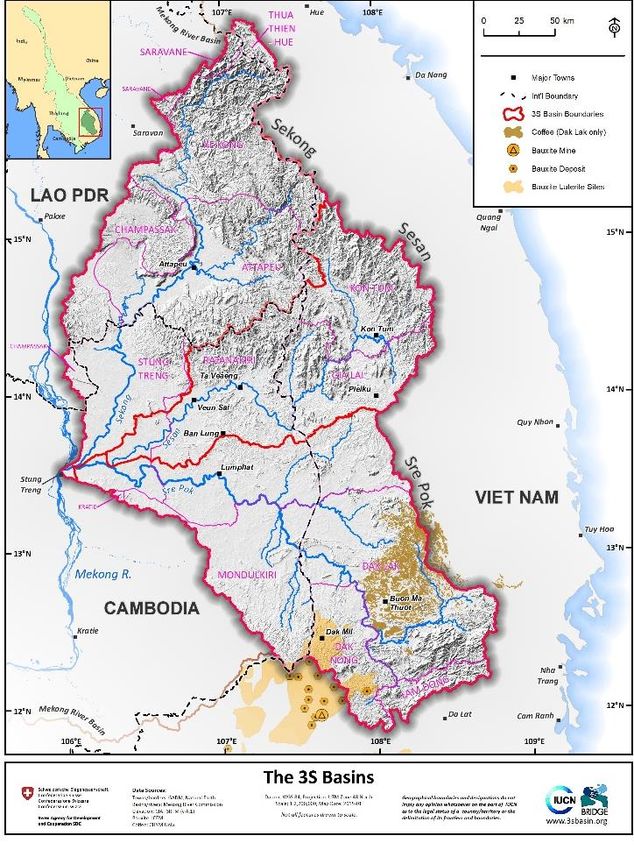
Three are concerned with food
Three are concerned with energy
Five are concerned with the environment
A nexus assessment applied to these objectives reveals a range of various threats that an initiative
in one sector might pose to another. We call these ―red flags‖.
Many of these threats could be addressed by appropriate implementation of a nexus approach
within and among each country. These are identified in Section 3. Seven nexus solutions are
identified of which two comprise of built and five are natural infrastructure. In addition, eight non-
nexus solutions are identified as complementary measures that would add value to a nexus
approach. The major threats and nexus solutions were then consolidated into the typology shown in
Table 1, which shows the potential of natural infrastructure to address the threats.
NEXUS SOLUTIONS
1. Multi-purpose dams or new operating rules
2. Large-scale groundwater recharge infrastructure
3. Natural infrastructure 1: Seepage troughs
4. Natural infrastructure 2: Wetlands
5. Natural infrastructure 3: Use of paddy fields
6. Natural infrastructure 4: Use of floodplains
7. Natural infrastructure 5: Other
THREAT NEXUS SOLUTIONS AVAILABLE
1 4 7 3 6 5 2 SOLUTIONS
1. Over-pumping groundwater for irrigation 1 1 1 1 1 1 1 7
2. Location-specific flood management infrastructure 1 1 1 1 1 5
3. Increased irrigation diversions 1 1 1 1 1 5
4. Over-exploitation of fishery and other aquatic organisms 1 1 1 1 4
5. Intensified smallholder agriculture and agrochemicals 1 1 1 3
6. Mineral processing impacts on water quality 1 1 1 3
7. Increased industrialization in upper Sesan and Srepok 1 1 2
8. Maximizing hydropower, increased dams and reservoir area 1 1
9. Deforestation 1 1
Potential number of threats that could be addressed 8 7 5 4 3 2 2
Table 1: nexus solutions ranked by applicable threats (horizontal)
and solutions per threat (vertical)
The remainder of Section 3 describes each of the nexus and non-nexus solutions.
Section 4 addresses the benefits, risks, and challenges that have emerged from the assessment.
Section 5 addresses challenges in implementing a nexus approach in the 3S.
vi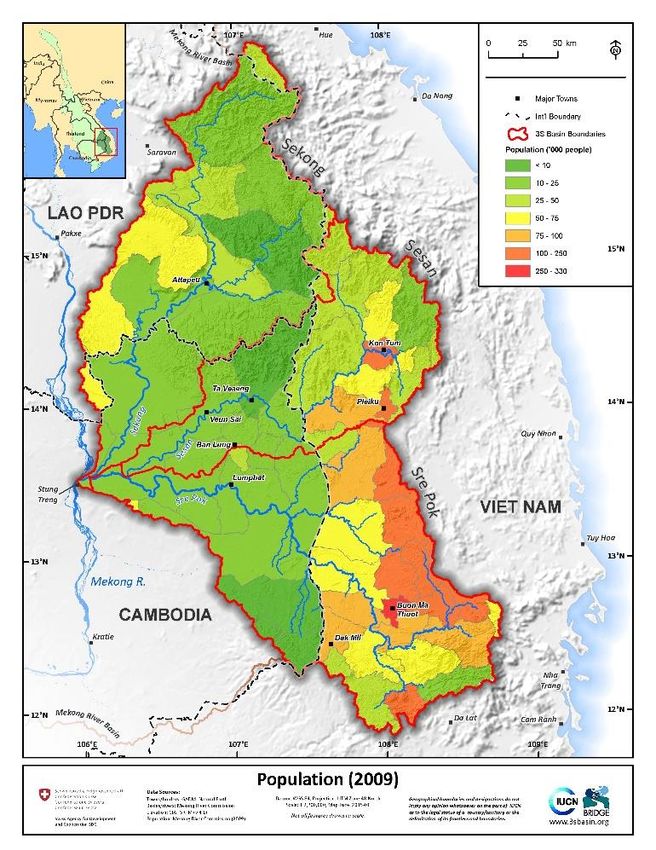
vii
1. BACKGROUND
1.1    Sustainable development challenges in the 3S
Globally, demands for water, energy, and food are increasing rapidly while available natural
resources are increasingly degraded and in scarce supply. This challenge is particularly acute in
developing countries experiencing rapid economic growth such as Cambodia, Laos, and Vietnam
(CLV).
Within CLV, the Sesan, Srepok, and Sekong, or 3S river basins, are of special interest from a nexus
perspective of water, energy, food and environmental trade-offs and solutions. This sparsely
populated region, often referred to as the last frontier of development in CLV, is rich in natural
resources, which governments are seeking to harness to drive national development. The process
has gone furthest in Vietnam where large-scale state investment in agriculture, mining, hydropower,
and transport in the Central Highlands started in the 1990s. In Cambodia, investments in roads,
hydropower, and land development started in the 2000s and in Laos more recently.

 Box 1.1: Development of the Central Highlands

 The Central Highlands is dominated by basalt-derived soils, which are suitable for perennial crops such as
 coffee, rubber, tea, pepper, cashew nut, and mulberry. Today, it produces 75% of Vietnam‘s rubber and
 80% of its coffee. Coffee exports from Dak Lak alone were worth $1.26 billion in 2018. The region is also
 rich in bauxite and gold.

 Before 1976, ethnic minorities made up 70% of the population. As more and more Kinh people—the
 largest ethnicity in Vietnam—arrived, the ethnic minority population declined to 44% in 1993 and 25% in
 2004. Most of the immigration was state-organized as the government brought in labor to work new state-
 owned logging and industrial crop enterprises and to reduce population pressure on the densely-
 populated Red River Delta in the north.

 Rapid Kinh immigration resulted in the large-scale transfer of land to state-owned farms and conflicts with
 ethnic minorities who were pushed deeper into the forests. The area of coffee grew from 207,000 hectares
 in 1996 to 573,000 hectares in 2014 while the area under rubber grew five-fold over the same period
 (Figure 1.6). In 2018, the area of coffee in Dak Lak alone was 204,000 hectares.

 Unregulated logging and land conversion resulted in rapid deforestation. Nationwide, annual timber
                                         3                                                    3
 production fell from 600,000-700,000 m in the late 1980s and early 1990s to 200,000-300,000 m today.
 Forest cover fell from 67% in 1976 to 50% in 2012 and has continued to decline.

 The government has invested heavily in infrastructure in the Central Highlands. Hundreds of small (
modification through a feedback loop (Figure 1.1). Increased modification of rivers results in
reduced food supply that drives agricultural intensification that requires further river modification.
This feedback loop is apparent in the Mekong Delta where the construction of high dikes in the
2000s to grow a third rice crop blocked the delivery of nutrient-rich sediment, which requires the
increased application of fertilizer and pesticide, whose production further increases energy use
(which in the delta is being increasingly met by coal power stations).
Such a feedback loop can have positive outcomes. More power can support increased
industrialization, urbanization, and higher paying non-agricultural jobs (e.g., construction, garments)
that allow food requirements to be met through a combination of increased productivity from land
consolidation (as the rural population falls) and/or increased imports.
However, this model entails risks.
From Vietnam‘s perspective, sediment-trapping dams pose an existential threat to the Mekong
Delta, source of 90% of the country‘s rice exports and 20% of its GDP. No amount of
industrialization could offset the loss of the delta‘s economic importance. In 2018, the Communist
Party of Vietnam designated the sustainability of the Mekong Delta a matter of national security. In
2014, to encourage greater regional cooperation over the Mekong, Vietnam ratified the UN
Watercourses Convention.
The loss of capture fisheries affects the landless who depend on fishing for their livelihoods and
food security. This risk is high in the 3S because over half the Lower Mekong fish catch is from long-
range migrant fish species that are particularly susceptible to dams, dikes, and other barriers. The
impacts of dams on fisheries and food security therefore extend far beyond the 3S itself.
Figure 1.1: Nexus feedback loop in the Lower Mekong adapted from Pittock et al. (2016)
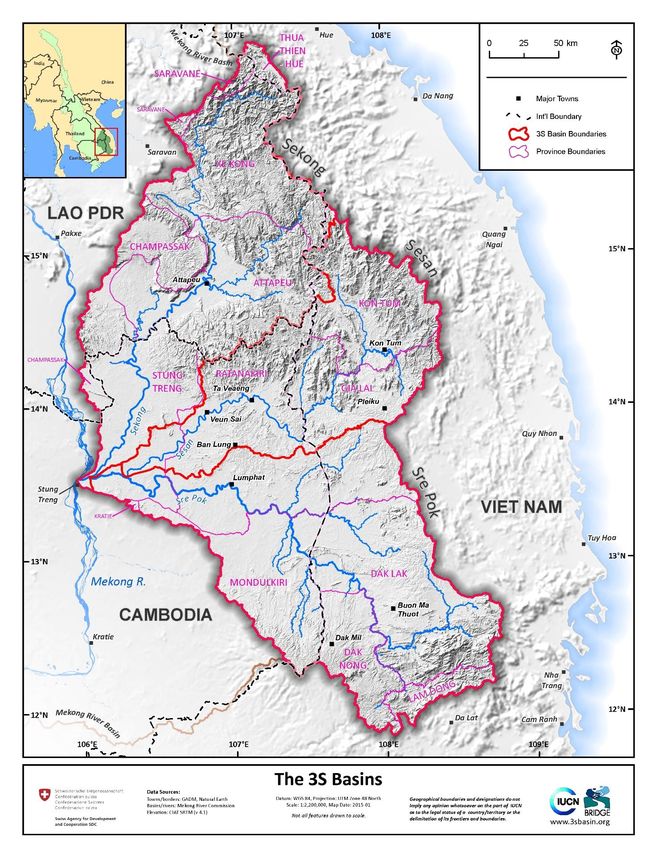
The 3S merge just upstream of their confluence with the Mekong and combined form the Mekong‘s
single largest tributary basin (78,579 km2). All three rivers are transboundary. The Sekong
originates in central Vietnam and flows into southeast Laos, and then into northeast Cambodia. The
Sesan and Srepok originate in the Central Highlands before they too flow into northeast Cambodia
(Figure 1.2).
2While often referred to as a single unit, the three rivers basins are physically, socially, and
economically diverse (Table 1.1). The Sekong is the least developed in terms of population,
commercial agriculture, and hydropower. It has the highest proportion of ethnic minorities, the
largest remaining area of forest, and the largest number of endemic fish species.
SEKONG SESAN SREPOK
C L V Total C V Total C V Total
BIOPHYSICAL
Catchment area 5,520 22,448 848 28,816 7,566 11,255 18,821 12,780 18,162 30,942
2
(km )
Mean elevation 154 646 844 558 273 778 575 218 525 398
(masl)
Mean annual 1,860 2,185 2,395 2,129 1,965 2,155 2,055 1,569 1,575 1,573
rainfall (mm)
Mean annual river --- --- --- 1,040 --- --- 651 --- --- 695
3
flow (m /s)
SOCIO-ECONOMIC
Population ‗000 37 369 30 436 121 946 1,068 163 2,348 2,511
(2015)
Population density 6.7 16.4 35.5 15.1 16.1 84.1 56.7 12.8 129.3 81.2
Ethnic minority 4 265 16 285 91 435 526 82 892 974
population ‗000 (%) (10) (72) (53) (65) (75) (46) (49) (50) (38) (39)
Population living 10,057 88,463 4,217 102,737 32,800 132,447 165,247 44,112 328,718 372,830
in poverty ‗000 (%)
KEY SECTORS
No. hydropower 0 7 0 7 1 7 8 0 5 5
dams (0) (1,252) (0) (1,252) (1) (3,331) (3,332) (0) (1,184) (1,184)
(installed capacity
MW)
Agricultural area 1,331 1,237 3,027
2
(km )
Capture fisheries 1,100- 690 100 370- 1,268 682- 1,576
(tons/yr) 1,530 845 1,136
Table 1.1: 3S at a glance, key statistics by basin (Constable 2015)
Covering about 10% of the river basin, the 3S provide about 20% of the mean annual flow of the
Mekong (Arias et al., 2014), a proportion that rises to 35% during the dry season, and almost 15%
of its suspended sediment (Koehnken, 2012). These sediments provide nutrients vital to fisheries in
the Tonle Sap and rice production in the Mekong Delta. The 3S is also the Mekong‘s most important
river basin for migratory fish populations and plays a critical role in maintaining the hugely
productive downstream fisheries (Ziv et al., 2012).
3Figures 1.2-1.3: Elevation and population in the 3S
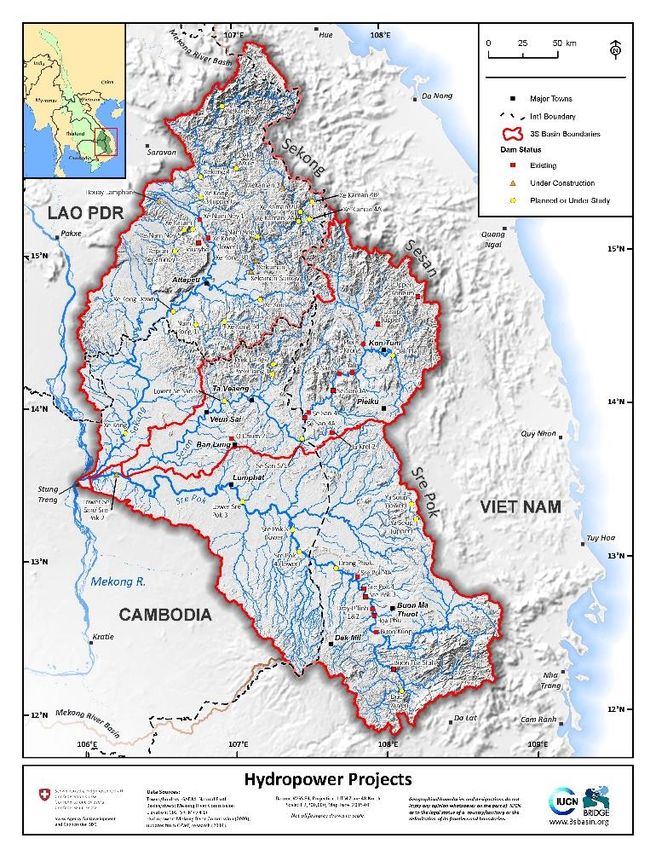
A large proportion of existing hydropower production in Vietnam (17%) and Laos (30%) is A large
proportion of existing hydropower production in Vietnam (17%) and Laos (30%) is in the 3S and
both Laos and Cambodia have plans for significant further power development (Figure 1.5). The
400 MW Lower Sesan 2 (LS2) was completed in late 2017. Located just below the confluence of the
Sesan and Srepok, the LS2 blocks fish migration up the entire length of these two rivers and is
estimated to reduce total fish biomass in the Lower Mekong by almost 10% (Ziv et al., 2012).
The 3S has a total population of just over four million, most of whom (82%) live in the Central
Highlands (Figure 1.3). A significant proportion, particularly in Cambodia and Laos, are member of
over 60 ethnic minorities. Migration of ethnic Vietnamese (Kinh) into the Central Highlands has
resulted in a significant decline in the proportion that are ethnic minorities (D‘haeze, et al., 2005) but
in absolute terms the population of ethnic minorities is far larger in the Central Highlands than in
either Cambodia or Laos.
Poverty is concentrated in ethnic minority groups. Often located on marginal lands, using traditional
low productivity agriculture practices, and with limited access to roads, electricity, water supply and
sanitation infrastructure, these are largely small-scale, subsistence farming communities that remain
highly dependent on fisheries and forest products. Although conditions tend to be better than in
many parts of Cambodia and Laos, the largest numbers of poor people live in the Central
Highlands. Throughout the 3S, ethnic minorities remain exposed to economic and environmental
vulnerabilities that undermine their livelihoods, health and general well-being. Life expectancy is
low, and malnutrition remains a severe problem with rates well above national averages in all three
countries.
4Expansion of agriculture and commercial plantations has led to rapid forest loss, particularly since
the late 2000s (Box 1.2) in response to increased Vietnamese investment in rubber plantations in
Cambodia and Laos and, in Cambodia, the allocation of 67 Economic Land Concessions (ELCs)
covering 620,300 hectares.
About one-third of the 3S has some form of legal protection. But minimal government investment in
protected area management coupled with large-scale forest clearing for plantations and other forms
of economic concession and improved road access has resulted in some of the world‘s highest
deforestation rates. As forest landscapes have become fragmented, populations of commercially
valuable wildlife have been extirpated by poaching to feed the illegal wildlife trade.
Box 1.2: Forest loss and protected areas in the 3S
Between 2000 and 2017, the 3S lost 947,000 hectares of forest (14% of forest extent in 2000, one of the
highest rates in the world). Of this, 83% was in forests with >50% canopy cover and 66% in forests with >80%
canopy cover, indicating that mostly high-quality forest was lost. There has also been significant forest loss
within protected areas, which cover 35% of the 3S (Figure 1.5).
Between 2000 and 2017, protected areas lost 172,000 hectares of forest cover, equivalent to 7% of total
protected area coverage and 18% of total 3S forest loss. Protected areas in the Srepok in Cambodia and
Vietnam and the Sekong in Laos suffered the highest forest losses in absolute and relative terms. However,
the rate of forest loss inside protected areas is about one-third of the rate of forest loss outside protected
areas, indicating that they do provide a degree of protection.
Figures 1.4-1.5: Hydropower dams, and protected areas and deforestation in the 3S
5Artisanal and large-scale mining is important in the Laos and Vietnam portions of the 3S. In
Cambodia, mining is still very limited but there are plans for large gold mines, including inside
protected areas. Environmental concerns relate to the impacts of mining on water quality,
disturbance of aquatic habitats, and the influx of hundreds of foreign workers. Sand and gravel
extraction from river beds in the 3S is a growing concern in all three countries because of river bank
collapse and increased turbidity.
The Central Highlands is home to the world‘s third largest bauxite deposits (Figure 1.6). This is a
potential game changer because the conversion of bauxite to alumina (the precursor to aluminum)
requires large amounts of water and energy. There is only one bauxite mine in the 3S, in Vietnam.
But if bauxite mining expands significantly it will require a major increase in hydropower that could
have huge impacts on river flow and water quality. Similar environmental impacts could accompany
the planned expansion of gold mining in Cambodia.
Figure 1.6: Coffee (Dak Lak) and bauxite deposits
Throughout the 3S, economic development in the form of concessions for hydropower, mines, and
agribusiness (e.g., coffee, cassava, rubber, sugar cane) has reduced the quantity and quality of
forests, rivers, and other natural resources. The impacts of different schemes often intersect,
increasing their severity. For example, the resilience of communities affected by hydropower is often
further undermined by the impacts of agribusiness and/or mining concessions on other resources.
These cumulative impacts are hardly ever recognized and local people are rarely adequately
compensated (Baird and Barney, 2017).
The Vietnamese government provides extensive rural welfare services. But these services are not
tailored to ethnic minorities or address the underlying causes of exclusion and have not proved
effective at reducing malnutrition and other non-material dimensions of poverty. In the 3S, it is the
poorest, ethnic minorities, and women who disproportionately pay the price for national economic
development.
6Box 1.3: Impacts of Yali Falls Dam
2
More than 8,500 people, mostly from ethnic minority groups, were relocated from the dam‘s 68.4 km
inundation zone. The dam has also affected the livelihoods of people living downstream in both Vietnam and
Cambodia. In both countries, communities report that alteration of river flows has made farming and fishing
along the river banks extremely dangerous. From 1999 to 2001 flash floods killed at least 39 people and
valuable livestock and destroyed vegetable gardens and rice fields. It is estimated that up to 55,000 villagers
from 16 ethnic minority groups in Cambodia's Ratanakiri and Stung Treng Provinces and many thousands
more in the Central Highlands continue to suffer due to lost rice production, drowned livestock, lost fishing
income, and damage to rice reserves, boats, fishing gear and houses because of rapid river level
fluctuations resulting from dam operation. These people have received no compensation for the adverse
livelihood impacts caused by the dam (IEBR and IRN, 2004).
There is no institutionalized transboundary cooperation on the 3S. The mandate of the Mekong
River Commission (MRC) only extends to the Mekong mainstream, not its tributaries such as the
3S. This has already resulted in major unplanned and unwanted transboundary impacts (Box 1.3).
Conservation International‘s Freshwater Health Index study of the 3S gives the following scores:
Ecosystem Vitality: 66%; Ecosystem Health: 80%; and Governance & Stakeholders: 43% (FHI,
2018). The low governance score was weighed down by particularly low scores for enforcement and
compliance and information access.
While there are many causes for concern, there are also grounds for optimism.
The 3S has substantial solar and wind potential and dramatic price reductions in renewable energy
generation give CLV the chance to achieve energy security at much lower social, environmental and
financial cost (Figure 1.7).
Hydropower will remain an essential part of any regional power scenario. But by integrating solar
and wind, expanding regional power trade, and improving energy efficiency, fewer dams will be
needed to meet a given level of energy demand. That would reduce river fragmentation and
sediment trapping and therefore threats to fisheries, food security, and the Mekong Delta.
Figure 1.7: Solar and wind power potential in CLV and 3S
7Another positive signal are plans to establish river basin organizations in Vietnam (for the Sesan
and Srepok) and in Laos (for the Sekong, which is also undergoing an IFC-financed hydropower
cumulative impact assessment). Since 2012, the World Bank‘s Mekong Integrated Water Resources
Management Project (M-IWRM) has fostered transboundary cooperation between Cambodia and
Vietnam on the Srepok and Sesan. While embryonic, these initiatives reflect recognition of the need
for coordinated river basin development, including hydropower.
Official recognition of the benefits of improved planning is the Sustainable Hydropower Master Plan
for Xe Kong (Sekong) Basin in Laos, which the Natural Heritage Institute (NHI) prepared on behalf
of the Lao government (NHI, 2017). The purpose is to support implementation of the Policy on
Sustainable Hydropower Development that was decreed by the Prime Minister in 2015. It provides
standards or criteria for determining the sustainability of proposed hydropower projects.
The master plan‘s major recommendation is to defer any decision on mainstream dams and pursue
instead the options in the order in which they are presented, with the solar augmentation of existing
reservoirs as the top priority. (Solar augmentation, which benefits from existing transmission lines,
has been deployed in China and South Korea. And in November 2018 the Electricity Generating
Authority of Thailand (EGAT) announced plans for Thailand‘s first large-scale deployment of floating
solar.2) If there comes a time when additional power from the Sekong is needed, the uppermost
dams should be given a higher priority. The lowermost dams, notably the Sekong Downstream A,
should not be developed under any circumstance because of the very large impacts relative to the
power generated.3 There is also investment in wind power in the 3S: Impact Energy Asia, a Thai
firm, is building a 600 MW wind farm, ASEAN‘s largest, in Attapeu Province.4
A nexus study of the 3S is particularly timely because it can help answer important policy questions.
For example:
Now that the Sesan and Srepok are cut off by the LS2 dam, how can the two river systems
be developed in ways that optimize remaining water, food, energy, and environmental
benefits and allow for greater connectivity if LS2 were modified to allow for fish passage?
Now that the Sekong is the last major tributary of the Mekong with no mainstream dams,
how can energy planning ensure that its critical value in regional fisheries and food security
be secured?
As climate change impacts and adaptation costs increase, what combination of hard and soft
engineering offers the best value for money?
The drought that struck the Central Highlands in 2016, the worst in 30 years, illustrates the need for
a nexus approach. Hundreds of reservoirs ran out of water and over 165,000 hectares of coffee
plantation were affected, of which 40,000 hectares were lost. Tens of thousands of households lost
access to piped water. The total economic damage was almost $100 million. Was this the result of
unbridled natural resource depletion that increased vulnerability to climate shocks? Or could it have
simply been a consequence of lower than normal rainfall? One could argue that it demonstrates the
need for more water storage, not less.
The following sub-section introduces the Lower Mekong Initiative, which advocates a nexus
approach to defining win-win pathways toward equitable economic development in the 3S.
1.2 LMI and Nexus Futures Project
The Lower Mekong Initiative (LMI) is a multi-donor, country-driven platform founded on the
assumption that meeting the development challenges in the Lower Mekong Basin requires regional
2
https://www.pv-tech.org/news/thailand-utility-eyes-1gw-of-floating-solar-on-hydro-dams-pilots-energy-
sto?utm_source=Mekong+Eye&utm_campaign=c778922c35-
EMAIL_CAMPAIGN_2018_01_10_COPY_01&utm_medium=email&utm_term=0_5d4083d243-c778922c35-380875673
3
https://www.iucn.org/news/viet-nam/201805/xe-kong-1-dam-why-it-matters-vietnam
4
http://www.impactelectrons.com/wp-content/uploads/2017/09/Monsoon_Wind_Power_Factsheet_EN.pdf
8cooperation.5 One of LMI‘s components is an Environment and Water Pillar. It aims to advance
sustainable economic development through regional dialogue and capacity-building. It promotes
cross-cutting strategies to achieve water, energy, food and environmental security.
At the 8th LMI Ministerial Meeting in August 2015, the U.S. Secretary of State and the Foreign
Ministers of Cambodia, Laos, Myanmar, Thailand, and Vietnam released a joint statement entitled
―Building a Sustainable Future for the Mekong‖.6 This statement commits signatories to seek
avenues for collaboration in the capacity-building needed to drive sustainability in the Mekong
region. The LMI Nexus Futures Program (NFP) is a subset of the LMI. It was created by merging
LMI‘s water, energy, food, and environment pillars. Its goals are:
the advancement of sustainable economic development;
strengthened regional integration; and
resilience to the impacts of climate change in the Lower Mekong countries.
These goals are to be achieved by strengthening regional discussions that advance integrated
planning based on the inter-connections between water, energy, food and environment. The Siem
Reap Declaration from the 3rd MRC Summit in April 2018 recognizes the need for a nexus approach.7
To map alternative approaches, the NFP will develop a science-based nexus assessment of the 3S
to identify ways to maximize sustainable development outcomes. The term ―nexus assessment‖
refers to an assessment of the current and future trends of water, energy, food, and environmental
conditions arranged to support integrated planning and development decision-making at the regional
level as well as recommendations to overcome data, technology, capacity, institutional and/or
financial barriers.
The 3S nexus assessment has three objectives:
1. A nexus assessment produced in collaboration with key regional stakeholders to facilitate
improved understanding within existing local, national, and/or regional dialogues, planning,
and/or investments on the benefits from conjunctively managing water, food, energy, and the
environment.
2. Integration of the assessment findings into local, national and/or regional discussions on
infrastructure planning, development, and/or investments, notably the Cambodia-Laos-
Vietnam (CLV) Initiative, ADB‘s Greater Mekong Sub-region (GMS), and MRC‘s Basin
Development Plan (BDP) 2016-2020, which includes an as yet unfunded joint project on the
Sesan and Srepok under the National Indicative Plan (NIP) 2016-20,8 and the Sustainable
Hydropower Development Strategy (SHDS), which is in preparation and will form an input to
BDP 2021-2025.9
3. Dissemination of the best practices and lessons learned through existing mechanisms to
improve development across the region through strengthening the capacity of relevant
stakeholders, basin planning organizations, and local institutions to manage trade-offs and
opportunities beyond the life of the project.
1.3 Integration of assessment findings
This document is concerned with the first objective. It assesses nexus-style management measures
needed to mitigate water, food, energy and environmental security risks under business-as-usual and
contribute to improved stakeholder understanding of planning and/or investments. The main text
continues in Section 2 with a brief assessment of future expectations stated in national policies and
plans.
5
https://www.lowermekong.org/
6
https://2009-2017.state.gov/r/pa/prs/ps/2015/08/245710.htm
7
http://www.mrcmekong.org/assets/Uploads/Siem-Reap-Declaration-5-April-2018.pdf
8
http://www.mrcmekong.org/assets/Publications/MRC-promotional-report-on-Identified-Joint-Projects-for-2016-2020.pdf
9
http://www.mrcmekong.org/assets/Uploads/Summary-note-Draft-SHDS-Aug-2018.pdf,
http://www.mrcmekong.org/assets/Uploads/3.-Review-and-Update-of-SHDS.-120918.pdf
9Section 3 identifies challenges and opportunities that could be addressed through synergy, trade-off
or compromise. The section then presents possible nexus solutions.
Section 4 provides guidance to policy making in the 3S (and other river basins).
Section 5 addresses challenges in implementing a nexus approach in CLV.
The main text is supported by three annexes.
Annex 1 identifies the collaborations and partnerships that have characterized the work undertaken
to date.
Annex 2 provides a detailed overview of the sub-basin and as such supports the summary
background presented in Section 1.1.
Annex 3 summarizes water, food, energy and environmental plans and policies in CLV.
102. FUTURE EXPECTATIONS
The project‘s TOR require ―an assessment of the current and future trends of water, energy, food and
environmental conditions.‖ CLV have objectives and plans for each sector, but not all are compatible,
with some posing threats to others. By looking at competing sectors through a nexus lens it is
possible to identify conflicts that could be resolved using various combinations of synergies, trade-
offs or compromise.
This section explores relevant policy and planning frameworks in CLV and the 3S to identify how the
expectations of one sector that might be incompatible with those of another.
Not all potential conflicts represent nexus opportunities. This section identifies those that do and
explains why. Possible nexus approaches to these conflicts are suggested in Section 3.
2.1 Policy and planning framework
Annex 3 presents details of the policy and planning frameworks as they pertain to water (W), energy
(EN), food (F) and environment (EV). Table 2.1 is a generic summary of the framework, providing the
same information but in a more consolidated fashion.
11SECTOR CAMBODIA LAOS VIETNAM
W Integrated management in a basin IWRM Increase in "recovered"
context water bodies increased by
Prioritize river basin and aquifer Ensure multi-purpose, cross- 30%
conservation sectoral management
Groundwater development
Prevent, control and reduce
pollution
Build river dikes as a flood
management measure
F Improve access to improved water Upgrade irrigation to Increase water service to
services in the rural areas permanent systems plus both urban and rural users
major irrigation expansion
25% increase in irrigated area, of Massive increase in irrigated Increased area of rice
which paddy will comprise a rice production production, which can be
significant component (see assumed to require
fisheries) irrigation
Increase irrigated area Existing rice area protected
Increase fisheries from development
Protect ecosystem to support 1.2 million hectares of
capture fisheries aquaculture
Increase rice field fisheries (implies
wetland rice)
Growth of culture fishery sector
Increase the number of fishes,
especially endangered species
EN Expand service coverage Expand service coverage Prioritize hydropower
Expand regional energy trade Complete 15 hydropower development
dams
Small hydropower
development as default
wherever possible
EV Protection and conservation of Effective management and Improve climate change
forest resources to alleviate utilization of natural resilience
poverty and ensure equitable resources
economic growth
Reforestation including flooded Reforestation Reforestation
forest and mangrove areas
Ensure climate resilience of critical Expand environmentally
ecosystems friendly tourism
Wetlands management
according to Ramsar criteria
Table 2.1: Generic policy and planning framework for water, food, energy, and environment
Table 2.1 includes repetitions and redundancies. These are consolidated into 18 objectives in Table
2.2, which shows which objective applies to which sector in which country. Water is the sector with
the most objectives (7) followed by environment (5) and food and energy (3 each).
12SECTO CONSOLIDATED OBJECTIVES
R
W IWRM or Aquifer Aquifer Reduce Flood Water Increas
"multi- conservation develop- pollution control body e water
purpose, ment rehabili supply
cross- -tation service
sectoral delivery
managemen
t
C Y Y N N N N Y
L Y N Y Y Y N N
V N N N N N Y Y
F Substantial Increase Increase
expansion capture culture
of irrigation fisheries fisheries
of which a
large portion
is for paddy
C Y Y Y
L Y Y N
V Y N Y
EN Expand Prioritize Regional
electrical hydropower energy
service trade
coverage
C Y N Y
L Y Y N
V Y N
EV Forest Reforestatio Improve Expand Effective
conservatio n ecosyste environmentall managemen
n for poverty m climate y friendly t and use of
alleviation change tourism natural
and resilience resources
economic
growth
C Y Y Y N N
L N Y N Y Y
V N Y Y N N
Table 2.2: Consolidated policy and planning framework for
water, food, energy and environment
2.2 Red flags
The consolidated policy and planning framework presented above can identify ways by which water,
food, energy and environmental security are threatened by specific policies and plans. These threats
are our red flags (Table 2.3), which arise from initiatives that provide benefits for one sector but
impose costs on another.
THREATS NEXUS SECTORS EXPLANATION
BENEFICIARY THREATENED
1. Over-pumping groundwater for F W, EV, EN This can result in serious
irrigation constraints on surface water
baseflows
132. Location specific flood F W, EV As above, plus the risk of water
management infrastructure logging and soil degradation and
compromised soil biota
3. Increased irrigation diversions F W, EV Pollution from increased use of
agricultural chemicals while
unregulated pesticide use
represents threats to the natural
biome.
Increased irrigation may be an
implicit assumption embedded in
―commercialization‖ especially if
investments in value addition are
an objective.
4. Over-exploitation of fish and None W, EV Pollution
other aquatic organisms
5. Intensified smallholder EN W, F, EV Although often thought of as a non-
agriculture and agrochemicals consumptive use of water, there are
evaporation losses and usually
there are also deep percolation
losses that do not necessarily
return to the surface drainage
system. Also, hydropower operating
rules may limit the allocation of
water to uses with lower opportunity
costs. Dam cascades for which the
operating rules require the
maintenance of full supply levels
increase risk of catastrophic
flooding.
Hydropower reservoirs can be
significant sources of greenhouse
gases while dams and reservoirs
represent obstacles to spawning
and migratory routes.
6. Mining and processing impacts None W, EN, EV Pollution and increased demand for
on water quality energy
7. Increased industrialization in None W, EV Disrupted hydrographs and
upper Sesan and Srepok sediment problems with respect to
water. These are also
environmental problems that affect
habitat and ecosystem services.
8. Maximizing hydropower, F EV, F Included here because sustainable
increased dams and reservoir fisheries expansion and
area intensification can be incorporated
into nexus investment opportunities
9. Over-pumping groundwater for W E, EV, F There is a risk that flood
irrigation containment using dikes to protect
one location simply shifts and
magnifies the problem downstream.
In addition, river dikes severely
curtail floodplain functions including
fish reproductive cycles while
reducing genetic diversity.
Table 2.3: Red flags
143. NEXUS ASSESSMENT IN THE 3S
Before understanding how a nexus approach can help solve water-related problems, stakeholders
first need to understand the difference between a watershed and a ―problem-shed‖.
For example, unsustainable land and water use may result from limited non-agricultural livelihood
opportunities. Fix that, and the problems of unsustainable land and water use could disappear. The
lack of off-farm livelihoods is a problem-shed issue whereas its result is a watershed issue. However,
the lack of off-farm livelihoods may arise from inadequate or unreliable energy or raw material
supplies, and this could be a watershed issue because of energy (hydropower) or agricultural inputs
(agribusiness). Hence the value of a nexus approach that reveals non-traditional, alternative
pathways through the interconnected maze of problems situated in both the watershed and the
problemshed.
For example, a large-scale agribusiness investment could stabilize watersheds, thereby restoring
and sustaining stream flows for downstream users while establishing value chains that offer
improved livelihoods and economic growth.
Achieving the benefits of integrated planning is constrained by institutional and policy silos and
vested interests. The nexus approach breaks down these sector walls by providing policy makers
with options for:
Synergies, whereby one intervention achieves multiple objectives.
Trade-offs, whereby a sector objective is rendered sub-optimal in favor of another that is
optimized.
Compromise, whereby a result that is less than perfect for one or more stakeholder is
accepted by all for the sake of the common good.
Trade-offs and compromise always have ―winners‖ and ―losers‖ and may therefore fall under the
remit of national rather than sectoral policy. This is a key issue for a study such as this, which is
intended to increase understanding.
Mapping threats (Table 2.3) against the consolidated objectives (Table 2.2) identifies potential nexus
solutions. This mapping leads to seven potential investment options (Table 3.2) that either singly or
in combination can avoid or reduce threats (Table 3.1).
THREATS
1. Over-pumping groundwater for irrigation
2. Location specific flood management infrastructure
3. Increased irrigation diversions
4. Over-exploitation of fish and other aquatic organisms
5. Intensified smallholder agriculture and agrochemicals
6. Mineral mining and raw material processing impacts on water quality
7. Increased industrialization in upper Sesan and Srepok
8. Maximizing hydropower, increased dams and reservoir area
9. Over-pumping groundwater for irrigation
SECTOR CONSOLIDATED OBJECTIVES THREATS WITH POTENTIAL
FOR NEXUS SOLUTION
1 2 3 4 5 6 7 8 9
W IWRM or "multi-purpose, cross-sectoral management‖ 1 1 1 1 1
Aquifer conservation 1 1
Aquifer development 1 1
Reduce pollution 1 1 1 1
Flood control 1 1
Water body rehabilitation 1 1 1 1 1
Increase water supply service delivery 1 1 1 1
F Substantial expansion of irrigation of which a large portion is 1 1 1
for paddy
Increase capture fisheries 1 1 1 1 1 1 1
15Increase culture fisheries 1
EN Prioritize hydropower development 1 1
EV Forest conservation for poverty alleviation and economic 1 1
growth
Reforestation 1 1
Improve ecosystem climate change resilience 1 1
Expand environmentally friendly tourism 1 1
Effective management and use of natural resources 1 1 1 1
Table 3.1: Threats with possible nexus solutions
Nexus investment options fall into two categories: natural infrastructure and built infrastructure (Table
3.2). These are defined as follows:
Natural infrastructure comprises investments in the conservation, adaptation or modifications
of natural landscape features, e.g., natural or man-made wetlands, reforestation, restored
floodplains, and catchment stabilization.
Built infrastructure is the multi-purpose, civil works infrastructure needed to attenuate or
otherwise manage flooding and/or increase water supplies for energy and food security and
for the environment. In the 3S, built infrastructure includes dams, reservoirs, water
harvesting facilities, and drains.
It should be noted that:
Although each threat can be addressed by a nexus solution for at least one of the objectives
(Table 3.2), it is possible that some threat/objective solutions threaten other solutions.
In some cases, non-nexus measures could help. These can be thought of as complementary
measures that add value to a nexus solution.
16SEC GENERIC THREATS NEXUS SOLUTIONS NON-NEXUS SOLUTIONS
TOR OBJECTIVE
1. Multi-purpose dams/new 1. New crops/farming systems
operating rules
2. Groundwater recharge 2. Capacity building
infrastructure
3. Natural infrastructure 1: 3. Effective enforcement
Seepage troughs
4. Natural infrastructure 2: 4. Renewable energy technology
Wetlands
5. Natural infrastructure 3: Use of
paddy fields
6. Natural infrastructure 4: Use of
floodplains
7. Natural infrastructure 5: Other
1 2 3 4 5 6 7 1 2 3 4 5 6 7 8
W IWRM or Over-pumping groundwater for Y Y Y Y Y
"multi-purpose, irrigation
cross-sectoral Increased irrigation diversions Y Y Y
management Intensified smallholder Y Y Y
agriculture and agrochemicals
Mining and processing impacts Y Y Y Y Y
on water quality
Location specific flood Y Y Y
management infrastructure
W Aquifer Over-pumping groundwater for Y Y Y Y
conservation irrigation
Location specific flood Y Y Y
management infrastructure
Over-pumping groundwater for Y Y Y Y Y
irrigation
Location specific flood Y Y
management infrastructure
W Pollution Intensified smallholder Y Y Y Y
reduction agriculture and agrochemicals
Mining and processing impacts Y Y Y
on water quality
Maximizing hydropower, Y
increased dams and reservoir
area
Increased industrialization in Y Y Y Y
upper Sesan and Srepok
W Flood control Mining and processing impacts Y
on water quality
Location specific flood Y Y Y Y
management infrastructure
W Water body Over-pumping groundwater for Y Y Y Y Y
rehabilitation irrigation
Increased irrigation diversions Y Y
Intensified smallholder Y Y Y
agriculture and agrochemicals
Mining and processing impacts Y Y
on water quality
Increased industrialization in Y Y Y
upper Sesan and Srepok
W Increased Increased irrigation diversions
water supply Intensified smallholder Y Y Y
service delivery agriculture and agrochemicals
Mining and processing impacts Y Y Y
on water quality
Increased industrialization in Y Y Y
upper Sesan and Srepok
F Substantial Over-pumping groundwater for Y Y Y Y Y
expansion of irrigation
irrigation of Mining and processing impacts Y Y Y Y
which a large on water quality
17portion is for Mining and processing impacts Y
paddy on water quality
F Increased Increased irrigation diversions Y Y
capture Intensified smallholder Y Y Y
fisheries agriculture and agrochemicals
Mining and processing impacts Y Y Y Y
on water quality
Maximizing hydropower, Y
increased dams and reservoir
area
Increased industrialization in Y Y Y
upper Sesan and Srepok
Over-exploitation of fish and Y Y Y
other aquatic organisms
Location specific flood Y Y Y Y
management infrastructure
Mining and processing impacts Y Y Y
on water quality
EN Prioritize Over-pumping groundwater for Y Y Y
hydropower irrigation
development Increased irrigation diversions Y Y Y Y Y
EV Forest Maximizing hydropower, Y
conservation increased dams and reservoir
for poverty area
alleviation and Deforestation Y
economic
growth
EV Reforestation Maximizing hydropower,
increased dams and reservoir
area
Deforestation Y
EV Improved Location specific flood Y Y Y
ecosystem management infrastructure
climate change
resilience
EV Expanded Deforestation Y
environmentall Over-exploitation of fish and Y Y Y
y friendly other aquatic organisms
tourism
EV Effective Increased irrigation diversions Y Y Y Y
management Deforestation Y
and use of Over-exploitation of fish and Y Y Y
natural other aquatic organisms
resources Location specific flood Y Y Y Y
management infrastructure
Table 3.2: Nexus investment opportunities
18Before proceeding to consider various nexus solutions, it is useful to rank the contents of Table 3.2
in two ways:
By the number of threats that a solution can address.
The number of nexus solutions for each threat.
Table 3.3 shows the utility of natural infrastructure, especially wetlands. Natural infrastructure
typically benefits local communities whereas built infrastructure is likely to benefit large and often
remote investments such as irrigation projects or special economic zones while negatively
impacting those who live nearby. Table 3.3 also shows that dams should be designed and operated
to achieve multiple objectives.
NEXUS SOLUTIONS
1. Multi-purpose dams/new operating rules
2. Large-scale groundwater recharge infrastructure
3. Natural infrastructure 1: Seepage troughs
4. Natural infrastructure 2: Wetlands
5. Natural infrastructure 3: Use of paddy fields
6. Natural infrastructure 4: Use of floodplains
7. Natural infrastructure 5: Other
THREAT NEXUS SOLUTIONS AVAILABLE
1 4 7 3 6 5 2 SOLUTIONS
1. Over-pumping groundwater for irrigation 1 1 1 1 1 1 1 7
2. Location specific flood management infrastructure 1 1 1 1 1 5
3. Increased irrigation diversions 1 1 1 1 1 5
4. Over-exploitation of fishery and other aquatic 1 1 1 1 4
organisms
5. Intensified smallholder agriculture and agrochemicals 1 1 1 3
6. Mining and processing impacts on water quality 1 1 1 3
7. Increased industrialization in upper Sesan and 1 1 2
Srepok
8. Maximizing hydropower, increased dams and 1 1
reservoir area
9. Deforestation 1 1
Potential number of threats that could be addressed 8 7 5 4 3 2 2
Table 3.3: Nexus solutions ranked by number threats (vertical)
and solutions per threat (horizontal)
The following sub-sections:
describe each of Table 3.3‘s nexus solutions;
explain how they could mitigate the threats involved; and
present non-nexus solutions that complement nexus ones.
3.1 Nexus solutions
3.1.1 Multi-purpose dams/new operating rules: 8 threats
Designing and operating dams to achieve multiple objectives addresses the largest number of
threats and is thus a priority action in addressing the nexus. Dams can be operated for multiple
ends including water supply, hydropower, culture fisheries, capture fisheries, partial re-
establishment of natural hydrographs, groundwater recharge, maintenance of navigation depths,
and flood management. In the 3S, most dams have been designed and are operated for a single
purpose: hydropower. New operating rules for existing dams, and the design of new dams should
be predicated on multi-purpose use.
Three examples illustrate how single-purpose dams can cause multi-sector problems. Two are from
Vietnam and one from Zambia. All three are hydropower dams, which is important because all
dams planned for the 3S are intended for hydropower and power generation operating rules almost
always dominate other uses.
19You can also read