GREATER WESTERN SYDNEY'S HOT ISSUE - DECEMBER 2019
←
→
Page content transcription
If your browser does not render page correctly, please read the page content below
GREATER WESTERN SYDNEY’S
HOT ISSUE
DECEMBER 2019
DIRECTOR’S FOREWORD

A FEW MONTHS AGO Sydney was witness to a sobering sight: our children
in our streets, on strike from school to protest the world’s failure to take action on
our changing climate. They chanted and sang and made passionate speeches,
with the timeless optimism of the young. Like all protest movements they carried
signs, and among many memorable one-liners was this one, held aloft by a young
girl:

If you did your job we WOULD be in school.

These words speak directly to what this paper is about.

At the Western Sydney Leadership Dialogue we don’t pretend to be experts on the
complex questions of climate change, nor do we claim to have all the answers. We
understand deeply the divisive nature of the debate.

But as a multi-stakeholder community engagement forum with a focus on Greater
Western Sydney (GWS), our job is to try to advance beyond it, to a more co-
operative place where practical solutions can be found.

Climate change is just a set of practical problems, but for those in GWS, they are
now urgent ones. Urban Heat Island effect in the region’s dense suburbs, and
bushlands on the outer fringes, means that few Sydneysiders will be harder hit by
rising temperatures and fiercer fires. This summer may be our most challenging
ever. GWS must lead in changing our basic utilities of life, such as how we
manage our water, energy and waste, to make them more sustainable.

Our kids have reminded us that the time for divided inaction has passed. We
need practical ideas and coherent strategies that all Australians, regardless of
our views, can get behind. The recommendations in WESTERN SYDNEY’S HOT
ISSUE are our suggestions for what some might look like, and our best shot at
responding — like grown-ups — to that young girl’s optimistic plea.

Finally, I would like to thank the Dialogue team for all their hard work researching
and producing this paper, and in particular Jack Robertson who has driven this
important contribution to the ongoing discussion on the impact of climate change
on our region.

                       ADAM LETO
                       EXECUTIVE DIRECTOR
                       WESTERN SYDNEY LEADERSHIP DIALOGUE
                       adam@westernsydney.org.au

WESTERN SYDNEY’S HOT ISSUE| westernsydney.org.au | December 2019
CONTENTS

     Executive Summary 							04

     Beyond the climate change wars					           09
     A whole-of-community working bee 				         13
     Greater Western Sydney’s risk factors 				    14
     Heat in Greater Western Sydney 					          15
     Water in Greater Western Sydney 					         17
     Waste in Greater Western Sydney 					         21
     Linear to circular utilities						27
     Utilities’ challenges and opportunities				   28

     Recommendations 							30
      Putting the water market to work 					       31
      Expanding waste stewardship 					36
      LGA greening and cooling 						43
      Demand managing our energy 					             49
      Inventing the green utilities future 				    54

     References 								59

                                                    3
EXECUTIVE SUMMARY

WESTERN SYDNEY’S HOT ISSUE| westernsydney.org.au | December 2019
THE WORSENING DROUGHT, record low dam levels and early start to
the bushfire season have confirmed the need for practical action in response
to rising temperatures and increasingly volatile weather patterns. The shift in
public perceptions already underway is accelerating. Overwhelmingly, Australians
now want to stop arguing about climate change and take steps to mitigate its
worsening impact.
That impact is felt more intensely in Greater Western Sydney (GWS) than in other
parts of Sydney, and for people living in the region it is a day-to-day reality, not a
far-off problem for future generations and future governments to solve.
A transforming built environment, fewer green spaces and natural waterways,
more concentrated traffic pollution and a lack of sea breeze creates an Urban
Heat Island effect which can lead to temperatures in GWS 10 to 15 degrees
above those in Sydney’s east. As climate change progresses, its impact on health,
productivity and amenity will be felt first and most ferociously by those living in
the region. For this reason, climate change is Western Sydney’s Hot Issue and
the Dialogue believes a focus on our utilities is the best way to circumvent the
raucous and unproductive policy debate around national or global solutions.
Notwithstanding the now infamous intransigence at the policy and political
level and the need for a collaborative community effort, our recommendations
call strongly on government to lead. While the community’s expectations for
big sweeping policy solutions are tragically low, it is not unreasonable to ask
for practical solutions to the here-and-now side-effects of climate change, and
to question the fairness of the community bearing the burden of policy failures
past – we deserve better than to have to accept load shedding in our energy grid
whenever there is a heatwave, for example.
In the utilities space, there are a myriad of small actions that can add up to a
giant leap in addressing the Hot Issue.
HEAT, WATER AND WASTE IN GWS
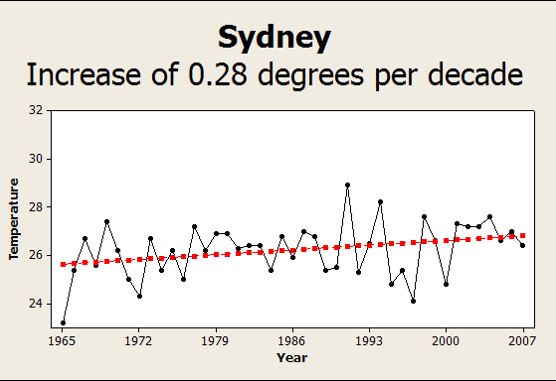
Since 1965 the mean maximum January temperature in GWS has increased over
twice as much as it has in the rest of Sydney, and the number of January days
over 35 degrees has grown ten times more. Sydney’s water usage and leakage
rates are high, and our water recycling rate is low in comparison to other major
Australian cities and many overseas jurisdictions. Following changes to recycling
export markets and with population growth and infrastructure activity continuing
apace, Sydney’s excessive per capita waste generation, modest recycling
performance and virtually non-existent waste-to-energy recovery capacity now
also demands a complete rethink.
5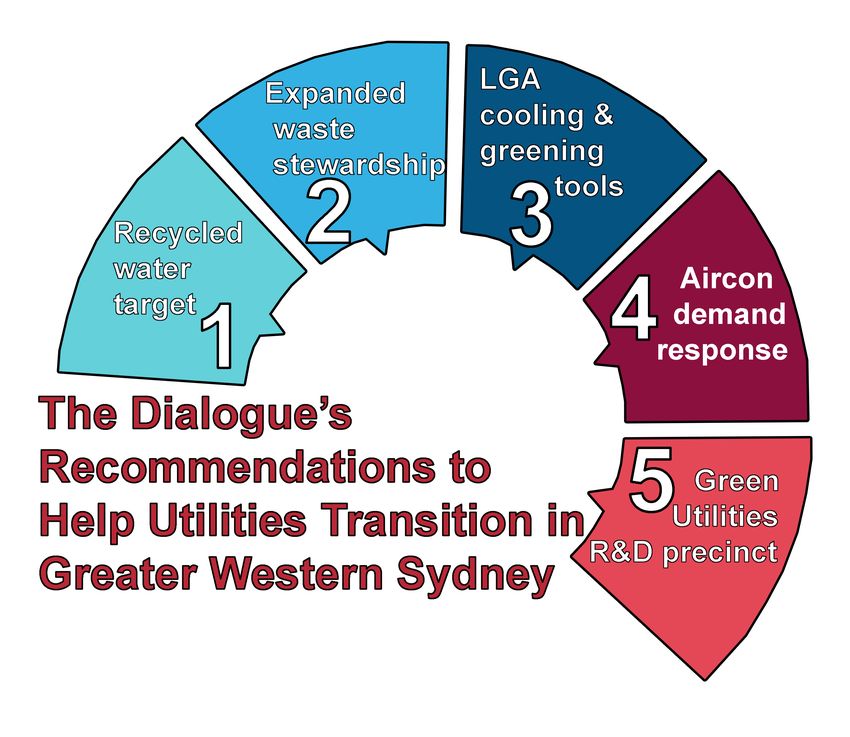
UTILITY TRANSITION AND GREATER WESTERN SYDNEY
This city is getting hotter, squandering too much water and producing too much waste. The extra urgency
of these converging ‘basic provisions’ factors in GWS, combined with ambitious projected growth rates and
ageing existing utilities infrastructure, now demand the region to take the lead in calling for disruptive but
coherent strategic change to our utilities networks: how we provide ourselves with food and water, shelter and
sanitation, energy and communications.

The necessary transition will be away from the existing Linear Economy utility networks, of centralised large-
scale generation, one-way distribution, and inefficient single-use consumption, towards Circular Economy
models. In this more environmentally sustainable approach, the currently ‘siloed’ utilities functions,
feedstocks and outputs will become progressively integrated and coordinated, minimising waste and
carbon footprint and maximising consumption efficiencies. The transition will be complex, expensive and
multigenerational, with much of the operational detail necessarily refined ‘as we go’. It will demand an
epic collective effort in practical problem-solving, one we need to start now. With this in mind, the Dialogue
recommends five immediate bold policy steps, to kickstart a whole-of-community utilities transition ‘working
bee’ – or at least to focus discussion beyond the ‘climate change wars’.

OUR RECOMMENDATIONS ARE GUIDED BY FIVE TRANSITIONAL PRINCIPLES:
1.   Political and public service leadership will be vital.
2.   Whole-of-community participation, however, is what will make or break successful transition.
3.   Expertise must prevail — as must our individual agency for collective change.
4.   Cooperative goodwill between the commercial and not-for-profit sectors is critical.
5.   No-one gets left behind in this utilities transition.

WESTERN SYDNEY’S HOT ISSUE| westernsydney.org.au | December 2019
RECOMMENDATIONS

PUTTING THE        We recommend that a twinned target of 100 Gigalitres/20% of recycled water in
SYDNEY WATER       Sydney’s water use ‘budget’ by 2030 be set as a standing Premier’s Priority. Last
MARKET TO          year Sydney consumed a massive 210 litres per day per resident, which is much
WORK: A HARD       more than most Australians. Most of this we used only once and then flushed
RECYCLING          wastefully out to sea. Meanwhile recycled water represented less than seven
TARGET             percent of our total consumption, lagging far behind national and world’s best

1
                   practice.

                   Reusing drinking water for other purposes doesn’t just ease our dependence on
                   unpredictable rainfall, it also retains our most powerful ‘cooling and greening’ tool
                   in our local communities, helping keep temperatures down in our suburbs. Our
                   poor water recycling performance is largely the result of an inefficient water sector
                   framework, in which neither the supplier, Sydney Water, nor the many private
                   sector specialists can fully deploy their world-class expertise. A recycling ‘hard

2
                   target’ is the strategic spur that will drive a long-overdue recalibration, and put
                   Sydney’s water market properly to work.

EXPANDING          We recommend a whole-of-community ‘stewardship of waste’ pilot project to
WASTE              reduce our use of non-recyclable takeaway coffee cups. We call on the NSW
STEWARDSHIP:       Government to lead it by committing to avoid these problem-waste items in all
SOLVING OUR        procurement, and the rest of us to join in by choosing reusable or compostable
TAKEAWAY           options, too. Expanding waste stewardship, which prices the full cost of
COFFEE PROBLEM     consumption into our purchases, is the key to maintaining our high standard of

3
                   living while reducing its current unsustainable waste byproducts.

LGA GREENING       We recommend that our local Councils’ individual capacity to lead the fight
AND COOLING:       against Western Sydney’s Hot Issue in their own communities be enhanced,
EQUIPPING          where necessary by sharpening, streamlining and devolving to them the planning
OUR COUNCILS       authority and tools that determine how their built environments evolve. No-one is
FOR THE FIGHT      better placed to keep their own suburbs cool and sustainable than those who live,
AGAINST URBAN      work and govern in them. Sydney’s planning framework must recognise this, and
HEAT

4
                   facilitate their doing so.

MANAGING           We recommend that the NSW government lead in a whole-of-community easing of
ENERGY DEMAND:     our dependence on excessive air-conditioning, by adopting a minimum thermostat
WEANING            setting of 25 degrees in government premises — and inviting us to do the same.
OURSELVES OFF      Abundant electricity has eroded our capacity for energy self-discipline, nowhere
UNSUSTAINABLE      more so than with our emissions-intensive air-con. This is now a critical grid
AIR-CONDITIONING   overload issue in our worsening summers. We all need to moderate – only slightly

5
                   – our ‘need’ to live in fridges.

INVENTING OUR      Finally, we recommend that a strategic ‘green utilities’ precinct be established
SUSTAINABLE        in the existing light industrial zone of Camellia. Our utilities transition will need
FUTURE: A ‘GREEN   a dedicated strategic hub for the coordinated development of integrated green
UTILITIES’ R&D     technologies, new green research and trade skills, and recalibrated investment
PRECINCT FOR       and project delivery models. Camellia, integrated within, but sensitively delineated
CAMELLIA           from, precisely the kind of dense urban infill areas that our utilities transition will
                   ultimately benefit the most, fits the bill well.
                                                                                                        7
WESTERN SYDNEY’S HOT ISSUE| westernsydney.org.au | December 2019
BEYOND THE
CLIMATE CHANGE WARS

                      9
THE WESTERN ARGUING about Climate Change is now pointless. The only people
still doing so are those of us who aren’t Climate Change experts. So
SYDNEY whether we’re right or wrong, we’re just blowing more hot air into the
LEADERSHIP atmosphere.
DIALOGUE DOESN’T Which is the last thing it needs.
CARE WHETHER OR
NOT YOU ‘BELIEVE’ Our experts stopped arguing about it long ago. The global community
IN CLIMATE of climate scientists, field researchers, technicians, data analysts and
modellers, along with every credible peak body on the planet, has been
CHANGE in broad consensus about the threat of Climate Change for decades.
Lately they’ve been joined by a growing international network of policy
negotiators, investment and insurance risk strategists, not-for-profit
advocates and, of course, billions of ordinary people all over the planet,
who simply want to safeguard their children’s future.
That‘s just the adults. We all know what our kids have had to say about
it lately.
It doesn’t matter now that we’ve taken longer than we should have to
recognise the danger we’re putting ourselves in. It doesn’t matter now
who was right and who was wrong yesterday. All that matters now is
what we do today and tomorrow. Thankfully, more and more of us are
agreeing with those who actually know what they’re talking about: our
climate experts.
The latest surveys indicate that a clear and growing majority of
WE’RE SIMPLY Australians are now deeply worried about Climate Change, and want
URGING EVERYONE our community to listen to what they are telling us we need to do to stay
TO DO THEIR BIT, safe. 1
IN A COLLECTIVE This is as it should be in any rational, democratic community, whether
COMMUNITY the problem we’re worried about is a bushfire approaching the edge of
EFFORT TO town, an outbreak of measles in our daycare centres, or the structural
cracks that suddenly appear in our high rise investment property. When
CHANGE THE in doubt? Call in the experts. Listen to their expert advice. Act on it.
WAY WE PROVIDE It’s hard to argue with that approach to community problem-solving. So
OURSELVES WITH let’s not. Not any more. Not for any longer.
LIFE’S BASICS —
WITHOUT LOSING There’s a lot to do. And not a lot of time to do it.
ANY OF ITS QUALITY The best place to start? With the basic practicalities of life.
WESTERN SYDNEY’S HOT ISSUE| westernsydney.org.au | December 2019“WE CULTIVATED OUR LAND, JUST ANOTHER UTILITIES UPGRADE, IN A
60,000+ YEAR ROLLING RENOVATION
BUT IN A WAY DIFFERENT
FROM THE WHITE MAN. WE The women and men who provide us with the basic
ENDEAVOURED TO LIVE WITH needs of living – our food and water, our shelter and
sanitation, our energy and communications – are
THE LAND; THEY SEEMED TO the best at what they do in the world. They’ve had to
LIVE OFF IT. I WAS TAUGHT be. Australia is as harsh an environment as any on
the planet. The magnificent living standards they’ve
TO PRESERVE, NEVER TO helped create in our country are testament to their
DESTROY.” ingenuity and hard work.
Indigenous Elder2
But it’s wrong to presume that by ‘utilities’ we mean
only the systems and methods we late arrivals
brought with us, and have refined continuously
since. Wrong – and a colossal missed opportunity
to emulate the truly time-proven experts at living
efficiently in our tricky, unforgiving geography. As
successful as our modern solutions have been
over the last few centuries, they’ve also engineered
“WHAT IS UNDERWAY IS some serious problems we will now have to rebuild
A TRANSITION TO A LOW- ourselves beyond. Business as usual just won’t cut it
any longer.
CARBON FUTURE. THAT
DIRECTION IS IRREVERSIBLE There’s much to learn from the masters of Australian
sustainable living. Sixty thousand years’ worth, and
AND THE SMART MONEY still counting.
HAS WORKED THAT OUT
AND CAN SEE GLOBALLY
THE TRILLIONS OF DOLLARS
OF INFRASTRUCTURE
REQUIRED…”
Geoffrey Summerhayes3
Australian Prudential Regulation Authority
& Sustainable Insurance Forum
11“NO ONE IS TOO WHATEVER OUR SIZE, WE ALL HAVE TO PULL OUR WEIGHT
SMALL TO MAKE A Everyone has to pitch in and we need to get cracking. To develop and
DIFFERENCE” take even more of the strategic and practical courses of action than
Greta Thunberg4 many of us already are. It’s not going to be easy to move beyond divisive
public arguments and contested symbolic gesturing, because the
contradictions and complexities involved in changing our day-to-day
systems of living can often feel intimidating, even overwhelming. No
solution is a magic bullet. There is no cure-all medicine. Every useful
option we have has its downsides and its drawbacks — and its losers.
This means that every practical suggestion anyone makes will have its
critics. Often their criticisms will be fierce – and entirely valid. It will be
tempting to fall into the oldest trap there is for public policy makers. But:
“YES, THERE IS Allowing ‘the perfect to become the enemy of the good’ will
mean continuing utilities transition paralysis – and Climate
URGENCY, BUT Change suicide.
WE STILL HAVE We don’t have to solve every problem at once. No single solution needs
AGENCY.” to be perfect. Let’s just roll up our sleeves and get on with the jobs, big
Michael E. Mann5, US Climate or little, that each of us is able to do in a whole-of-community utilities
Change expert transition “working bee”.
WESTERN SYDNEY’S HOT ISSUE| westernsydney.org.au | December 2019A WHOLE-OF-COMMUNITY
WORKING BEE
POLITICAL AND BUT OUR EXPERTISE MUST COMMERCIAL AND
PUBLIC SERVICE COLLECTIVE PREVAIL ANEW NOT-FOR-PROFIT
LEADERSHIP RESPONSE IS KEY COOPERATION IS
MATTERS VITAL
To make disruptive It’s not really how This shouldn’t need Both the commercial and
changes, someone our leaders lead that saying but we live in odd NFP advocacy sectors
needs to go first. It will matter in this times, in which certain will need to bring to
needn’t always be our transformation. It’s kinds of expertise bear their unique and
politicians and public whether the rest of arouses suspicion, if equally critical strengths.
servants, but the us follow, or not. Our not hostility. It’s obvious To transform how our
complexity of utilities recommendations we must heed our community provisions
transition demands maximise the sharing utilities experts to get all its individuals’ basic
it in this case. Only around of the hardest this transition right, but needs, we require both
those with oversight work of utilities a return of respect for tool-sets – and a tonne
of all parts of our civic transition. specialised excellence of co-operative goodwill.
machinery can hope to needs to extend far
integrate the often- A key is going to beyond that in water, The powerful levers of
competing imperatives be changing our energy, waste and a vibrant marketplace:
of the sector’s multiple individual lifestyles and communications. competition, risk-taking
stakeholders. In any consumption habits just innovation, consumer
case, leaders are a little bit each, adding A renewed compact of choice, positive
supposed to lead, right? up to a seismic shift at mutual trust and shared price signals for new
the community level. obligation between our green utilities, and
Our recommendations community and our disincentives for old,
hone in on challenging So when our politicians media, academic and unsustainable ones.
them to seize the most do lead us by example, policy leaders is also Above all, the collective
powerful leadership of instead of mocking and crucial to this challenge. buy-in to this transition
all: leading by example. opposing them, why not We must re-embrace our must incorporate a
get behind them? We own agency and capacity mutual obligation to
elect them, after all. for elite achievement. safeguard the common
public good, and ensure
that no one is left
behind.
NO ONE GETS LEFT BEHIND
13GREATER WESTERN SYDNEY’S
RISK FACTORS
There are many urgent reasons why Sydney’s West will lead the way in our whole-of-community transition to
more sustainable utilities:
AMBITIOUS EXISTING UTILITIES URBAN HEAT A TIMELY
GROWTH TARGETS INFRASTRUCTURE ISLAND EFFECT OPPORTUNITY FOR
AND MODELS BECOMING A BOLD LEADERSHIP
UNDER PRESSURE CRITICAL HEALTH
RISK
Over the next twenty Meanwhile, much of the The West needs all For our politicians and
years, Greater Western existing infrastructure the local cooling and our business leaders, the
Sydney (GWS) will in the Sydney’s dense greening it can get. easiest utilities strategy
become home to another middle ring is already However quickly the rest of all will be to change
1.5 million people. under stress and some of Sydney is set to heat nothing, remaining
That’s a lot of new water, is nearing its end-of-life. up, the searing impact of politically ‘safe’ and
energy and waste needs, Especially our ocean heat-absorbing buildings commercially reactive by
with the distances outfall feeder networks, and roads, fewer green assuring everyone that
involved – for pipes, via which we squander open spaces, heavy what we’ve done in the
grids, waste trucks – a whole Sydney Harbour pollution and no sea past will go on working
always lengthening. of perfectly good water breezes will always in the future. Until the
‘Business as usual’ each year. Rather than ensure that the west utilities crisis hits, when
(BAU) simply won’t cut it. paying a fortune to keep gets hotter, faster, and voters and shareholders
pumping that abundant for longer. This is no will invariably demand
resource uselessly out to longer just a matter of action.
sea, let’s keep its cooling comfort or productivity.
and greening qualities In the West, Urban Heat
close to home. Island (UHI) effect is now
literally a life-or-death
issue.
WESTERN SYDNEY’S HOT ISSUE| westernsydney.org.au | December 2019HEAT IN
GREATER WESTERN SYDNEY
This paper is called Western Sydney’s Hot Issue for good reason. We know the
world has been warming for at least half a century6. GWS’s higher risk factors
mean that those living here have felt it much more than most Sydneysiders.
Temperature trends well-documented by the Bureau of Meteorology record, with a
sweat-inducing absence of ambiguity, the disproportionately high rate of increase
in GWS7:
Parts
PartsofofWestern
WesternSydney,
Sydney,such suchasasRichmond,
Richmond,will willexperience
experienceeven evenmoremoreextreme
extremeheat heat
days:
days:upan
...and uptoalarmingly
to6767per
peryear
year byby2090.
Parts
iniquitous2090. CSIRO
CSIROand
of increase
Western and the
inSydney,
the theBureau
Bureau
such
total asofRichmond,
number ofMeteorology
ofMeteorology
days per will
year(BoM)
(BoM)
overproject
experience project
35°C even m
that
thatacross
acrossWestern
WesternSydney
Sydney between
between a a
quarter
quarter andand a a
third
third ofofsummer
summer
days: up to 67 per year by 2090. CSIRO and the Bureau of Meteorol days
days will
willbebeover
over
Parts of Western Sydney, such as Richmond, will experience even more extreme heat
3535degrees
degreesbyby2090.
2090. that across Western Sydney between a quarter and a third of summ
days: up to 67 per year by 2090. CSIRO and the Bureau of Meteorology (BoM) project
35 degrees by 2090.
that
The across
Thedata
dataalsoWestern
also
predicts Sydney
predicts large between
increasesainquarter
largeincreases indays
daysover and40a40degrees,
over third of summer
degrees, from days will
fromWestern
Western be over
Sydney’s
Sydney’s
35 degrees
historical
historical by 2090.
average
average ofof1 1day
dayover
The over40
data 40degrees
also degrees
predicts per per
year
largeyear upuptoto1212
increases days
in days
daysover
over
over 4040
40degrees
degrees
degrees, per
per
from
year
yearbyby2090.
2090.Some
SomepartspartsofofWestern
Western Sydney
Sydney will
willexperience
experience even
even more
more
historical average of 1 day over 40 degrees per year up to 12 days o extreme
extreme heat
heat
The data also predicts large increases in days over 40 degrees, from Western Sydney’s
days,
days,including
includingRichmond
Richmondyearwith
with
by upuptoto17
2090. 17days
Some days per
parts peryear
of yearover
over40Sydney
Western 40degrees
degreeswillbyby2090.
2090. even m
experience
historical average of 1 day over 40 degrees per year up to 12 days over 40 degrees per
days, including Richmond with up to 17 days per year over 40 degre
year by 2090.
Climate
Climate change
changeSome
will parts
willnot of Western
notaffect
affecteveryone
everyoneSydney
equally.willPeople
equally. experience
PeopleininWesterneven more
Western Sydney extreme
Sydney will heat
willendure
endure
days,
more
more including
hot
hotdays Richmond
daysthan
thanpeople
peoplewith
Climate up
ininother toparts
other
change 17 days
parts
will ofnot per
ofthe
the year
state, over
state,
affect
Greening
40 degrees
asasshown
everyone
Australia, shown
based in by
inFigure
equally.
on Burea Figure 2090.
2 2below:
People below:
of Meteorology indata
Western
more hot days than people in other parts of the state, as shown in F
Climate
Figure
These change
Figure2:numbers
2:Days will
Daysover
overnot
won’t affect
3535degrees
degrees
surprise everyone
inanyone equally.
inselected
selected People
locations
livinglocations
with in Western
the(current
(current
impact UHISydney
policies
ofpolicies willGWS.
scenario)
scenario)
effect in endure
Modelling by the Australia
more hot days than people Institute’s
in 2:
other Western Sydney Heatwatch 8
shows that the
Figure Daysparts
overof35the state, as
degrees shown inlocations
in selected Figure 2 below:
(current polici
trends will accelerate if we continue
Historical
Historical utilities
2030
2030 BAU.2070
2050
2050 2070 20902090
Figure 2: Days over 35 degrees in selected locations (current policies scenario)
6767 Historical 2030 2050 2070 2090
7070
5959 67
6060 70Historical 2030 2050 2070 2090
5252
4848 59
67 60
Days per year over 35 degrees
5050
70 4343
4343 52
48 3737
4040
60 50 59 3737
43
3333 52 43
2929 3030 37 37
3030 48 40 2626
50 2525 33 2424 43
2222 43 30 2222
1818 37 29 1919
2020 1515
40 30 25 1515 24 1616 37 1616 26
33 1313 1111 22 1212
2920 8 8 30 18 19 9 9
1010
30 25 15
24
7 7 26 154 47 7 16
22 13 11 22 12
18 19 8 7
0 0 15
20 10 15 16 16
13 11Camden 12
Richmond
Richmond Penrith
Penrith Camden Parramatta
Parramatta Bankstown
Bankstown Coogee
Coogee
9
0 8 7 7
10 4
Richmond Penrith Camden Parramatta
Eastern Bankstown
Eastern
0 Going
GoingWest
West Suburbs
Suburbs
Richmond Penrith Camden Parramatta Bankstown
Going West
Coogee 15
Source:
Source:
CSIRO
CSIRO
and
and
Bureau
Bureau
ofof
Meteorology
Meteorology
(2018)
(2018)
Climate
Climate
projections,
projections,
provided
provided
onon
request
request
EasternWHAT WILL BE THE IMPACT OF HOTTER DAYS — AND MANY MORE OF THEM?
Health: Studies suggest that unmitigated UHI effect can increase heat-related deaths in
GWS to as many as 14 per 100,000 people, compared to a coastal average of 59.
Productivity: Lost productivity due to extreme heat in Australia in 2013-14 was estimated at
costing $6.9 billon10. Southeast Australia’s 2009 heatwave blackouts cost its
economy $800m and overall caused 874 deaths11.
Infrastructure: Hotter temperatures increase stresses on water pipes and pumps, roads and
public transport, power lines, substations and transformers. GWS’s electricity
demand doubles with a temperature rise from 20 to 40’C12.
Amenity: The hotter it gets, the harder and unhappier life becomes for everyone.
WHAT DO WE NEED TO DO ON HEAT?
To keep our suburbs cooler we’ll need to:
Green our local A powerful coolant of urban communities is ‘green infrastructure’. An abundance
communities of trees, shrubs, roof gardens, parks, grass and soil surfaces brings with it
shade, rainfall and moisture retention, heat reflection and pollution-absorbing
photosynthesis.
Water our local More local green infrastructure needs more local ‘blue infrastructure’. Not simply
communities irrigation of parks and rejuvenation of rivers, but fully integrated Water Sensitive
Urban Design (WSUD). Natural watercourses and catchments, urban ponds,
pools and canals all directly mitigate UHI effect through enhanced convective and
evaporative cooling.
Plan for natural WSUD should be aligned with built design at all scales that maximises other
urban cooling natural heat mitigation strategies: airflow, orientation, size and architectural
shade, cooling surface, material and colour choices, window and door designs,
and internal watering.
And, of course, On the larger, collective scale, everything and anything at our local community
reduce GHG level – big or small – that reduces the greenhouse gas (GHG) emissions that are
emissions warming the planet will ultimately help put the brake on the temperature in our
back yards, too. Think global, act local on emissions!
WESTERN SYDNEY’S HOT ISSUE| westernsydney.org.au | December 2019WATER IN
GREATER WESTERN SYDNEY
The first and most important thing we need to do to cool down is some hard
looking at — and thinking about – how we supply ourselves with water and how
we could do it a whole lot smarter.
The current terrible drought is heart-breaking for all Australians, especially those
directly impacted. But it’s also a red herring when it comes to improving how
coastal city dwellers manage water resources. We must grasp that the important
question when it comes to provisioning our water sustainably is not ‘How much do
we have?’ It’s ‘how cleverly do we use what we have?’
On the first question, Sydneysiders have always been lucky. We live in a lush
river-fed basin surrounded by friendly hills which offer ample natural water
catchments, convenient dam sites and powerful gravity-pumping. Even in
droughts, our region’s rainfall is relatively reliable. While Warragamba Dam, the
source of 80% of our potable water, is low right now13, it’s still holding about a
trillion litres, around two years’ worth if we’re frugal. Given the plight of others
we’d be gracious to see it as half-full rather than half-empty. Especially since the
Sydney Desalination Plant can top up our supply with 250 million litres daily from
the Pacific Ocean. That capacity may soon double, meaning that regardless of
rainfall it alone could supply a third of our daily needs14.
Compared to the rest of Australia, Sydney is not ‘suffering’ from drought. And
we probably never will be. All the more reason to take an honest look at the
questions that really matter.
HOW MUCH WATER DO WE WASTE?
Even compared only to other east coast city regions – a lot. It’s not really our
fault, and as our adherence to restrictions in the last major drought proved, we
can be as self-disciplined with water as any Australian. We’ll examine why (and
how to change it) later, but the awkward fact is that on water efficiency, Sydney is
currently under-performing.
17Our performance and five-year plan
2.1 Water use in 2017-18
2017-18
Total water use (potable water and unfiltered water) 4, including 599,885 million litres (or 600 GL)
• Residential sector 65%
• Non-residential sector (industrial, commercial and 24%
government properties)
• Non-revenue water including leaks 11% (including 9% from leakage)
Observed average water use per person 324 litres a day (or 118 kL a year)
Weather corrected average per person water demand 306 litres a day (or 112 kL a year)
Historical Demand in Sydney
Population (million)* Water Demand (GL/yr)^ Demand corrected for weather
700 5.5
Water Water Restrictions Water Wise Rules
Restrictions
650
5.0
Water Demand (GL/yr)
600
Population (million)
4.5
550
4.0
500
3.5
450
400 3.0
1991
1992
1993
1994
1995
1996
1997
1998
1999
2000
2001
2002
2003
2004
2005
2006
2007
2008
2009
2010
2011
2012
2013
2014
2015
2016
2017
2018
Financial Year Ending June * estimated
^ not corrected for weather
Figure 2-1 Despite a 25% increase in population the total demand for drinking water remains lower
Sydney
than itWater figures
did before show
mandatory we can
restrictions slash
were usage
introduced rates
in late 2003.when we try.thatFurther,
It is estimated the hotter the
rise drier
in demand from 2012
weather in 2017-18 resultedmostly reflects
in a 33 GL increasepopulation not per
in demand compared capita
to what wouldgrowth.
be
expected in a our
Nonetheless, year with average weather
consumption is conditions.
still too high compared to Melbourne and
Brisbane.15
4 Sectoral splits are estimated based on available consumption data for period April 2017 to March 2018.
Water use by metropolitan jurisdiction Residential litres per capita per day
Water Conservation Report | 2017-2018 Page | 5
Sydney 210
Melbourne 161 (target of 155)
Brisbane/Gold Coast 169
Water cost and pricing Residential, per 1000 litres
Sydney $2.28, flat rate, public monopoly
Melbourne $2.64 - $4.62 (volume scale), retail
(example Yarra Valley Water) competition
Brisbane/Gold Coast $2.915, public wholesale supplier
Figures: 15 16 17 18 19
Sydney Water Corporation Million litres per day
leakage losses15
2014-15 99
2015-16 103
2016-17 114
2017-18 129.5 = over 25L per day per capita!
WESTERN SYDNEY’S HOT ISSUE| westernsydney.org.au | December 2019WATER RECYCLING: HOW DO WE RATE? THE “RIGHT WATER FOR THE RIGHT JOB”
One word: embarrassingly. Especially as the biggest Water recycling is a discussion we can’t avoid,
city in the driest continent! however awkward. Deemed too delicate and divisive,
to date merely raising the issue can send some of
Last year Sydney recycled only 6.7% of our total water us jumping to conclude we’ll be forced to drink our
provisioning budget20, with most of the rest flushed own sewerage. What is needed is a more nuanced
out to sea. discussion about water’s true worth, as a precious
and endlessly re-usable resource to be carefully
Internationally, Israel leads the world, recycling about husbanded.
90% of its ‘used’ water21. Cyprus (90% of wastewater
reused for irrigation)22 sets the pace for a Europe The banal fact is that we’re awash in ‘recycled’
rapidly if belatedly recalibrating its aspirations, with water already. Sydney’s Desalination Plant pumps
Spain already managing 20%23. Other middle-eastern 250 million litres into our taps daily (saltwater and
countries, such as Kuwait (35%)24, have long reused wastewater processing is essentially the same). Last
water well. Closer to home, Singapore’s ‘NEWater’ year St Marys Recycling Plant added 10.5 billion
now meets approximately 40% of its needs, too25. litres to the Nepean River.30 It already keeps many
Even in the USA, for years, about 10% of municipal parks, ovals and golf courses green and lush, and
wastewater has been recycled or reused26. those few of us with dual water systems on tap have
the luxury of ‘purple pipes’, for keeping their gardens
Here at home, Perth has increased its wastewater alive and their cars clean, without any drought-time
reuse by 70% over the last decade, and is aiming guilt. Meanwhile industrial users, such as those
for 45% recycling by 203027. Adelaide at 31%28 and supplied by the Rosehill Recycled Water Scheme,
Melbourne (9.5%)29 are both ahead of us, while on have come to regard their recycled feedstock as
small scales some rural town recycling arrangements far superior to regular tap water, offering many
stack up with the world’s best. commercial advantages.
So, it’s not that we can’t do it. In fact, Australians While nomenclature is important, we can’t get stuck
developed much of the world’s best-practice water on whether we refer to ‘recycled’ water, ‘premium’
recycling technology. water or ‘new’ water, when what we really mean is
the right water for the right job.
EACH YEAR WE PUMP TEN
PROSPECT RESERVOIRS OF
DRINKING WATER DOWN
FROM THE HILLS, THEN MILES
OUT TO SEA…BARELY USING
IT ON THE WAY THROUGH
OUR SWELTERING CONCRETE
JUNGLE.
19WHAT DO WE NEED TO DO ON WATER?
REDUCE PER USE THE RIGHT REDUCE OUR RATE KEEP AS MUCH
CAPITA POTABLE WATER FOR THE OF LEAKAGE LOSS WATER AS CLOSE TO
WATER USE RIGHT JOB HOME AS WE CAN
Melbournians consume Counting all water use, The hotter and drier The ultimate aim is
around 160 litres per Sydneysiders splash the ground, the more to keep more water
day, approaching their through 320 litres of prone the water pipes circulating in our
target of 155 litres using drinkable water each, running through it are communities, greening
price signals, a few every day.33 Considering to cracking, shifting — and cooling us. The NSW
rules and a whole-of- that few of us would and leakage. Our high Premier’s Priorities set
community campaign.31 actually drink more than and increasing loss rate a target of planting one
In Sydney, though per 1% of that, there is vast isn’t due to laziness or million trees over the
capita consumption has scope for more efficient incompetence from our next three years. To do
started reducing from supply chain optionality. water sector, but rather that, they’ll need a lot
last year’s 210 daily a ‘cost-benefit’ outcome of the water that we’re
litres32, we must do even of water that’s cheaper currently flushing out to
better. to let fritter away than sea, rather than using
invest in salvaging our drinking water — a
maintenance. large proportion of which
is also coming from the
sea via desalination, at
great financial and GHG
emissions cost.
WESTERN SYDNEY’S HOT ISSUE| westernsydney.org.au | December 2019WASTE IN
GREATER WESTERN SYDNEY
NATIONAL WASTE REPORT: GENERATION AND RECOVERY
Inextricably entwined with changes to how we manage our water resources will be a big rethink on our waste.
Like most developed countries, Australia produces a problematic amount of waste. In 2016-17, about 67
million tonnes (Mt) of waste, or 2.7t each. Of this, 54 Mt was ‘core waste’, managed by the waste and
resource recovery industry, comprising 20.4 Mt from the commercial and industrial sector (C&I), 20.4 Mt from
construction and demolition (C&D), and 13.8 Mt of municipal solid waste (MSW). Thirty-seven million tonnes
was recycled, 2 Mt otherwise recovered — and 27 Mt dumped in landfill or stockpiles.34
HOW DO WE STACK UP GLOBALLY?
Comparison with similar developed countries puts our waste efficiency into perspective34:
8.2 Municipal waste
Country
generation and
Australia
fate
Denmark Norway UK USA
This subsection compares 2016-17 MSW generation and fate in Australia with selected countries. The data
Recyclingfor
presented rate 62from Australia is 68
all jurisdictions apart 41 (2017), which attempts
sourced from Eunomia 74 to 45
%
report a consistent definition of MSW generation and recycling rate for a selection of developed countries
Total
for 2016 reporting period25. It 63
theresource 94rate as the percentage
defines the recycling 78 of materials75
recycled, 49
recovery %
composted and digested divided by the MSW generated.
Australia’s
Total 2016-17
recovery ratesMSW data
include was adjusted toshowing
waste-to-energy, be as consistent as possible
just how far ahead thewith the Eunomia
leading definitions.
European nations are in
This included
embracing removing
next-gen all masonry
energy materials
technologies, suchfrom the MSW
as clean stream. and biogas capture and use.
incineration
MUNICIPAL SOLID
Figure 35 compares theWASTE
adjusted per capita MSW generation in Australia with other nations as published
in Eunomia
This (2017). and local government rubbish we all generate in our homes and communities. Adjusted
is the household
comparisons provide useful context for the waste performance we’re each able to improve in our daily lives34:
Figure 35 Comparison of MSW generation and recycling rates in selected countries
The average MSW waste generation across the reported countries was around 500 kg per capita.
Australia’s
Average adjusted MSW
(developed world)waste
MSW generation
generationwas about500
is about 540kg
kgper
percapita,
capita or 9%approximately
with higher than the
50%average.
of it recycled.
Adjusted, Australia generates 540 kg per capita or 9% over average, and recycles a below-par 45%.34
The average MSW recycling rate was about 50%. Australia’s adjusted MSW recycling rate was about 45%.
21
Australia’s MSW generation and recycling rates are not far from the average of the countries compared.Comparison of recycling alone masks the extent to which other countries further recover their non-recycled
MSW — via waste-to-energy. For example, the Netherlands has a total ban on 35 kinds of household waste
going to landfill, meaning that the vast majority of the 54% they can’t recycle goes to waste-to-energy (12% of
the country’s energy generation) or clean incineration (with burn residuals in turn captured and repurposed).35
In Sweden, about half of the 98% of household waste that is recovered is incinerated for energy.36 In Australia,
almost all of the 270-280 kg of household waste we each generate yearly but don’t recycle now goes into our
bursting landfills — and ugly stockpiles.
FOOD WASTE
Of this MSW, in 2016-17 a total of 5.0 Mt was food waste, or around 200 kg of wasted food each (about 36%
of our average weekly bin contents34. Only 18% of this is recycled, with 76% going to landfill, producing vast
amounts of environmentally disastrous methane.37 The opportunity cost, in lost potential energy from food
waste, is also huge.
In other words, there’s still plenty of gains to be made in our own backyards and bins when it comes to our
daily waste. The good news is that nationally, we’re heading in the right direction, having reduced MSW since
2006 by about 10% per capita while increasing by 11% what we do recycle of it.34 As with our water efficiency,
when we put our minds to it we can easily do better on rubbish too.
NSW WASTE GENERATION AND RECYCLING
The 2016-17 national figures for NSW are partly estimates only, due to recent changes in data collection, but
they give us an idea of where the state stands.
NSW VIC QLD WA SA TAS ACT NT AUS
Core waste (annual, Mt) 18.1 13.7 11.2 5.2 4 0.9 0.9 0.4 54.4
Tonne per capita 2.37 2.13 2.25 2.01 1.15 1.71 2.15 1.62 2.16
Recycling rate 59 68 44 53 78 49 49 11 58
%
Total resource recovery 62 72 47 57 82 53 53 15 62
%
All figures National Waste Report34
WESTERN SYDNEY’S HOT ISSUE| westernsydney.org.au | December 2019While overall NSW recycling and recovery rates are around par, Australian averages tend to be dragged
upwards by generally good rates of C&I and C&D waste recovery. In NSW construction is booming, likely
skewing our comparative performance. According to the EPA38 last year our generation had risen to just over
20 Mt of waste, 4.25 Mt of it now MSW. Recent changes in overseas markets for recycling material plus the
freeze this year on the significant Mixed Waste Organic Output (MWOO) recycling industry – plus of course
Sydney’s ever-expanding population – puts more pressure on us than most parts of Australia to lift our
household waste game.
NSW WASTE AND RESOURCE RECOVERY (WARR) STRATEGY 2014-21 AND UPDATES
Our state’s 2014-15 WARR Strategy39 set out six clear key goals, of which four are directly within our individual
capacity to pitch in on. Results so far40 show we have more work to do:
KEY RESULT AREA 2020-21 TARGET 2017-18 UPDATE
Avoid/reduce waste generation Reduce waste per capita 15% increase
Increase recycling Increase MSW recycling to 70% 42% (no change)
Divert more waste from landfill Increase diversion to 75% 65% (up 2%)
Reduce litter 40% reduction (2016-17) 30% reduction
Before we get too glum, note again that the construction boom and robust economic activity associated with it
have contributed significantly to overall per capita generation. Changes to data collection methods, including
more accurate reporting from waste recovery facilities, are yet to fully wash through the system, too. We’re
also making solid progress on litter reduction, a Premier’s Priority nudged along by a focused Litter Prevention
Strategy. But in a fast-growing Sydney, we’re not doing as well as we must. Because all that rubbish has to go
somewhere.
23SO WHERE WILL IT ALL GO?
Landfill A 2017 EPA audit identified a NSW capacity of 31.8 million tonnes of putrescible
landfill space a year, representing an annual ‘gap’ of 742,000t which relied
on meeting WARR targets41. There are now only two landfills taking Sydney’s
putrescent rubbish – at Woodlawn (operated by Veolia), and at Lucas Heights
(SUEZ). No new landfills have been approved for a decade.42 For Sydney, burying
our rubbish is a rapidly diminishing option.
Export For years we’ve dispatched it on trucks, trains and ships, despite an EPA
‘proximity law’ prohibiting transport of our waste over 150km from source. In
2016-17 up to 690,000 tonnes of Sydney’s C&D43 waste was sent to Queensland
(to avoid our local levies), forcing that state to impose levies to degrade its
economic viability as our dumping ground44. As for overseas, annually NSW
exports 420,000 tonnes of waste paper alone45, but this avenue too is narrowing.
Recycling and While recycling has steadily become a central component of our waste sector and
Recovery is now set for a major scale-up, recovery of the latent energy in the waste we can’t
recycle is an option Australians still resist. This is of particular relevance to GWS,
where waste-to-energy projects have been rejected over the last decade, despite
quantum improvements in the public health and environmental credentials of
the technology, and the embrace of it internationally. Sensitively evolving public
attitudes towards proposals like an Eastern Creek waste-to-energy incinerator,
back on the table again after rejection only eighteen months ago on ‘social
license’ grounds, will be a key leadership task during our utilities transition.
WESTERN SYDNEY’S HOT ISSUE| westernsydney.org.au | December 2019“IT’S OUR WASTE WASTE AND GREATER WESTERN SYDNEY
AND IT’S OUR Waste management in GWS is as in the rest of Sydney: a mixed bin-
RESPONSIBILITY.” bag. Some Councils achieve generation and recycling rates better than
The Hon. Scott Morrison, MP average, some worse. There are great local initiatives underway in GWS,
Prime Minister of Australia47 but a rethink on waste is especially critical to the region, because GWS
invariably gets lumped with everyone’s. Whether it’s new-gen waste-
to-energy proposals as above, or just the existing array of landfills,
stockpiles, treatment centres and waste truck convoys (10% of all heavy
traffic in Sydney46), the region must accommodate much of the sector
infrastructure.
With this in mind, the Dialogue believes GWS must lead on the transition
of our waste management to a more sustainable future, exploiting the
potential jobs and skills on offer but, importantly, also ensuring the
rest of Sydney fairly pulls its weight in funding support and behaviour
change.
CHINA’S NATIONAL SWORD POLICY & COAG RESPONSE
In 2016-17 Australia exported a record high 4.3Mt of bundled-up waste
for recycling overseas, but China’s ‘National Sword’ policy of tougher
contamination standards on imported recycling feedstock saw its
traditionally high share of our junk already declining sharply (by 40%).
Since then other Asian markets for our rubbish have begun tightening
restrictions too, upending a well-established export market that at its
peak took about 43% of our discarded metals, 70% of our plastic and
43% of our paper and cardboard for recycling.34
In response, Prime Minister Morrison and the Council of Australian
Governments agreed in August 2019 to work towards a ban on all
recycling exports, flagging a major revitalisation and expansion of
the local industry47. In NSW the government has responded with a
$47 million package as part of its ongoing Waste Less, Recycle More
campaign, to assist councils and recyclers in transitioning to the supply
chain ‘new normal’.48 Meanwhile, NSW’s Energy & Environment Minister
is developing a 20-Year Waste Strategy and a Circular Economy one, too.
255R: WHAT DO WE NEED TO DO ON WASTE?
REDUCE Change the language and idea of ‘waste’
REUSE Rubbish, junk, waste — all literal and figurative throwaway words. We must
REPURPOSE instead reimagine all the things we consume as ‘5Resources’, to be used and
reused as ‘multiple-entry feedstocks’ in a ‘Hierarchy of Waste’ circular supply
RECYCLE chain.
RECOVER Reduce our per capita waste production
The most powerful 5R supply chain option is to Reduce the amount we generate
by buying less and using what we do more efficiently. Over half a ton of household
rubbish each a year puts us in the world’s top twenty of the world’s most wasteful
countries per capita49.
Reuse and repurpose
Reuse and repurpose what we used to throw away wherever possible.
Improve EVERY link in our Recycling supply chain
This will not just need governments and the waste industry to expand our
recycling infrastructure and capacity. Diligent 5R ‘feedstock quality control’ with
our kerbside bin sorting will be critical to making more recycling economically
viable.
Help grow new markets for 5R feedstocks
We need to deploy our individual consumer power in the same way government
and business procurement choices should: to grow viable 5R markets. Buy
recycled paper. Don’t buy single-use plastics. Switch to biodegradable takeaway
coffee cups.
Evolve our 5R Recovery Social License
We’ll all need to rethink what we’ll accept, including in our own back yards, as
necessary to manage our consumption sustainably. Better recovery of 5R that
can’t be recycled will need more treatment facilities and energy-to-waste projects,
demanding open-mindedness, goodwill — and fair sharing of the collective
community burden.
WESTERN SYDNEY’S HOT ISSUE| westernsydney.org.au | December 2019UPGRADING OUR UTILITIES:
LINEAR TO CIRCULAR
To transition from the old Linear to a new Circular Economy Utilities Model...
Linear Utility Model Circular Economy Model
products/
materials products/
water energy water energy
materials
5G 5G
5G
Single-use telcos
Multiple
circular
re-use
5G 5G
Discard excess Recovery
… we’ll have to solve a lot of very complex problems
BY GETTING IT RIGHT WE CAN ENSURE:
A cooler, greener, smarter, more sustainable future
• Retaining our cooling, greening water locally, in order to use the right water for the right job
• Diversifying and integrating our sources of energy generation, reducing our carbon footprint
• Creating less rubbish and harvesting more of it as abundant 5Resources for re-use
• Cost-sharing more truly across the whole supply chain, reducing our impact on the planet
A supercharged ‘next-gen’ Green Economy and a workforce to drive it
• Building an integrated utilities Australia will demand a complete recalibration of our economy
• Green utilities research and development, financing, planning, engineering and construction
• A new green utilities high-skills workforce, working to a visionary, multigenerational blueprint
• Limitless opportunities for new export markets in green utilities IP and green energy
A new standard of sustainable living for all
• Our whole-of-community transition can be a nation-building project on an epic scale
• Aligning Australian technology, ingenuity and egalitarian aspiration
• Setting a new standard of sustainable living
FOR EVERYONE ON THE PLANET TO SHARE.
27SOME KEY CHALLENGES –
AND OPPORTUNITIES
“I THINK THAT THE UTILITIES INTEGRATION AND ENGINEERING AT SCALE
REGULATORS ARE Although it’s the isolated laboratory breakthroughs that capture public
STRUGGLING TO attention and dominate discussions, this aspect of transition will
UNDERSTAND arguably be the least problematic. Just as our climate change experts
have been way ahead of us on the science, our research engineers
THE CIRCULAR are well advanced in refining the individual components of our future
ECONOMY integrated utilities. The real trick will be fitting them all together at large
BUSINESS scales.
MODELS.” INVESTMENT DE-RISKING
Lisa McLean, Somebody has to pay for the transition, and disruptive change is
Chief Executive Officer, never risk-free. Securing the billions that will be needed over long ROI
Open Cities Alliance50 timelines, for integrated utilities projects even the utilities experts
themselves haven’t fully conceptualised yet, is a huge financial
challenge.
COST-DISTRIBUTION AND PRICING
Equally complex will be customer cost distribution and pricing
mechanisms once they are completed. Current linear arrangements
make it viable to price in user-pays certainty and distribute shared
asset costs equally with service charges. But when the whole point of
transition is to move away from large, environmentally-unsustainable
frameworks – getting us all progressively ‘off grid’ – who’ll pay for
those common infrastructure components still needed? The energy
sector is already grappling with the even thornier matter of ‘prosumers’:
renewable energy (RE) producer-consumers who don’t want to ‘chip in’
for the shared electricity grid they think they’ll no longer need, instead
expecting to be paid for their RE inputs back into it.
PUBLIC UTILITIES, PRIVATE PROPERTY
Then there’s the matter of ownership and jurisdiction – and finding
somewhere to put things. Sydney’s existing utilities were largely created
on our then-plentiful public lands. These days – in the greenfields of the
Western Sydney Airport and the Aerotropolis especially – most suitable
land is privately owned. And expensive!
WESTERN SYDNEY’S HOT ISSUE| westernsydney.org.au | December 2019“HOW THE HELL MANAGEMENT AND CO-ORDINATION
ARE WE GOING How will we coordinate the long process of transitional integration?
TO CREATE A Public-private partnerships? Joint commercial ventures? Re-
PUBLIC DOMAIN nationalisation? There are growing calls for a state-appointed
‘Utilities Commissioner’, potentially sitting within the Greater Sydney
[FOR INTEGRATED Commission, to coordinate this activity across the rapidly growing and
UTILITIES] WHEN developing Sydney area.
WE DON’T OWN ANY AN EVOLVING UTILITIES ‘SOCIAL LICENSE’
LAND?”
Last – and anything but the least of our challenges – will be ensuring
Geoff Roberts AM, that everyone, in every community, is included in the transition. The
Chief Coordinator, change in the way we provision ourselves will demand above all else
Western Parkland City50 a recalibration of our shared utilities ‘social license’. The most vital
task will be ensuring no-one gets left behind, or lumped with the easy
‘solution’ to everyone else’s utilities needs. We cannot outsource
problems to others.
29RECOMMENDATIONS WE LEARN BEST by ‘having a go’, so here are some specific policy ideas to kick the transition along. Our recommendations seek to contribute to a whole-of-community approach from a few different angles, while adding to the public discussion that’s already well underway. WESTERN SYDNEY’S HOT ISSUE| westernsydney.org.au | December 2019
1   PUTTING THE WATER
    MARKET TO WORK

    THE DIALOGUE RECOMMENDS THAT A TARGET
    OF 100GL/20% OF RECYCLED WATER IN
    SYDNEY’S WATER BUDGET BY 2030 BE MADE A
    STANDING PREMIER’S PRIORITY
    GETTING THE BEST OF BOTH WORLDS
    Sydney’s water marketplace isn’t working as well as it could — and must. Making
    the necessary strategic changes won’t be easy, because like our national
    electricity system, our water utilities have become a complicated machine of
    many moving parts. As things stand, these often have clashing imperatives.
    We’re all aware of the agonised evolution now finally underway in our even more
    complex energy marketplaces. Sydney’s water sector faces very similar transition
    challenges.

    PUBLIC MONOPOLY TO MIXED MARKET
    For over a century our water and wastewater services were provided by a
    straightforward public utility under the direct control of our elected politicians
    and their public servants, funded by taxpayers and delivered via centralised
    budgeting, planning and management. It’s easy to overlook just how brilliantly
    it has worked. Our evolving Water Board, and since 1995 its corporatised
    descendant, Sydney Water Corporation (SWC)51, has unfussily furnished us
    all with a mundane daily miracle on a mass scale: unlimited clean water and
    impeccable sanitation. No one familiar with the many international cities that still
    lack these basics will take this magnificent achievement for granted.

    But after corporatisation in 1995, it quickly became clear that to ensure the
    realisation of its full benefits – efficiencies, innovation, investment diversity and
    sustainability – the broad monopoly SWC retains needed a commercial nudge. In
    2006 the Water Industry Competition Act (WICA) set out the rules and roadmap
    by which private water companies could enter – enhance, invigorate — the ever-
    dependable stalwart’s domain.

    The detailed history of how it’s since unfolded is complicated, often contentious,
    and beyond this paper’s scope. It’s certainly not a simple tale of ‘good guys’, ‘bad
    guys’ and the relative merits of public versus private activity. Continued bickering
    about yesterday simply risks squandering the world-class expertise in both camps,
    united in their passion to show us non-experts what they can really do with our
    water, if only we’d extend them the upgraded marketplace — and recalibrated
    social license – to empower them to get on with it together.

                                                                                      31
You can also read