2019 WWW.INFRASTRUCTUREREPORTCARD.ORG/HAWAII - American Society of Civil Engineers
←
→
Page content transcription
If your browser does not render page correctly, please read the page content below
2019

       American Society of Civil Engineers

WWW.INFRASTRUCTUREREPORTCARD.ORG/HAWAII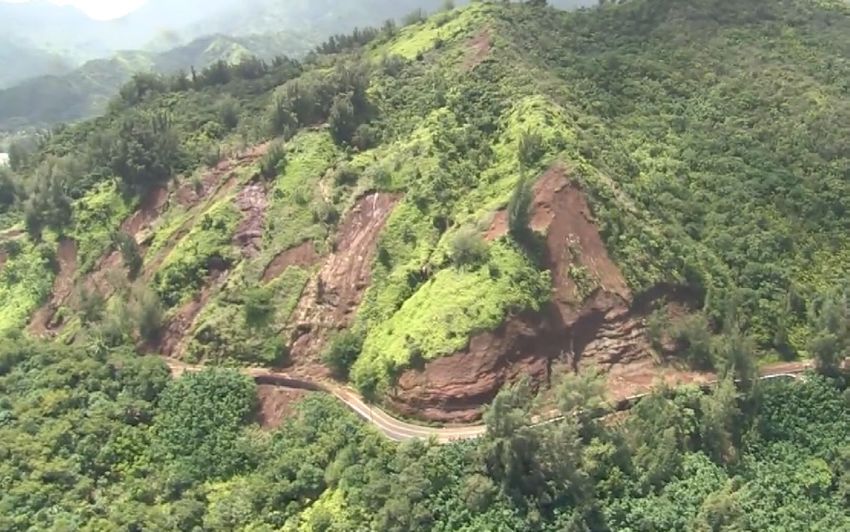
TABLE OF CONTENTS
EXECUTIVE SUMMARY...............................................................................................................................................3

ABOUT THE INFRASTRUCTURE REPORT CARD....................................................................................................4

GRADING SCALE........................................................................................................................................................5

HAWAII INFRASTRUCTURE GRADES SUMMARY...................................................................................................6

RECOMMENDATIONS TO RAISE THE GRADE.........................................................................................................7

INFRASTRUCTURE GRADES BY CATEGORY:............................................................................................................

            AVIATION......................................................................................................................................8

            BRIDGES......................................................................................................................................12

            COASTAL AREAS .....................................................................................................................................................16

            DAMS.....................................................................................................................................19

            DRINKING WATER.......................................................................................................................................22

            ENERGY.....................................................................................................................................32

            ROADS.....................................................................................................................................36

            SCHOOLS.....................................................................................................................................42

            SOLID WASTE..............................................................................................................................................47

            STORMWATER..................................................................................................................52

            WASTEWATER....................................................................................................................................57

GET INVOLVED..........................................................................................................................................................64

ABOUT THE HAWAII SECTION OF ASCE...........................................................................................................65

                                                                                                       INFRASTRUCTUREREPORTCARD.ORG/HAWAII | 2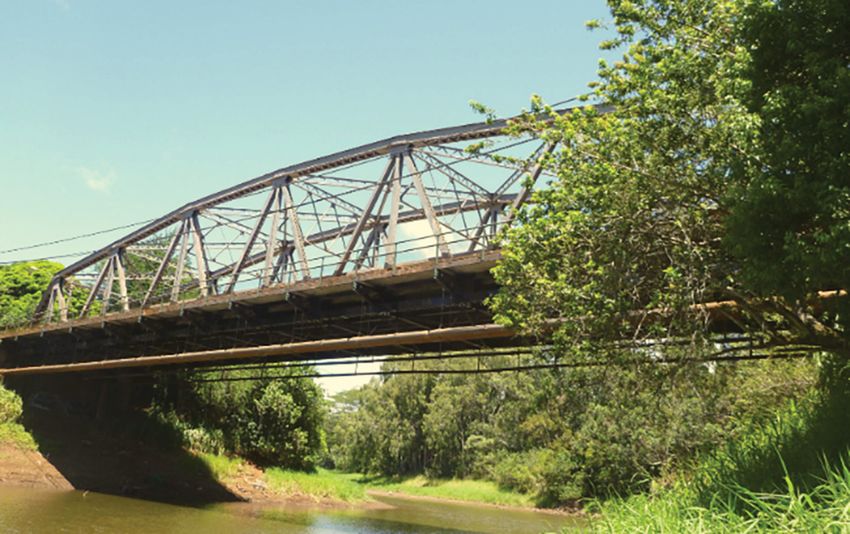
EXECUTIVE SUMMARY
Often overlooked, infrastructure is vital to our daily lives. Whether we’re flying from one island to another,
swimming at the beach, or drinking water from the tap, infrastructure plays an important role in not only
providing ground and air transportation but also in keeping our waters clean and preserving Hawaii’s natural
environment.
In an effort to help Hawaii’s residents and policy makers understand the needs of its infrastructure, the ASCE
Hawaii Chapter developed this inaugural 2019 Infrastructure Report Card. This report provides an evaluation
of some of Hawaii’s key areas of infrastructure, including aviation, bridges, coastal areas, dams, energy,
roads, schools, solid waste, stormwater, wastewater, and drinking water. Common challenges facing Hawaii’s
infrastructure across the board include aging infrastructure, lack of funding, and sea level rise.
The majority of Hawaii’s infrastructure has been operating beyond its useful life, and some components of
systems are over 100 years old. Due to a lack of funding, it has been difficult to effectively maintain and
improve the existing infrastructure systems to keep up with increasing usage and rapidly changing lifestyles.
As population, economic growth, and development increase, the strain on Hawaii’s infrastructure will continue
to escalate with many of its infrastructure systems struggling to stay in operable condition. Water main breaks,
flood water damage, loss of property from coastal erosion, and beach and park closures from brown water
advisories are all results of deteriorating infrastructure. The slow but steady sea level increases in the coming
years will also present new challenges that will threaten not only our infrastructure, but also our iconic beaches
and coastlines.
As we continue to face these challenges, Hawaii must decide how important infrastructure is to our daily lives
and what we want to prioritize moving forward. We hope this report will provide some insight into Hawaii’s
infrastructure.

                                                                   INFRASTRUCTUREREPORTCARD.ORG/HAWAII | 3
ABOUT THE INFRASTRUCTURE REPORT CARD
GRADING CRITERIA

The Hawaii 2019 Report Card Committee is a group of dedicated                   Aviation
                                                                                                         Bridges
                                                                                                                      Coastal A
civil engineers from Hawaii, who volunteer their time to collect and                                                              reas
                                                                                                                                             Dams

analyze data, prepare, review, and revise each section, and develop
the final Report Card. The committee worked with the ASCE’s                     C-                   C+
Committee on America’s Infrastructure and ASCE Infrastructure              Drinking W                                  C-
                                                                                        ater
                                                                                                    Energy                                 D
Initiative staff to provide Hawaii with a snapshot of the state of our                                                Roads
                                                                                                                                         Schools
infrastructure, as it relates to us at home, and on a national basis.
                                                                             D+
                                                                                                    C-
                                                                                Solid Was
                                                                                               te
                                                                                                                      D+                 D+
                                                                                                         Stormwater
                                                                                                                         Wastewate
                                                                                                                                   r

                                                                                     Av
                                                                                     iati
                                                                                                            on

                                                                                  C
                                                                                                         D-
                                                                                                                        D+

The Report Card Sections are analyzed based on the following eight criteria:

CAPACITY                                                  PUBLIC SAFETY
Does the infrastructure’s capacity meet current and       To what extent is the public’s safety jeopardized by
future demands?                                           the condition of the infrastructure and what could be
                                                          the consequences of failure?
CONDITION
What is the infrastructure’s existing and near-future     RESILIENCE
physical condition?                                       What is the infrastructure system’s capability to
                                                          prevent or protect against significant multi- hazard
FUNDING                                                   threats and incidents? How able is it to quickly
What is the current level of funding from all levels      recover and reconstitute critical services with
of government for the infrastructure category as          minimum consequences for public safety and health,
compared to the estimated funding need?                   the economy, and national security?

FUTURE NEED                                               INNOVATION
What is the cost to improve the infrastructure? Will      What new and innovative techniques, materials,
future funding prospects address the need?                technologies, and delivery methods are being
                                                          implemented to improve the infrastructure?
OPERATION AND MAINTENANCE
What is the owners’ ability to operate and maintain
the infrastructure properly? Is the infrastructure in
compliance with government regulations?

                                                                   INFRASTRUCTUREREPORTCARD.ORG/HAWAII | 4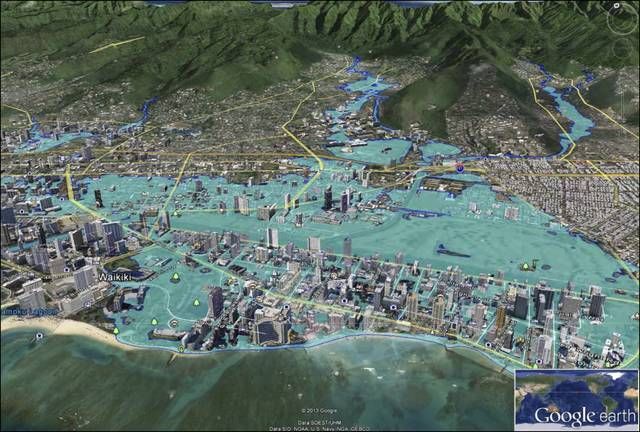
GRADING SCALE
     EXCEPTIONAL: FIT FOR THE FUTURE
     The infrastructure in the system or network is generally in excellent condition, typically new or
     recently rehabilitated, and meets capacity needs for the future. A few elements show signs of
     general deterioration that require attention. Facilities meet modern standards for functionality
     and resilient to withstand most disasters and severe weather events.

     GOOD: ADEQUATE FOR NOW
     The infrastructure in the system or network is in good to excellent condition; some elements
     show signs of general deterioration that require attention. A few elements exhibit significant
     deficiencies. Safe and reliable with minimal capacity issues and minimal risk.

     MEDIOCRE: REQUIRES ATTENTION
     The infrastructure in the system or network is in fair to good condition; it shows general
     signs of deterioration and requires attention. Some elements exhibit significant deficiencies in
     conditions and functionality, with increasing vulnerability to risk.

     POOR: AT RISK
     The infrastructure is in poor to fair condition and mostly below standard, with many elements
     approaching the end of their service life. A large portion of the system exhibits significant
     deterioration. Condition and capacity are of significant concern with strong risk of failure.

     FAILING/CRITICAL: UNFIT FOR PURPOSE
     The infrastructure in the system is in unacceptable condition with widespread advanced signs
     of deterioration. Many of the components of the system exhibit signs of imminent failure.

                                                       INFRASTRUCTUREREPORTCARD.ORG/HAWAII | 5
HAWAII INFRASTRUCTURE GRADES SUMMARY
       Aviation              Bridges            Coastal Areas            Dams

          C-                 C+                     C-                     D
     Drinking Water          Energy                 Roads                Schools

          D+                  C-                    D+                   D+
               Solid Waste             Stormwater           Wastewater

                      Av
                      iati                 on

                  C                      D-                   D+

                                                      INFRASTRUCTUREREPORTCARD.ORG/HAWAII | 6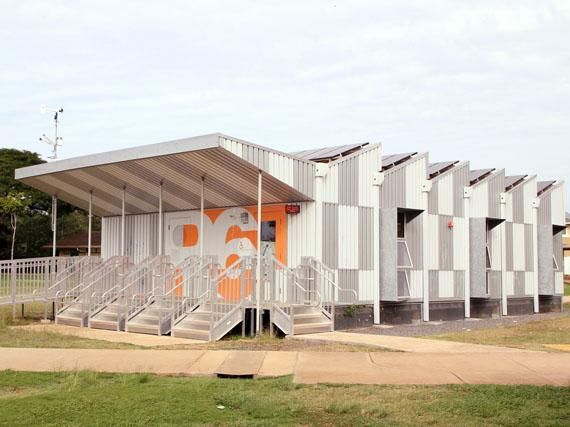
RECOMMENDATIONS TO RAISE THE GRADE
STAY ABOVE THE RISING TIDE
Hawaii needs to fund short and long-term strategies to address the impacts of sea-level rise. In the short term, education
regarding beach nourishment should continue to take place, and adequate funding should be identified and directed toward
shoreline protection projects. In the longer term, funding to address the impacts of sea level rise is needed. Projections
show that by 2100, sea levels will rise by approximately 3.2 feet, meaning over 20,000 people would be displaced, roughly
5,700 structures would be impacted, and approximately 40 miles of coastal roads would be at risk of sea inundation.
Portions of the major coastal arterials or ‘belt’ roads in each county would be impassible, affecting certain communities
that lack parallel facilities and rely solely on these corridors for access. Strategic and comprehensive planning and robust
funding to support necessary projects is needed now to plan for tomorrow.

SUPPORT SUPPLEMENTAL FUNDING STRATEGIES
Hawaii’s roadways are among the most congested in the nation, and there is a $23 billion transportation infrastructure
funding gap over the next 20 years. To help close the investment gap and to address growing construction costs, the state
legislature should increase the state gas tax and support innovative funding mechanisms. New revenue can help toward
paving potholes,managing congestion, and reducing the number of structurally deficient bridges in Hawaii.

INVEST IN DAM SAFETY
93% of Hawaii’s dams are high-hazard potential, meaning failure could result in significant loss of life or property. According
to the Association of State Dam Safety Officials, 76% of Hawaii’s High Hazard Potential dams are in poor condition and 8%
are rated unsatisfactory. Significant funding for engineering investigations, repairs and maintenance are necessary to help
Hawaii’s dams meet current safety standards and minimize the risk to downstream communities and the general public.

PROTECT OUR WATER SYSTEMS
Hawaii’s drinking water and wastewater systems are plagued by infiltration of saline groundwater and both exhibit significant
funding gaps when it comes to available revenue versus total needs. Additionally, the impact of sea level rise and wave
inundation on facilities could potentially release wastewater or hazardous waste to local waters and habitats. Rates for both
drinking water and wastewater utilities should reflect the true cost of service. Additionally, Hawaiian communities should
leverage available loan and grant programs to ensure public safety and the environment is protected.

RECOGNIZE THE VALUE OF STORMWATER
Stormwater in Hawaii drains directly into the ocean. Pollutants, trash, and debris entering Hawaii’s water resources is
especially harmful as the state has experienced an increase in extreme flooding caused by high tides, storm surges,
hurricanes, tsunamis and sea level rise. Dedicated funding from stormwater utilities can provide funding for drainage
system upgrades, but there are currently no user fees or charge rates in place. Better recognition of stormwater as a
utility and resource and further development of county stormwater utility fees to pay for the retrofitting of flood control
infrastructure and water quality improvement projects.

                                                                       INFRASTRUCTUREREPORTCARD.ORG/HAWAII | 7
AVIATION

AVIATION
EXECUTIVE SUMMARY
Hawaii is the only state not accessible via ground transportation. The only methods of transportation to and from
Hawaii and between islands are by sea or air, with the majority of travel occurring by air. In 2017, enplanements
statewide rose 2.7% over 2016. Over half of those enplanements were made by visitors.
In general, the majority of Hawaii’s airports are in fair condition. Recently, the State of Hawaii, Department
of Transportation, Airports Division (DOT-A) has undertaken several terminal modernization programs to
upgrade several of their airport facilities across the state. Although each airport generates revenue from their
operations, federal grants and state appropriations are still needed to undertake major improvement projects.
Hawaii’s airports are vulnerable to environmental hazards such as rising sea levels, hurricanes, tsunamis and
earthquakes. Continued improvements are required to increase capacity, enhance conditions, and increase
resiliency and sustainability efforts.

BACKGROUND
As the only state not accessible via ground transportation, aviation and its infrastructure is critical in Hawaii.
Residents and businesses depend on airports for the transportation of goods, services, and people. Because
of Hawaii’s remote location and heavy dependence on imported goods, Hawaii depends on the aviation system
for delivery of perishable items like fresh fruit and vegetables which are flown in, rather than shipped.
Tourism is one of Hawaii’s main economic drivers. In 2017, spending by visitors arriving by air rose to $16.6
billion. In 2017, over half of the 17.3 million people enplaned in Hawaii, or 9.3 million, were non-residents. As an
integral part of Hawaii’s economy and day to day operations, it is essential that Hawaii’s airports are improved
and modernized to effectively serve residents, businesses, and visitors.
The State of Hawaii, Department of Transportation, Airports Division (DOT-A) operates and maintains all fifteen
(15) National Plan of Integrated Airport Systems (NPIAS) airports in the state. The Daniel K. Inouye International
Airport (HNL), located on the Island of Oahu, is the state’s largest airport. In 2017, enplanements at HNL
accounted for 56% (9.7 million) of enplanements Statewide. The HNL also accepted the most cargo (74%, 2.5
billion pounds) in 2017. Other main airports include medium hub Kahului Airport (OGG) on the Island of Maui,
small hubs Hilo International Airport (ITO) and Ellison Onizuka Kona International Airport (KOA) on the Island of
Hawaii, and small hub Lihue Airport (LIH) on the Island of Kauai.
Other NPAIS airports include Dillingham Airfield (on lease from the US military) and Kalaeloa Airport (JRF,
formerly Barbers Point Naval Air Station) on the Island of Oahu; Kapalua and Hana Airports on the Island
of Maui; Lanai Airport (LNY) on the Island of Lanai; Molokai (MKK) and Kalaupapa Airports on the Island of
Molokai; Waimea-Kohala and Upolu Airports on the Island of Hawaii; and Port Allen Airport on the Island of
Kauai. Except for Upolu Airport and Port Allen Airport, which are used exclusively by general aviation, all of
these facilities are utilized by air carriers, general aviation, and the military. Hawaii’s smaller airports account
for approximately 1.5% of air traffic in the State.

CAPACITY
In 2018, Hawaii’s airports serviced 37.6 million passengers, with HNL servicing approximately 21.2 million
passengers. As the State’s busiest airport, HNL regularly experiences capacity issues at the gate during peak
travel hours (between 10am and 2pm) when all gates are typically occupied. Airside capacity issues also
exist with existing infrastructure, like taxiways and pedestrian bridges unable to accommodate wide-body or
double-decker aircraft.
In general, the main public airports on each island appear to meet current capacity needs. However, Hawaii’s

                                                                    INFRASTRUCTUREREPORTCARD.ORG/HAWAII | 8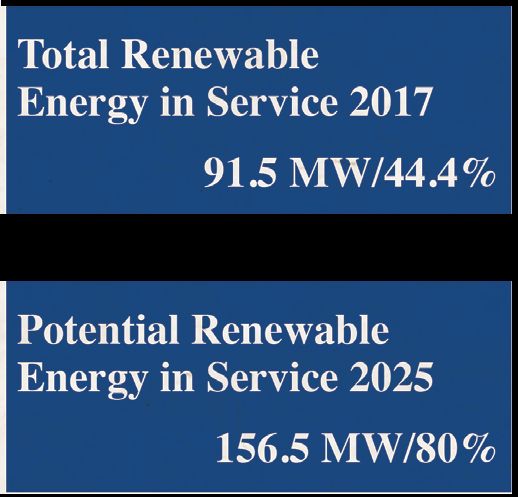
airports may need to be improved to meet future capacity needs as the resident population is projected to
increase by 15.4% from 1.43 million in 2016 to 1.74 million by 2045. In addition, it is anticipated that the number
of visitors will continue to increase each year.
As land is extremely valuable in Hawaii, HNL and the adjacent Joint Base Pearl Harbor Hickam operate as a
joint use facility, allowing them to share runways and taxiways. DOT-A also utilizes former military airfields such
as Dillingham Airfield and Kalaeloa Airport to help relieve demands at HNL without construction of additional
airfield facilities.

CONDITION, OPERATIONS AND MAINTENANCE
The majority of the public use airports are in fair condition, with some in better condition than others. Ongoing
and regular maintenance is required for paved runways, taxiways, aprons, landscaping, lighting, utilities,
equipment, hangars, and terminals. In 2018, DOT-A’s operating expenses were approximately $413 million, up
from $389 million in 2017. Of the $413 million, $44 million was spent on repairs and maintenance, $34.6 million
on utility costs and $183 million on salaries, wages and personnel services.
The DOT-A utilizes a Pavement Management System (PMS) Program, which uses the Pavement Condition
Index (PCI) and other data inputs, to develop long-term pavement maintenance planning. The program is used
to determine whether preventative maintenance, major rehabilitation, or additional improvements are needed.
The general aviation hangars at HNL and OGG are in poor condition, with structural members exhibiting signs
of section loss due to corrosion. New hangars at JRF are being built, allowing for relocation of general aviation
activities from HNL, freeing up land and capacity for HNL operations.

FUTURE NEED
A formal Statewide Airport System Plan (SASP) was last prepared in 1998, with the main airports having
individual master plans developed more recently. With increasing population growth and tourism posing future
challenges, DOT-A began implementing its $2.7 billion Hawaii Airports Modernization Program in 2013. The
program includes phased development and redevelopment of its existing infrastructure to accommodate
increased air traffic, meet heightened security requirements, and improve passenger experience at airports
across the State. The program’s remaining costs are $671 million.
Major projects at HNL include a new mauka concourse for larger aircrafts and additional gate capacity during
peak hours; a consolidated rental car facility and parking structure; a new cargo maintenance facility; runway
and taxiway repairs; widening improvements; and refurbishment of the Diamond Head concourse.
HNL’s Master Plan also proposes a $1.1 billion future reconstruction of the Diamond Head concourse to include
additional gates and a new customs and border protection facility.
Current and future projects at other airports include a new access road, taxiway and runway repairs, and
a consolidated rental car facility at OGG; terminal modernization at KOA to accommodate mainland and
international travel; a new 64,000 sf cargo facility and energy efficient equipment at ITO; and security upgrades
and a consolidated rental car facility at LIH.

FUNDING
Funding for public airports is jointly provided by the Federal and State governments. In past years, requests
for federal grants have been made through the Federal Aviation Administration (FAA) Airport Improvement
Program (AIP). In 2018, Hawaii’s total 5-year (2019-2023) development estimate of improvements eligible for
the AIP grants was $383 million. DOT-A was awarded $24.1 million for HNL apron reconstruction, KOA Aircraft
Rescue and Fire Fighting (ARFF) training facility, and JRF runway repairs. Grants were also awarded to ITO,
OGG, MKK and LNY to acquire ARFF vehicles.
Although the DOT-A receives no general funds from the State, their budget appropriations require approval from
the State legislature. Legislative approval and bond issuance occur on a bi-annual basis with the opportunity
for interim funding. Bonds are repaid by revenue generated by passenger facilities charges (PFCs), customer
facility charges (CFCs), and airport leases and concessions. Passengers are charged PFCs when tickets are

                                                                   INFRASTRUCTUREREPORTCARD.ORG/HAWAII | 9
purchased on commercial air carriers. The fee, established by US Federal law, goes toward airport operations
and maintenance. Meanwhile, CFC’s are fees collected for the use of rental cars.
In 2018, Hawaii collected $44.9 million in PFC charges and $76.5 million in rental car CFCs. Total revenue
generated at Hawaii’s airports was $629.3 million, up 15.5% from 2017. Financially, DOT-A has been operating
with increases in positive cash flow. DOT-A is seeking to transfer control of the airports to a private authority or
corporation, which would expediate the funding and procurement process, and allow for increased operational
efficiencies and flexibility.

PUBLIC SAFETY
Hawaii’s main airports are secured in accordance with FAA and TSA guidelines. The smaller airports, like
Molokai Airport, Port Allen and Hana Airport are minimally secured, which is reflective of the amount of traffic
they serve. For flights that don’t meet the TSA threshold, passengers are screened at other airports. Striping,
apron lighting, signals and other safety related items must also be compliant with state and federal regulations.
As of January 2018, significant changes had been made to runway holding position markings at HNL to reduce
the likelihood of general aviation incursions.

RESILIENCE
Environmental hazards that may affect Hawaii’s airports include hurricanes, earthquakes, and tsunamis.
Although there is volcanic activity on Hawaii Island, all of the public airports are located outside of the rift zones.
In the event of environmental hazards and harbor closures, airports are the primary method of emergency
access and receiving aid from the mainland. ITO and OGG are especially vulnerable to hurricanes, as they are
on the windward side of their respective islands.
Rising sea levels resulting from climate change may eventually impact HNL, the lowest airport in the State. Its
iconic reef runway sits offshore at 10 feet above mean sea level. If taken out of service, the amount of air traffic
HNL will be able to handle will be severely impacted.
Aligning with local legislation and the airport sustainability movement, DOT-A developed the Sustainable
DOT-A program to promote sustainability across Hawaii’s airports. The program is committed to implementing
initiatives and maintaining best practices that focus on creating a more sustainable air transportation system
that is operationally efficient, environmentally responsible and culturally appropriate. As the first initiative and
pilot program for DOT-A’s airport system sustainability program, SustainableHNL set forth several short-
term goals for reducing energy, carbon emissions, potable water usage, waste generation, and downstream
stormwater impacts by 2020 at HNL.

INNOVATION
DOT-A is in the process of undertaking a handful of innovative approaches to enhance its existing infrastructure,
operations, and impact. Improvements include installation of new LED lighting systems that provide better
energy efficiency and airfield visibility. DOT-A has partnered with a private company to deliver the largest
single-state energy savings performance contract in the US. The $158 million investment is guaranteed to
generate over $500 million in savings over 20 years. Improvements include replacing 98,000 lighting fixtures
with LED and other energy-efficient lighting, upgrading HVAC systems, installing over 33,000 solar panels, and
roof repairs and equipment replacement that had been previously deferred.
In addition to reducing energy use, DOT-A is continuing to reduce potable water usage and increase usage
of alternative water sources. A $12 million design-build contract was awarded in 2018 for four water reuse
projects. The projects include interception and delivery of non-potable water from Sumida Farms at HNL, an
onsite membrane bioreactor plant and delivery system at OGG, a distribution system at OGG for reclaimed
wastewater from the nearby Kahului Wastewater Reclamation Facility, and a stormwater collection and rainwater
harvesting system at KOA.
NextGen is a Federal Aviation Administration (FAA)-led modernization of the National Airspace System. With
the help of technological advances and new procedures, NextGen will increase the airports safety, efficiency
capacity, predictability and resiliency. Once initial infrastructure improvements are completed in 2025,

                                                                      INFRASTRUCTUREREPORTCARD.ORG/HAWAII | 10
implementation should reduce flying times, fuel use, and aircraft emissions while getting passengers to their
destinations at more predictable times.
RECOMMENDATIONS
Recommended actions to improve Hawaii’s aviation infrastructure include:
1. Continue implementing projects to renovate and upgrade existing facilities.
2.
Continue to increase sustainability and resiliency efforts with innovative designs, projects,
partnerships and delivery methods.
3. Update the 1998 Statewide Airport System Plan (SASP).
4. Continue to pursue the creation of an airport authority that operates independently of the state
legislature to expedite delivery and execution of projects.
5. Continued and accelerated implementation of NextGen air traffic control system infrastructure and
procedures.
SOURCES
http://hidot.hawaii.gov/airports/library/financial-audit-reports -Financial Statements and Supplemental
Schedules, June 30, 2018 (with Independent Auditor’s Report Thereon) – BKD CPAs and Advisors
http://hidot.hawaii.gov/administration/federal-aviation-administration-awards-24-1-million-in-infrastructure-
grants-to-hawaii-airports - 2018 FAA Grants Press Release
http://hidot.hawaii.gov/airports/doing-business/engineering/passenger-facility-charge - Air Carrier
Consultation Meeting Package
http://hidot.hawaii.gov/airports/doing-business/engineering/sustainabledota/ - SustainableDOT-A
http://airports.hawaii.gov/hnl/airport-info/sustainablehnl/ - SustainableHNL
https://hands.ehawaii.gov/hands/opportunities/opportunity-details/9035 - AS1095-07 Design-Build RFP for
Install Wastewater and Water Treatment Systems, Statewide Airports
https://aviation.hawaii.gov/wp-content/uploads/2015/03/Statewide-Airport-System-Plan-1998.pdf - 1998
Statewide Airport System Plan, RM Towill, State of Hawaii, Department of Transportation, Airports Division
https://www.faa.gov/airports/planning_capacity/npias/reports/ - National Plan of Integrated Airport Systems
Report, 2019-2023 NPIAS Report, Appendix A, List of NPIAS Airports with 5-Year Forecast Activity and
Development Estimate
https://www.faa.gov/nextgen - What is Next Gen?
https://www.faa.gov/TV/?tag=Honolulu – FAA TV: HNL Runway Safety Vignette
https://www.hawaiitourismauthority.org – Hawaii Tourism Authority
http://www.airport-world.com/features/airport-profiles/6827-green-hawaii.html - Airport World, Green Hawaii
https://www.civilbeat.org/2018/12/chad-blair-things-are-actually-looking-up-at-honolulu-airport- Honolulu
Civil Beat Column, December 7, 2018
https://www.johnsoncontrols.com/insights/2016/buildings/case-study/hawaii-dot - Johnson Controls Hawaii
Case Study
2015 Hawaii Catastrophic Hurricane Plan – FEMA Region IX Hawaii Catastrophic Annex
Airports Council International – North America (ACI)
INFRASTRUCTUREREPORTCARD.ORG/HAWAII | 11BRIDGES
BRIDGES
EXECUTIVE SUMMARY
Hawaii’s bridges are a vital part of the state infrastructure, providing passage for residents, businesses, and
emergency services. Hawaii’s 1,135 bridges have an average bridge age of 60 years. Of these bridges, 6.9% are
structurally deficient bridges. While the percentage of bridges rated to be in good condition has risen over the
past several years due to rehabilitation efforts, the number of structurally deficient bridges has also increased
during the same time period. In addition, due to the state’s isolated location, marine environment and various
natural hazards, bridge construction costs are the highest in the nation. Therefore, current efforts by state and
county agencies are focused on preserving the existing bridge inventory and maintaining safety rather than
upgrading bridge capacity or resilience to meet future needs. To this end, there are 44 state bridges and up to
34 City and County of Honolulu bridges slated for repair in the next four to six years.
CONDITION AND CAPACITY
As of 2018, there are a total of 1,135 bridges throughout the state of Hawaii. The 7%
average bridge age in Hawaii is approximately 60 years, which is significantly 16%
higher than the nation’s average bridge age of 43 years reported in the 2017
ASCE Infrastructure Report Card.
23%
The majority of bridges in Hawaii are concrete girder structures. However, a 54%
number of the bridges along the northern shore of the Island of Hawaii were
originally constructed for the sugar plantation railroads and are of an older
steel trestle construction, which were later retrofitted to carry vehicular traffic.
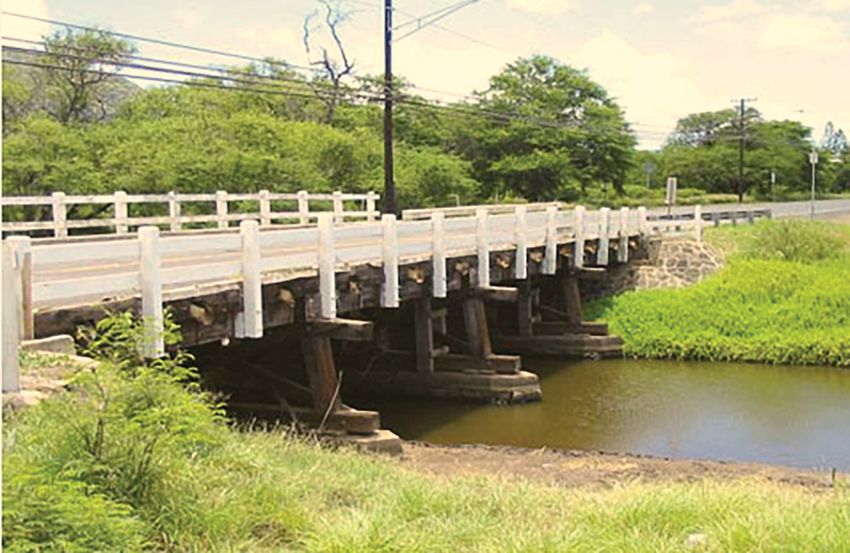
There are a few wooden bridges that are slated for replacement. With the large City and County of Honolulu
number of older bridges in Hawaii, the state and counties implement repairs and County of Hawaii
rehabilitation to try to extend the service life of bridges as much as possible. County of Maui
Bridge replacement projects are expensive and usually challenging, given County of Kauai
environmental and historical issues.
% of Bridges by County
44%
Age of Bridges in Hawaii
21% 20%
20%
16%
15%
14%
11% 11%
6% 6%
5%
4%
3%
2%
1%
0-9 YEARS 10-19 YEARS 20-29 YEARS 30-39 YEARS 40-49 YEARS 50-59 YEARS 60-74 YEARS 75 YEARS
and OVER
NHS NON-NHS
INFRASTRUCTUREREPORTCARD.ORG/HAWAII | 12Most bridges in Hawaii’s inventory were typically designed for a 50-year service life. Currently, over 750
Most
bridges are at bridges
least in Hawaii’s
48 years old, inventory were typically
and 67 bridges designed
are over for a 50-year
98 years service service
old. Bridge life. Currently, overbe
life may 750extended by
maintenance,bridges are at leastor48retrofit;
rehabilitation years old, and 67 functional
however, bridges are obsolescence,
over 98 years old.severe
Bridgestructural
service life deficiencies
may be or the
need to meetextended
currentbystandards
maintenance, rehabilitation
may eventuallyorrequire
retrofit; replacement.
however, functional obsolescence,fifty
One-hundred severe structural
bridges are posted for
deficiencies or the need to meet current standards may eventually require replacement. One-hundred
load, meaning that vehicles of certain weights and sizes are not allowed to cross the bridge, limiting service to
fifty bridges are posted for load, meaning that vehicles of certain weights and sizes are not allowed to
those areas.cross the bridge, limiting service to those areas.
From past bridge inspection data, the percentage breakdown of Hawaii bridges rated as good, fair, and poor
From past bridge inspection data, the percentage breakdown of Hawaii bridges rated as good, fair, and
in the years poor
2012inand 20172012
the years is presented
and 2017 is in the following
presented charts.charts.
in the following
Bridges by Condition Rating Bridges by Condition Rating
Year 2012 Year 2017
The increase in percentage of “good condition” bridges from 2012 to 2017 indicates that in general, the
condition
The increase of existing bridges
in percentage of “goodhas improved due to
condition” current from
bridges rehabilitation
2012 to and2017
maintenance efforts.
indicates that in general, the
condition ofInexisting
2017, 78bridges has improved
bridges (6.9%) duestructurally
were deemed to currentdeficient.
rehabilitation and maintenance
While structurally efforts.
deficient bridges are
not unsafe,
In 2017, 78 bridges without
(6.9%) weresubstantial
deemedimprovements, these bridges
structurally deficient. arestructurally
While at risk of becoming
deficientunsafe and may
bridges are not unsafe,
need to be closed in the future. Structurally deficient bridges require significant maintenance and more
without substantial improvements, these bridges are at risk of becoming unsafe and may need to be closed in
frequent inspections. More than a third (30%) of the bridges deemed structurally deficient are located in
the future. Structurally
the City and deficient bridges require
County of Honolulu, which is significant maintenance
the most populated county and
in themore
Statefrequent
of Hawaii.inspections.
As a More
than a third result,
(30%)someof the bridges deemed structurally deficient are located in the City and County
of our busiest trafficked bridges are structurally deficient. In addition, as the percentage of of Honolulu,
which is thestructurally
most populated countyhas
deficient bridges in increased
the State of Hawaii.
significantly As years,
in recent a result, some
continual of our
funding forbusiest
bridge trafficked
bridges are structurally deficient.
rehabilitation and In addition,
replacement should beas the percentage of structurally deficient bridges has increased
a priority.
significantly in recent years, continual funding for bridge rehabilitation and replacement should be a priority.
Table 3.9. Number of Structurally Deficient Bridges
NETWORK SYSTEM 2013 2014 Year 2015 2016 2017
Network System
NHS - ALL 2013
20 2014 21 2015 232016 2017
24 31
NHS - ALL 20 21 23 24 31
Non-NHSNon-NHS 38
38 36
36 41
41 42 42
47
47
TOTAL 58 57 64 66 78
TOTAL 58 57 64 66 78
Table 3.9. Number of Structurally Deficient Bridges
Both the state as well as the City and County of Honolulu plan to reverse this trend with future bridge
rehabilitation projects. In order to optimize funding and to comply with federal and state mandates, current
efforts are focused on preserving the existing bridge inventory and maintaining safety.
OPERATIONS AND MAINTENANCE, PUBLIC SAFETY, FUNDING, AND FUTURE NEED
National bridge replacement unit costs in 2016 show that Hawaii has the highest estimated unit cost for bridge
replacement, with costs of $674 per square foot for National Highway System Bridges and $787 per square
INFRASTRUCTUREREPORTCARD.ORG/HAWAII | 13foot for non-National Highway System Bridges. These high costs are primarily due to Hawaii’s isolated
location. Based on the 2016 unit costs, the Federal Highway Administration estimates that Hawaii would
require approximately $149 million to replace all structurally deficient bridges, or $101 million to rehabilitate all
structurally deficient bridges.
State funding for bridge maintenance and repair is provided by the Highway Special Revenue Fund, which
consists of revenue gained through taxes and fees related to liquid fuel, vehicle registration, rental and tour
vehicle surcharges, and periodic motor vehicle safety inspections.
Currently, the State of Hawaii Department of Transportation (HDOT) implements federally funded biennial
bridge inspections for all state and county bridges in accordance with Federal law. Biennial inspections are
performed by certified inspectors to assess the current condition of bridges and to provide quantifiable data
on bridge components that may require maintenance or repair. Where existing conditions warrant, bridges are
inspected at shorter intervals. A portion of this inspection data is incorporated into load rating calculations
to determine whether the structure can adequately support the anticipated vehicle traffic over the bridge or
whether load posting is required. From analysis of this inspection data and taking into account agency specific
factors, the state and counties identify and prioritize those bridges requiring repair or replacement.
For the 443 state bridges, HDOT initially reviews bridge sufficiency ratings generated by inspection data
to develop an initial list of bridge maintenance projects. This list, as well as any decision to repair, retrofit
or replace a bridge is then revised by considering local conditions, such as long-term durability, capacity
projections or historic/environmental constraints. For example, as the Farrington Highway Bridge 3 in Makaha
is of less durable timber construction, it is slated for replacement, whereas the recently rehabilitated Karsten
Thot Bridge was repaired due to its classification as a historic structure. Based on this list, the state has
currently approved a budget for 44 bridge maintenance projects at $10 to $15 million dollars per bridge, to be
implemented over the next four years. The state has also allocated over $10 million dollars to update the load
rating for selected bridges by 2019 in order to meet federal load rating standards.
Farrington Highway Bridge 3 to be Replaced Recently Rehabilitated Karsten Thot Bridge
For its 201 bridges, the City and County of Honolulu also reviews inspection data with consideration of other
local factors to develop a priority list of maintenance projects. The City currently has two bridges under
construction, five bridges awaiting the start of construction and 14 bridges in various stages of design with the
goal of bidding for construction within the next three years. The City has identified 34 other bridges for further
assessment to determine whether or not they need be rehabilitated over the next six years and projects a total
design and construction budget for bridges over the next six years of $40 million.
No funding is currently allocated for future need, particularly with regard to upgrading or increasing bridge
capacity, which will become an issue with projected population growth.
RESILIENCY
Resiliency refers to the ability of the bridge to withstand extreme events without failure and to remain in
INFRASTRUCTUREREPORTCARD.ORG/HAWAII | 14operation for use by essential services. Hawaii’s bridges are subject to a large number of hazards. Timber and
bridges, although much less common than concrete bridges, are more susceptible to damage from hurricanes
as well as deterioration from dry rot or corrosion common in a temperate marine environment. Parts of the
state, such as the Big Island of Hawaii, are highly seismically active; thus bridges in those areas must be
designed to withstand significant earthquake loads. Many bridges are located within areas vulnerable to scour,
flooding, or tsunamis. Additional funding may be required for new bridge designs that must account for these
events as well as future hazards such as sea level rise. Although state and county efforts concentrate on
maintenance and repair, both agencies encourage repair solutions that increase resiliency, such as increased
earthquake or scour resistance, where it can be economically incorporated into the repair scheme.
INNOVATION
The implementation of innovative materials, design approaches and construction methods can be used to
extend bridge service life and resiliency or to reduce construction duration. To this end HDOT sponsors
workshops to introduce new design and construction methodologies, such as the Accelerated Bridge
Construction workshop held in April 2018. HDOT also encourages new construction techniques, such as
the Halona Street Bridge Replacement project in 2017 where prefabricated bridge elements were used to aid
in construction efficiency. Current HDOT sponsored bridge research includes a $400,000, five-year study
to monitor seismic instrumentation in the base-isolated Kealakaha Bridge and a $700,000 remote structural
health monitoring of the Kolekole Bridge and the ultra-high performance concrete joints of the Umauma Stream
Bridge. The state is also working with the University of Hawaii on a study regarding the impact of sea level
rise on bridges and is also exploring open end contracts for consultants and contractors to decrease time in
project delivery.
The HDOT is working on its Bridge Management System to incorporate life cycle planning into its Bridge
Program. By considering the current condition of system assets relative to their lifecycle, actions can be
developed which reduce long-term costs and extend the service life, which in turn allows a wider range of
investment choices.
RECOMMENDATIONS
awaii’s bridges are generally in fair or good condition; however, frequent inspections and maintenance are
H
necessary to ensure that the bridges can continue to serve the needs of the state.
Recommended actions to improve Hawaii’s bridges include:
1. Continue funding repair projects to maintain the existing bridge inventory and to reduce the number
of load restricted and structurally deficient bridges at a more uniform rate.
2.
Develop and implement a long-term bridge maintenance and prioritization plan to mitigate
deterioration of bridges in satisfactory condition and to reduce the number of future repair projects.
3. Plan for future capacity needs and future hazards such as sea level rise.
SOURCES
https://www.fhwa.dot.gov/bridge/britab.cfm - Tables of Frequently Requested NBI Information, U.S.
Department of Transportation Federal Highway Administration
http://hidot.hawaii.gov/blog/2017/09/29/halona-street-bridge-replacement-project-completed-on-schedule/
- Halona Street Bridge Replacement Project Completed on Schedule, State of Hawaii Department of
Transportation
http://hidot.hawaii.gov/administration/about/ - About, State of Hawaii Department of Transportation
Administration
http://www.cee.hawaii.edu/research-2/structural-engineering/ - Ian Robertson and David Ma, Structural
Engineering Research, University of Hawaii at Manoa, Civil and Environmental Engineering
Meeting with Edwin Sniffen (July 9, 2018), State of Hawaii Department of Transportation, Deputy Director –
Highways
Meeting with Keith Kalani (July 6, 2018), City and County of Honolulu Department of Design and Construction
– Civil Division, Bridge Engineer
INFRASTRUCTUREREPORTCARD.ORG/HAWAII | 15COASTAL AREAS
COASTAL AREAS
EXECUTIVE SUMMARY
Hawaii’s beaches and oceans are one of the foundations of the state’s economy and the highlight of local
culture and lifestyle. Sandy, accessible beaches are a vital piece to the recreation and tourism sector. Due
to shoreline erosion, Hawaii’s coastlines are faced with the following challenges: availability of suitable sand
reserves, enough funding and efficient permitting. Although limited, developing and applying local and regional
beach management strategies and restoration projects will be essential to decreasing the risk exposure for
coastal areas. Doing so is imperative; research projects an anticipated 3.2 feet of sea level rise by 2100, which
will put approximately 5,700 structures surrounding coastal areas and 40 miles of coastal roads at risk of sea
inundation. Future legislation regarding development near coastal areas are one of the keys to ensuring that
beaches will remain for future generations.
CAPACITY AND CONDITION
Over 750 miles of coastline surround all of the eight major Hawaiian Islands. The coastlines vary in environments
from sandy beaches, fishponds, and rocky shorelines. Nearly half of the coastlines found on Oahu, Maui, and
Kauai are considered sandy shorelines and are susceptible to shoreline erosion. A USGS study in 2012 found
that 70 percent of the beaches on Oahu, Maui and Kauai are eroding and approximately 13 miles of sandy
coastline have been completely lost to erosion.
According to the Hawaii Sea Level Rise Vulnerability and Adaptation Report (2017) by the State of Hawaii,
research projects an anticipated 3.2 feet of sea level rise by 2100. With 3.2 feet of sea level rise, approximately
5,700 structures surrounding coastal areas and 40 miles of coastal roads would become at risk to sea inundation.
A study and model generated by the University of Hawaii School of Earth Science and Technology in 2013
explored the combined impacts of sea-level rise and coastal inundation due to tsunami and hurricane events
within the urban core of Honolulu from Pearl Harbor to Diamond Head. Under the assumption of three feet
of sea level rise and the effects of storm surge and tsunami run-up from hurricane and tsunami forces, an
estimated $34.8 billion, or 80%, of the study area’s economy would be at risk. The added effects of storm
surge and rare tsunami events will only exacerbate the current shoreline erosion issue in areas throughout the
state.
For properties along the shoreline, beach armoring has become a common solution for owners in the past.
Despite the inclination to protect their homes, studies have shown that hardening shorelines through the
construction of sea-walls and shoreline structures can have detrimental impacts such as reducing recreational
beach widths and even increasing the rate of coastal erosion in the surrounding areas.
OPERATION AND MAINTENANCE
Beach nourishment in Hawaii can be defined by two methods: beach maintenance and beach restoration.
During particular times of the year, sand accretion can develop on one segment of the beach while sand decline
occurs at another segment of the beach. Sand back-passing, a form of beach maintenance, reallocates the
distribution of sand by pushing or scraping to reshape the beach profile. Other forms of beach maintenance
include dune restoration and re-vegetation. Frequently, sand is completely lost from the beach system and
importing of sand is required as a restoration practice.
Challenges associated with beach nourishment projects in Hawaii include lack of sand resources, funding, and
obtaining appropriate permits. There are very strict requirements when it comes to importing sand for beach
nourishment projects. The imported sand must match the characteristics of the particles found on the beach to
avoid harm to the reef ecosystem. Locating and importing sand can be costly as the supply of beach-quality
INFRASTRUCTUREREPORTCARD.ORG/HAWAII | 16sand found on the shores of Hawaii’s beaches has either been depleted or protected from being used for
beach nourishment. The feasibility of transporting sand to beach nourishment sites can also be challenging.
The length of time that it takes to obtain the necessary permits and clearances to perform beach nourishment
present additional challenges to completing the project as the profile of the beach could change tremendously
before permits can be obtained. One of the biggest hurdles, for example, is the fact that under the 2011 Hawaii
Code, Division 1 Government, Title 19, 342D, sand is designated as a “water pollutant” which creates a ripple
effect by complicating the permitting process and reviews across several local agencies. Developing and
applying local and regional beach management strategies will be essential to decreasing the risk exposure in
coastal areas.
PUBLIC SAFETY
Sea level rise will pose a public safety risk for industrial facilities located near coastal shorelines. Impacts of
sea level rise and wave inundation toward these facilities could potentially release wastewater or hazardous
waste to local waters and habitats. Residential wastewater facilities could also become affected by sea level
rise and release contaminants to nearby beaches and waters. For example, the Pearl Harbor Naval Complex
on Oahu is an active military location that has been established as a source for contaminated soil, sediment,
and groundwater with metals, and petroleum hydrocarbons and sits within a flood zone that is expected to be
affected by the 3.2 feet of sea level rise.
In December 2017, Sunset Beach on the island of Oahu experienced unprecedented levels of beach erosion
that raised concerns about the public’s safety. The bike path running along Sunset Beach and the local
lifeguard station were adversely affected by that incident, with pieces of the bike path falling nearly 20 feet
before hitting the eroded ground surface below.
A six-part plan has been established to restore Sunset Beach. The plan includes removing the damaged bike
path, pushing sand, planting native coastal plants to rebuild the sand dune(s), marking beach access pathways
to prevent widespread foot erosion, installing access features, and fence and signage to encourage the use of
pathways to respect the dune restoration. Beach restoration work began in August 2018.
FUNDING
According to the Hawaiian Island National Shoreline Management Study (2017), funding opportunities to
support beach nourishment projects are limited and include: State of Hawaii Department of Land and Natural
Resources (DLNR) Beach Fund, Legislative Capital Improvement Project allocations, County allocations, and
Special Tax Districts. The most effective approach for funding shoreline projects seems to come from special
tax districts such as the Waikiki Beach Special Improvement District, which exclusively contributes to a fund
that helps pay for the restoration and maintenance of shorelines of Waikiki Beach on the island of Oahu. The
table below summarizes notable beach nourishment projects and their funding sources:
FUNDING PROJECT
County Kailua (Oahu)
Makaha (Oahu)
Ehukai (Oahu)
Poipu (Kauai)
Kapaa (Kauai)
Private & State (cost Kaanapali (Maui)
share) Waikiki (Oahu)
Private Sunset Beach-Rocky
Point
INFRASTRUCTUREREPORTCARD.ORG/HAWAII | 17Federal and State beach nourishment projects between 2007 and 2018 have totaled nearly $35 million,
while maintaining beach nourishment projects in Waikiki alone was estimated at $1.4 million per year for the
next 10 years.
FUTURE NEEDS
With the threat of sea level rise, potential loss due to the threat have been explored in the recent Hawaii Sea
Level Rise Vulnerability and Adaptation Report. In monetary terms, it has been estimated that with 1.1 feet of
sea level rise, there is a potential for approximately $6.9 billion in economic losses statewide, and $16.8 billion
in losses with 3.2 feet of sea level rise. Estimates for Oahu top the islands at $4.1 billion and $12.9 billion in
losses for 1.1 and 3.2 feet of sea level rise respectively. In terms of potential displacement of communities,
over 4,000 residents could be displaced due to 1.1 feet of sea level rise statewide, and close to 20,000 people
could be without homes due to 3.2 feet of sea level rise statewide. Overall with sea level rise, the State of
Hawaii will experience irreparable damage to the coastal areas and infrastructure while significantly changing
the coastline as we understand and experience it today.
RESILIENCE
Maui County is leading an effort to build resilience to sea level rise by holding workshops within communities
that address and understand priorities for each community when rebuilding. As a result of these community
meetings, the County of Maui was able to develop protocols to employ post-disaster. These protocols include
deploying public service announcements in post-disaster settings that provide guidance to landowners on
what steps need to be taken to restore any damage that may have occurred. The goal of this implementation
is to ensure proper steps are taken to apply forward-thinking and resilient reconstruction along the coastline to
prevent future events and sea level rise from inundating coastal structures and beaches.
RECOMMENDATIONS
• Restrict or limit permitting of coastal armoring and sea wall construction/projects
• Standardize coastal management plans and setback restrictions similar to Maui County statewide
• Implement localized studies to further understand and develop sustainable practices to hinder losing
sand from the coastal system (e.g. the littoral cell)
• Identify and pursue potential federal sources for coastal restoration
• Re-evaluate the definition of “sand” as a water pollutant in the current Hawaii Code state regulations
while still securing the integrity of the protections and permitting process
SOURCES
Hawaii Sea Level Rise Vulnerability and Adaptation Report
https://climateadaptation.hawaii.gov/wp-content/uploads/2018/01/SLR-Report_-January-2018.pdf
Hawaiian Islands National Shoreline Management Study
http://www.aldenst.com/wordpress/wp-content/uploads/2016/08/Draft-Hawaii-Report__-Incomplete_
NSMS.pdf
Hawaii Ocean Resources Management Plan
http://files.hawaii.gov/dbedt/op/czm/ormp/ormp_update_reports/final_ormp_2013.pdf
Multihazard Coastal Inundation Rise and Vulnerability Assessment: A New Generation of Inundation
Information for Community Resilience Planning in Honolulu, Hawaii
http://nsgl.gso.uri.edu/hawau/hawaur13026.pdf
Section 309 Assessment and Strategy FY 2016-2020
http://files.hawaii.gov/dbedt/op/czm/program/doc/hczmp_final_sec%20309%20assessment%20and%20
strategy_2016-2020.pdf
Hawaii 2050 Sustainability Plan
http://files.hawaii.gov/auditor/Reports/2018/2018H2050.pdf
INFRASTRUCTUREREPORTCARD.ORG/HAWAII | 18DAMS
DAMS
EXECUTIVE SUMMARY
The State of Hawaii regulates 132 dam across the state. The majority of these dams were constructed as part
of irrigation systems during the rise of the sugar cane industry and many are nearly 100 years old. Due to old
age, these dams have deteriorated over time and present risks to downstream, now developed, communities.
Of the 132 state-regulated dams, 123 dams (93%) are classified as High Hazard Potential (HHP) meaning a
dam failure could result in significant loss of life or property and three are classified as Significant Hazard
Potential (SHP), meaning dam failure could result in significant loss of property. State law requires all HHP
dams to have an Emergency Action Plan (EAP) which outlines contact information and operations to maximize
the safety of downstream residents in the event of a dam failure or dam emergency. 100% of state regulated
HHP dams have an EAP, which is above the national average of 77%. All SHP dams have EAPs as well. As the
majority of the dams are privately owned, increased funding is needed to support engineering investigations,
repairs and maintenance necessary to help Hawaii’s dams meet current safety standards and minimize the risk
to downstream communities and the general public.
BACKGROUND
The majority of Hawaii’s dams were originally constructed to support the sugar cane industry in the 1900s and
agricultural farming. Today, dams continue to provide an important resource for irrigation, water supply, flood
control and debris control. There are over 300 dams and reservoirs located across the state. The U.S. Army
Corps of Engineers National Inventory of Dams (NID) tracks 133 dams; the rest are smaller structures. Of the
133 NID dams, 132 are regulated by the State of Hawaii, Department of Land and Natural Resources (DLNR).
There is one dam in Hawaii that is federally regulated by the Department of Defense. The majority of the dams
are privately owned earthen structures.
Since the Ka Loko dam failure in 2006, the state has increased its focus on dam safety. State regulations
focusing on dam safety were passed in 2007 and state funding for the dam safety program also increased to
support routine dam safety inspections, enforcement, and training by the state.
CONDITION AND CAPACITY
Dams are categorized nationally to indicate the consequences that could result if the dam were to fail and
release large amounts of water downstream. Nationally, hazard potential of dams are classified by the following
criteria:
• High Hazard Potential (HHP) – dam failure could result in significant loss of life or property.
• Significant Hazard Potential (SHP) – dam failure could result in significant loss of property.
• Low Hazard Potential (LHP) – dam failure results in no probable loss of human life and low economic
and/or environmental losses
According to the 2017 Association of State Dam Safety Officials (ASDSO) Dam Safety Performance Report for
Hawaii, 124 of the 132 state-regulated dams are classified as HHP; three dams are classified as SHP; and six
are considered LHP. Many of the dams that would have been classified as low or significant hazard potential
dams are now being classified as high hazard dams due to the development of downstream communities and
the increased risk of loss of life should the integrity of the dam be compromised.
Depending on its regulatory jurisdiction, the condition of the dam is either assessed by the DLNR or the Army
Corps of Engineers (COE). According to the ASDSO Dam Safety Performance Report for Hawaii, the condition
INFRASTRUCTUREREPORTCARD.ORG/HAWAII | 19You can also read