The Bold North Delivers - The Economic Impact of Super Bowl LII on Minneapolis & Minnesota - Finance & Commerce
←
→
Page content transcription
If your browser does not render page correctly, please read the page content below

The Bold North Delivers
                                  The Economic Impact of
                                  Super Bowl LII on Minneapolis
                                  & Minnesota
                                  Post-Event Full Report

Prepared for:                           Kenneth McGill
Minnesota Super Bowl Host Committee
                                        Jon Gray
                                        Rockport Analytics
May 2018                                info@rockportanalytics.com
                                        +1 (610) 213-2558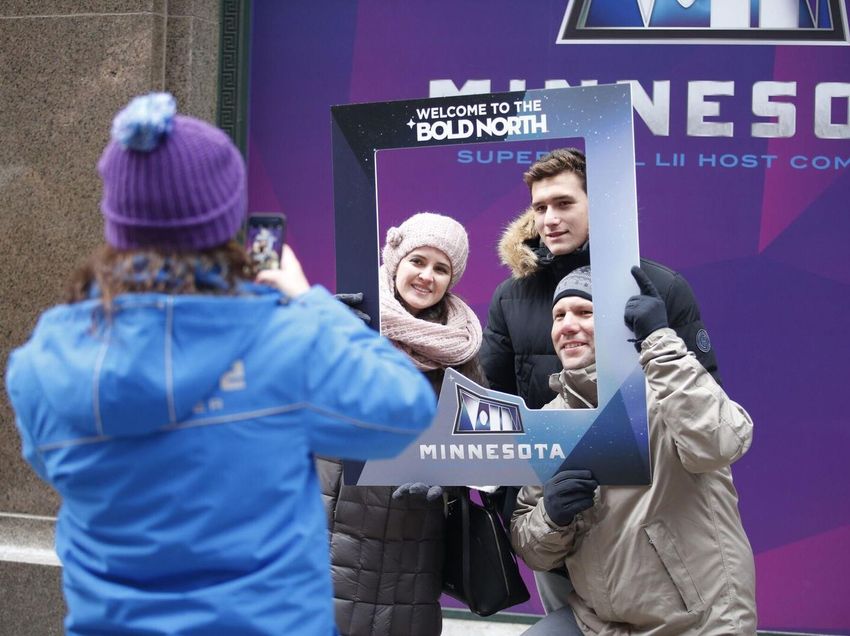
Contents
 • Super Bowl LII: The Bold
   North Delivers

 • SBLII Visitation and
   Incremental Local
   Spending

 • How Did SBLII Benefit the
   Minneapolis & Minnesota
   Economies?

 • Super Bowl LII Impact in
   Perspective

 • Methodology, Data
   Sources, Glossary

 • About Rockport Analytics

                                                                 2
Copyright © 2018 Rockport Analytics, LLC. All Rights Reserved.
Super Bowl LII: The Bold North Delivers
• Super Bowl LII (February 4th, 2018) brought an estimated $450 million
                                                                                            Super Bowl LII Bottom Line*
  in new spending to Minneapolis and Minnesota. This originated from the                                                          SB LI
                                                                                     For the Minneapolis-St.
  local travel spending of 125,000 visitors (not including game tickets) and an
  estimated $179 million in local game, broadcast, and event hosting                 Paul-Bloomington MSA:                     Incremental
  expenditures.                                                                      in millions of $ unless otherwise noted   Contribution
• SBLII was a seminal event that absorbed much of MSP’s tourism infrastructure      Gross SBLII Local Spending                     $450M
  during the 10-day Super Bowl period, displacing much of regular visitor
  commerce typical for that time of year. Displaced tourism activity was            Less value of regular tourism
  estimated at $80.5 million. Even though some of these displaced trips will        displaced by SBLII                            ($80M)
  likely be rescheduled, all were subtracted to arrive at net incremental or new
  SBLII spending of $370 million.                                                   Equals Net SBLII Local
                                                                                                                                   $370M
                                                                                    Spending
• This incremental spending provided a significant economic boost to MSP
  Gross Metro Product totaling $400 million. Businesses that directly               Less goods and services from
  served visitors or participated in hosting the game & events received $202        outside the city
                                                                                                                                  ($78M)
  million of that benefit. And local supply chain firms saw $90 million more. The
  rest came from local SBLII workers spending wages earned during the SB.           Plus Economic ripple effect                    $108M
• In fact, SBLII generated more than $273 million in wages, enough to               Total Economic Impact
  support over 5,490 annual jobs across the metro area.                             Incremental Contribution to                    $400M
                                                                                    MSP GDP
• Minnesota state & local governments also benefited. All the new spending and         Translating into:
  income generated by SBLII resulted in incremental state & local tax
                                                                                        Jobs Supported (annual
  receipts of over $32 million.                                                                                                     5,490
                                                                                        basis)
• SBLII brought many additional benefits that were not part of this calculus.           Wages Paid                                 $273M
  Global media exposure, new interest in MSP and Minnesota for future travel or         State Taxes Paid                            $21M
  meetings and events, significant charitable contributions, and general civic          Local Taxes Paid                             $12M
  pride are all difficult to monetize but bring important, lasting benefits.
                                                                                    Source: Rockport Analytics

     Copyright © 2018 Rockport Analytics, LLC. All Rights Reserved.                                                                        3
Super Bowl LII –February 4, 2018

SBLII Visitation and
Incremental Local Spending
Copyright © 2018 Rockport Analytics, LLC. All Rights Reserved.                      4
SBLII Brought More than 125,000 Visitors
                                                                    to Minneapolis
         Composition of SBLII Visitors* to                                          •   Nearly 125,000 visitors came to the
             Minneapolis-St. Paul                                                       Minneapolis metro area** (MSP) for SBLII over
                                                                                        the 10-day period Jan 26th-Feb 5th, of which
  Ticketed Game Visitors                                 58,800        47%              roughly 58,800 had game tickets
  Non-ticketed Visitors                                  30,310        24%          •   This resulted in over 476,000 visitor-days
  Team, NFL, Broadcast and                                                              comprised of 396,000 overnight stays and 80,000
                                                           6,150        5%              daytrips*
  Other Operations Staff
  Non-Local Credentialed                                                            •   SBLII visitors generated more than 266,000 hotel
                                                         26,310        21%
  Support Staff                                                                         room nights across MSP with an average
                                                                                        daily room rate of $249. SBLII utilized over 84%
  Non-Local Media                                          3,350        3%
                                                                                        of all available room nights across the metro area
  Total Non-Local Visitors                             124,920         100%             during the 10-day period. Utilization increased to
Source: NFL, SBLII Intercept Survey, Minnesota Super Bowl Host Committee,
                                                                                        over 98% during the final four days of SBLII.
Rockport Analytics
                                                                                    •   MSP set a new record with more than 60,000
* A visitor is defined as someone who has either stayed overnight (regardless
of origin) or traveled a distance of at least 50 miles one way during a day trip.       passengers passing through airport security
** Minneapolis-St. Paul-Bloomington Metropolitan Statistical Area                       on their way out of town after SBLII. Meanwhile,
                                                                                        local private airports logged more than 1,630
                                                                                        private jets. And Metro Transit recorded more
                                                                                        than 210,000 additional rides during the 10-day
                                                                                        Super Bowl period.
                                                                                    •   More than 63,000 room nights were generated
                                                                                        by peer-to-peer (e.g. AirBnB) accommodations

      Copyright © 2018 Rockport Analytics, LLC. All Rights Reserved.                                                                    5
An Intercept Survey Captured Vital SBLII
                                                                 Visitor Information
•   967 completed questionnaires were collected at Super Bowl Live,
    Super Bowl Experience, the Mall of America, and on game day at
    U.S. Bank Stadium
•   Relevant visitor data was collected that included origin zip code,
    length of stay, travel party size, accommodation type, transportation
    choice, spending, demographics, and other metrics about their stay
•   Hotel data (covering revenue, daily rate, and room demand) and
    travel & entertainment spending among key SBLII
    hosting/broadcasting organizations supplemented survey results
•   Thanks to our intrepid interview staff!

                                              Key findings include:
                                                        ✓ 95% of SBLII visitors came from outside of Minnesota, 6% of those from
                                                          outside the U.S. The other 5% of SBLII visitors originated from inside of
                                                          Minnesota but either stayed overnight in paid accommodations or traveled
                                                          more than 50 miles one way on a day trip.
                                                        ✓ The majority (71%) of SBLII visitors were male, the average age was 47 years
                                                          old, and nearly half (44%) earned more than $150,000/year
                                                        ✓ Average length of stay of visitors was 3.9 days
                                                        ✓ Average spending per person per day reached $608
                                                        ✓ For every 2 ticket holders, there was one additional visitor that came to
                                                          Minneapolis and did not attend the game

    Copyright © 2018 Rockport Analytics, LLC. All Rights Reserved.                                                                       6
SBLII Visitor Statistics
                                    SBLII Visitors by Age Cohort
                               Over Half of Visitors were Between 35 - 54
                         30%                                               28%
Percentage of Visitors

                         25%                                     23%

                         20%                                                               18%
                                                  15%
                         15%
                                                                                                       10%
                         10%        6%
                         5%
                         0%
                                Under 25         25 - 34        35 - 44   45 – 54         55 - 64      65+

                                 SBLII Visitors by Income Cohort                                                 Primary Mode of Transportation
                               70% of Visitors have HH Incomes > $100K                                               Among Visitors to MSP
                         35%
                                                                                                        31%      Nearly Three-Quarters Came by Air
                         30%
Percentage of Visitors

                                                                                    26%                                                           Bus, 2%
                         25%                                                                                                                       Train, 2% Rental
                         20%                                                                                                                                Vehicle, 2%
                                                                          15%
                         15%                                                                     13%                                                                           Taxi or car
                         10%                                       8%                                                                                                          share, 2%
                         5%       3%                       4%                                                   Airplane,                               Personal
                                            1%
                                                                                                                  73%                                  automobile,
                         0%
                               Less than $25,000 $35,000 $50,000 $75,000 $100,000 $150,000 $200,000                                                       18%
                                $25,000    to      to      to      to       to       to     or more
                                         $34,999 $49,999 $74,999 $99,999 $149,999 $199,999

         Source: Rockport Analytics, SBLII intercept surveys, February 2018                                     Source: Rockport Analytics, SBLII intercept surveys, February 2018

                         Copyright © 2018 Rockport Analytics, LLC. All Rights Reserved.                                                                                                  7
Super Bowl LII Demand Drove Record
                                                   Lodging Performance in the MSP Metro
              Super Bowl LII Hotel & Motel Performance
                                                                                           Primary Accommodations Among
                                             SBLII
                                                          5-Yr Avg
                                                                                   %
                                                                                            Overnight Super Bowl Visitors
                                                          for Same Difference
                                            (2/1-2/4)
                                                           Period
                                                                              Difference                                                        RV park or
                                                                                                                                               campground
 Average Daily Room Demand                    38,700         21,240    +17,460     82%                                                            , 1%

 Average Daily Rate                              $330           $100    +$230    +230%
                                                                                                   Hotel or                                          Staying with
 Average Occupancy Rate                          88%            53%      +35%     +66%            Motel, 64%                                          friends or
Source: Smith Travel Research (STR), Rockport Analytics                                                                                               relatives,
                                                                                                                                                         16%
                   Super Bowl LII Airbnb Performance
                                                           Typical
                                                                                   %                                                              Peer-to-peer
                                             SBLII          MSP    Difference
                                                                              Difference                                                          rental (e g ,
                                                          February                                                                                  Airbnb,
                                                                                                                                                  VRBO, etc ),
Average Daily Room Demand                      4,900             592     4,308    728%                         Other, 1%                             13%
Average Daily Rate                              $364             $92     $272     296%
                                                                                                                                          Day trip, 4%
Average Occupancy Rate                           70%            55%       15%      27%
Source: AirDNA, Rockport Analytics                                                         Source: Rockport Analytics, SBLII intercept surveys, February 2018

•     Nearly two-thirds of overnight visitors stayed in hotels or motels for SBLII; Peer-to-peer rentals, like Airbnb, payed an important
      role in fulfilling room demand for SBLII with 13% of visitors staying at this type of property. This is up significantly from only 5%
      peer-to-peer lodging incidence at SBLI.
•     Average daily rates were up 230% on hotel rooms and nearly 300% on Airbnb properties from normal February levels while
      occupancy rates rose 35 points on hotel properties and 15 points on Airbnb properties

      Copyright © 2018 Rockport Analytics, LLC. All Rights Reserved.                                                                                              8
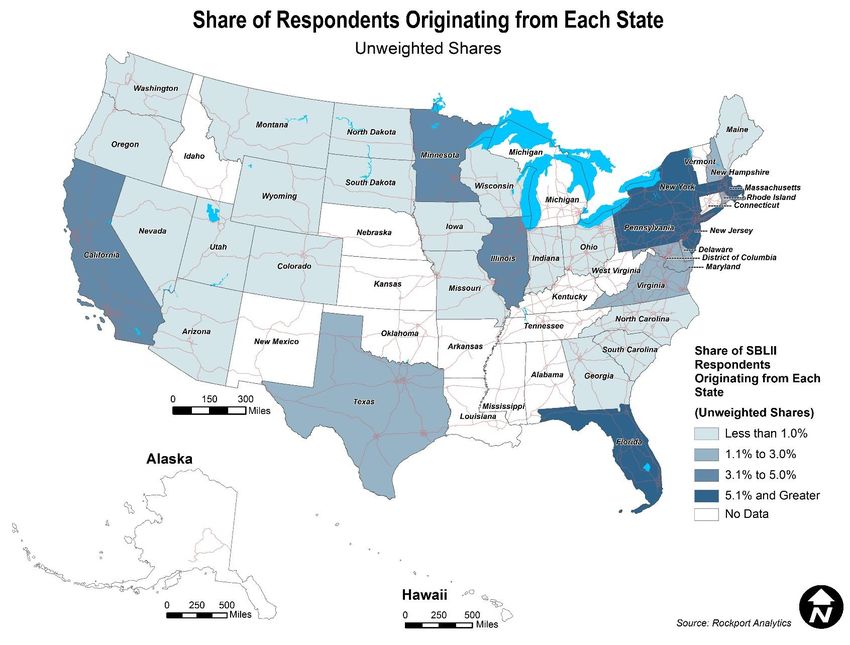
Eagles vs. Patriots: Pennsylvania, Massachusetts,
                                               NJ and NY Drove Visitation to Super Bowl LII

Copyright © 2018 Rockport Analytics, LLC. All Rights Reserved.                           9
Super Bowl-Initiated Gross Spending
                                                                      Eclipsed the $450 Million Mark
  Super Bowl LII Brought Substantial Spending to MSP                                               • SBLII brought 125,000 non-resident visitors to
                                                                in millions of $                     MSP who spent over $271 million on hotels,
                                                  Pre-                                               food, transportation, shopping, and entertainment.
                                                 Event             Post-                           • SBLII visitors spent an average of $608 per
               Category                         Estimate           Event           Difference        day in MSP. Typical tourism spending averages
                                                 (April            Actual                            about $124/day**
                                                 2016)                                             • Local hosting expenditures outpaced
 Game Attendee/Visitor*                            $284.8           $271.0           ($13.8)         previous SBs as the NFL, broadcast networks,
 Game, Broadcast, Event                                                                              and other hosting partners spent significantly more
                                                 $ 121.8            $179.4              $57.6        at SBLII. More than $179 million was spent
 Operations and Promotion
                                                                                                     locally.
*Total  Gross
 Excludes        SBof LII
          the value   SBLIISpending                $ 406.6
                            ticket purchases, assumed   to immediately$450.4
                                                                       leave MSP & MN   $43.8
** Meet Minneapolis, D.K. Shifflet 2014 adjusted for inflation                                     • Accommodations includes hotels (@$66 million)
                                                            Super                                    and peer-to-peer rentals (@$15 million).
           Gross Non-Resident Visitor
                                                           Bowl LII                                • Resident spending, although significant, was not
                                                          Spending
                   Spending
                                                                            % of Total               included in the spending or economic impact
                                                             (in
                                                                                                     figures.
                                                          millions)
      Air (portion assigned to MSP)                          $10.1             4%
      Retail & Shopping                                      $28.5             11%
      Accommodations                                         $81.6             30%
      Food & Beverage                                        $61.3             23%
      Rental Car                                             $19.1             7%
      Entertainment*                                         $34.5             13%
      Other Ground Transportation                            $23.7             9%
      Other –e.g. travel arrangement,
                                                               $12.3           5%
      laundry, other personal services
      Total Visitor Spending                                 $271.0           100%
                                                                                                Source: Smith Travel Research, AIrDNA, NFL, NBC, ESPN, Rockport Analytics
        Copyright © 2018 Rockport Analytics, LLC. All Rights Reserved.                                                                                                      10
Super Bowl LII –February 4, 2018 How Did SBLII Benefit the Minneapolis & Minnesota Economies? Copyright © 2018 Rockport Analytics, LLC. All Rights Reserved. 11
From Gross Spending to the Incremental
                                                  Economic Contribution of SBLII
                                                                   • All local game attendee/visitor, event
What was Spent                         Gross SBII                    operations, and game, broadcast, and
                                                                     promotions spending
  Locally by All                       Spending                    • Subtracts any MSP resident spending
                                                                     or hosting expenses that went to
   Participants                       $450 million                   vendors outside of Minnesota

                                                                       Less              • Average 2012-2017 MSP tourism spending for same 7-day
                                                                     Displaced             period, 82% of which was displaced by SBLII
                                                                   MSP Tourism           • Source: Meet Minneapolis, D.K. Shifflet, STR, Rockport
                                                                   ($80 million)           Analytics based on 5-yr averages for Jan 26th-Feb 5th

                                                                                        Equals Net
                                                                                       Incremental                • Net new spending brought to
                                                                                      SBLII Spending                MSP by SBLII
                                                                                       $370 million
                                                                                                              Less Goods & Services
                                                                                                                from outside of GH
                                                                                                              ($78M) plus Economic
                                                                                                               Ripple Effect +$108M

                                                                                                                                    Net SBLII-
                                                                                                                                     Initiated
                                                                                What Stayed Behind                                Contribution to
                                                                                to Contribute to the                              MSP/MN GDP
                                                                                 MSP/MN Economy                                    $400 million

                                                                              For every $1 spent at SBLII, the MSP/MN economy retained $0.88

  Copyright © 2018 Rockport Analytics, LLC. All Rights Reserved.                                                                                    12
Even After Netting Out Displaced Tourism
SBLII’S Contribution Remains Impressive
Displaced tourism is projected using
SBLII Bottom Line for MSP & MN Meet Minneapolis/D.K. Shifflet/STR
estimates of annual visitor spending
For the Minneapolis-St. Paul Displaced Net* adjusted for typical SB week tourism
Gross
MSA: Tourism Incremental across MSP.
Contribution
in millions of $ unless otherwise noted Offset Contribution 82% of regular tourism was assumed
to have been displaced by SBLII,
Total Spending $450.4 ($80.5) $369.9 based upon daily hotel occupancy
differences and SBLII ADT rate
compression.
Total Economic Impact:
Contribution to GDP $477.4 ($77.4) $400.0
Includes both full and part-time
Direct Impact $243.1 ($40.9) $202.2 workers expressed in annual
Indirect Impact $106.8 ($16.6) $90.2 terms
Induced Impact $127.5 ($20.0) $107.6
Jobs Supported (annualized) 6,760 (1,270) 5,490 Total estimated gross state & local
taxes include all tax types comprising
Contribution to Area Payrolls $323.8 ($50.8) $273.0 transaction (e.g. sales, hotel,
entertainment, etc.), income, and
Total Tax Receipts $116.3 ($22.5) $93.8 property.
Federal $70.6 ($11.4) $59.2
State $27.4 ($6.6) $20.8
Local $16.1 ($4.5) $11.6
* After removing displaced tourism typical for 10-day period in Late Jan/early Feb
Source: Rockport Analytics, MSBHC, Smith Travel Research, AirDNA, Meet Minneapolis, NFL, NBC, ESPN, IMPLAN
Copyright © 2018 Rockport Analytics, LLC. All Rights Reserved. 13SBLII Brought Significant Net Fiscal
Benefits to MSP & Minnesota
Minneapolis-St Paul-Bloomington Super Bowl LII Tax Overview
Transaction taxes are estimated using
in thousands of dollars
spending by category and appropriate
Gross Displaced Net tax rates less any exemptions (i.e.
Contribution Tourism Contribution
sales tax on grocery store food
Federal Taxes $70,609 ($11,373) $59,236 purchases). Note: sales tax on game
tickets has been excluded.
State Taxes $27,430 ($6,620) $20,810
Sales $17,118 ($3,769) $13,349
State & Local tax totals also include other
Rental Car $2,217 ($591) $1,626
tax types such as corporate income
All Other State Taxes $8,095 ($2,260) $5,836
(state) and property (local). These are
Local Taxes $16,128 ($4,499) $11,629 derived by the IMPLAN economic model
of MSP
Lodging $1,044 ($259) $785
Entertainment $338 ($229) $109
A prorated portion of residential &
Restaurant + Liquor $1,122 ($202) $920
commercial property taxes are included
Hennepin County Sales $168 ($48) $120
based upon SBLII wages (residential) and
Minneapolis Sales $116 ($68) $48
revenue (commercial). Property taxes are
Hennepin Transit Sales & Use $413 ($160) $253
estimated within the IMPLAN model.
All Other Local Taxes $12,927 ($3,533) $9,394
$91,675 Normal tourism-initiated taxes for a typical
Total SBLII-Initiated Taxes $114,166 ($22,492)
10-day period in late January-early
Addendum: February. These receipts are assumed to
have been displaced by Super Bowl LII.
SBLII-Initiated State & Local Taxes $43,558 ($11,119) $32,439
Source: Rockport Analytics, IMPLAN, City of Minneapolis, Minnesota Department of Revenue
Copyright © 2018 Rockport Analytics, LLC. All Rights Reserved. 14SBLII-Initiated Gross State & Local Taxes
by Source
Super Bowl LII Minnesota State Gross Super Bowl LII
Tax Receipts Gross Local* Tax Receipts by Source
Total = $27.4 million Total = $16.1 million
Personal Other Licenses, Hotel Tax
Corporate Income Hennepin Food, Beverage Fines & Fees 6%
18% & Liquor 1%
Income County Transit
4% Social Sales & Use 7% Entertainment
Insurance 3% Taxes
Taxes 2%
1% Minneapolis
Sales Tax
Other Business 1%
Taxes
3%
Hennepin
Sales Taxes Property Taxes
County Sales
62% Tax 79%
Excise & Fees
4% 1%
Rental Car
Excise
8%
* Minneapolis-St. Paul-Bloomington Metropolitan Statistical Area
Source: Rockport Analytics, IMPLAN, Minnesota Department of Revenue
Copyright © 2018 Rockport Analytics, LLC. All Rights Reserved. 15How Did Local MSP/MN Industries &
Businesses Benefit?
Net SBLII-Initiated Value-Added (GDP) Direct Visitor Indirect Value-Added
Induced
by Sector & Game (Supply Total essentially describes
(Income)
(in thousands of current $) Operations Chain) net SBLII-initiated
Total Net GDP Contribution $202,191.1 $90,208.4 $107,552.0 $399,951.5 revenue that was
11 Ag, Forestry, Fish & Hunting $0.0 $95.1 $211.3 $306.3 retained in MSP
21 Mining $0.0 $577.7 $374.0 $951.7
22 Utilities $686.4 $3,547.6 $1,888.1 $6,122.1 The Direct amount
23 Construction $8.3 $2,780.0 $1,010.8 $3,799.1
(2nd column) accrued
to businesses that
31-33 Manufacturing $2,845.3 $4,012.5 $2,843.2 $9,701.1
either served visitors
42 Wholesale Trade $603.4 $4,019.1 $6,150.2 $10,772.6
or participated in
44-45 Retail Trade $2,805.4 $2,496.1 $9,334.2 $14,635.7 hosting SBLII
48-49 Transpo & Warehousing $12,675.2 $2,272.0 $2,255.3 $17,202.5
51 Information $15,437.8 $7,275.6 $4,391.5 $27,104.8 Indirect (3rd column)
52 Finance & Insurance $0.0 $7,802.6 $10,598.3 $18,400.9 describes revenue
53 Real estate & Rental $10,169.0 $16,008.1 $25,757.9 $51,935.0 that accrued to MSP
54 Professional- Services $13,200.3 $15,651.5 $5,590.0 $34,441.8 supply chain
55 Management of Companies $20,170.4 $4,218.7 $1,581.1 $25,970.2
businesses
56 Administrative Services $23,890.1 $8,819.8 $3,131.7 $35,841.7 The Induced (4th
61 Educational Services $0.0 $165.3 $2,147.6 $2,312.9 column) measures
62 Health & Social Services $32.4 $5.8 $16,951.2 $16,989.4 revenue that accrued
71 Arts, Entertainment & Recreation $20,310.8 $3,721.6 $1,846.5 $25,878.9 to businesses across
72 Accommodation & Food Services $65,087.8 $1,973.0 $5,698.9 $72,759.8 MSP from the
81 Personal Services $4,649.5 $3,560.0 $5,314.1 $13,523.5 spending of wages
92 Government $9,619.0 $1,206.4 $476.2 $11,301.6 paid to SBLII workers
Copyright © 2018 Rockport Analytics, LLC. All Rights Reserved. 16SBLII Exposed Minneapolis to Visitors &
Football Fans From Around the World
While the focus of this study is on the short term economic
impact hosting the game will have on the MSP metro, there is Was this your first visit to the
an obvious longer-term benefit to showcasing Minneapolis to Minneapolis-St Paul area?
the world…
• SBLII was viewed by 103.4 million fans from around the No, 34%
world*
• The trip to Minneapolis for the Super Bowl was the first visit
to the city for two-thirds of Super Bowl visitors
• 83% of first-time SBLII visitors plan to return to Yes,
Minneapolis in the future. Meanwhile, 93% of all Super 66%
Bowl visitors plan to return.
Source: Rockport Analytics, SBLII intercept surveys, February 2018
• Meet Minneapolis reports that meeting/convention Do you plan to return to the MSP
leads are up 30% since SBLII was announced. Booked area in the future?
room nights are 11% higher. Leads were up 10% YoY in
50%
the first 4 months of 2018 alone. 45% 42% 43%
40%
* The Nielsen Company
35%
30%
25%
20%
15%
8%
10% 6%
5%
0%
Yes, for Yes, for Yes, for both No, I would
pleasure business not return
Source: Rockport Analytics, SBLII intercept surveys, February 2018
Copyright © 2018 Rockport Analytics, LLC. All Rights Reserved. 17Super Bowl LII –February 4, 2018 Super Bowl LII Impact in Perspective Copyright © 2018 Rockport Analytics, LLC. All Rights Reserved. 18
SBLII Economic Impact in Perspective

How Did SBLII Benefit MSP & Minnesota?
By Promoting Minnesota Jobs
SBLII supported the equivalent of 5,490 new annual jobs in MSP paying an average wage equivalent of $50,000 per year
By Building MSP Tourism
SBLII’s $271 million in visitor spending will boost annual MSP tourism by an estimated 3.5% in 2018 -all during a 10-day period
during the low season! Moreover, many visitors and meeting planners impressed with MSP & Minnesota will return to build
future tourism -more than 83% of first-time SBLII visitors indicated that they planned to visit again. Meeting/Convention leads
and booked room nights are also up more 30% since the SB was announced, by 10% in the first months of this year alone. New
interest was also fueled by 8.8 million Twitter impressions, 5.4 million Facebook impressions, 3 million pageviews on
MNsuperbowl.com, and 103 million broadcast viewers of Super Bowl LII.
By Helping to Relieve the Tax Burden of Minnesota Households
SBLII generated about $15 per MN household in state & local tax receipts. Since no resident spending was included in
the economic impact analysis, these tax receipts are net new to state and municipal government budgets.
By Capturing and Retaining Local Expenditures Made on Behalf of SBLII
For every $1 spent at SBLII, the MSP economy retained about 88 cents; 68 cents of that retained benefit went towards paying
MN workers a total of $273 million in wages and salaries. And 8 cents of each SBLII dollar went towards the payment of state &
local taxes.
By Fueling Charitable Giving Benefiting Kids Statewide, with Benefits Long After Gameday
The Minnesota Super Bowl Host Committee’s Legacy Fund provided grants to organizations statewide promoting the health and
wellness of Minnesota kids, with a total impact of more than $5.5 million across the state.

  Copyright © 2018 Rockport Analytics, LLC. All Rights Reserved.                                                                  19
At $477M, SBLII Gross Impact Among
Highest Since 1988
Super Bowl Gross* Economic Impact Estimates Why the Broad Range?
1989-2018 • The Super Bowl has grown significantly as a mega-
$750 Phoenix event. More/bigger ancillary events, longer durations, more
out-of-town staff, more visitors…
• Different authors, methodologies, data integrity -some
IN MILLIONS OF $ OF TOTAL ECONOMIC IMPACT (GDP)
$650 more conservative than others
New York
• Estimates vs. Hard Data: Cooperation from NFL, NBC,
ESPN, corporate sponsors, state and local government?
$550 • Time: inflation naturally lifts the value of all spending
Minnesota
New Orleans SBLII • Relative Cost of Living -MSP’s cost of living is higher than
Miami Miami many other host cities (e.g. Detroit, Indianapolis, Houston)
Miami
$450 • MSP previously hosted Super Bowl XXVII in 1992–impact
New Orleans
Houston SBLI estimated @ $176 million ($364 million in today’s dollars)
San Diego
San Diego
Tempe New Orleans Phoenix Gross
$350 Miami Super Economic
Year Host City
Atlanta Houston Bowl Impact
Miami Indianapolis
Tampa (in millions $)
Pasadena New
Detroit 2010 XLIV Miami $ 333
$250
San Francisco 2011 XLV Dallas $ 200
Jacksonville Dallas
Tampa 2012 XLVI Indianapolis $ 324
Atlanta 2013 XLVII New Orleans $ 480
$150
Minneapolis 2014 XLVIII New York $ 600
1988 1993 1998 2003 2008 2013 2018 2015 XLIX Phoenix $ 719
* before subtracting estimates of displaced tourism 2016 50 San Francisco $ 260
Source: University of New Orleans, Coates and Humphreys, UCLA/LA Sports Council, Price waterhouse Coopers, 2017 LI Houston $ 426
Depken and Wilson, Rishe, Greater Miami Convention and Visitors Bureau, San Diego Citizen’s Task Force, Rockport Analytics
2018 LII Minnesota* $ 477
Copyright © 2018 Rockport Analytics, LLC. All Rights Reserved. 20Methodology and Data Sources
Task Methodology/Approach Data Sources
An intercept survey was fielded at a number of locations including (1)
throughout the skyways around Super Bowl Live, (2) the NFL Experience at the
Minneapolis Convention Center, and (3) US Bank Stadium. A total of 967 • Intercept survey –Rockport Analytics
completed interviews were collected covering topics such as visitor origin, • Smith Travel Research (STR)
Estimate SB-initiated
travel party size, length of stay, spending across an array of categories, and • NFL, ESPN, NBC
Visitor Spending
typical demographics. The survey was supplemented by actual hotel data • Minnesota SB Host Committee
during the 10-day period from STR. Finally, actual travel & entertainment data • Various Corporate Sponsors
was collected from most of the major operational, broadcast, and event hosting
organizations.
Actual and/or estimated operations, broadcast, and event spending was
• Minnesota Super Bowl Host Committee
Estimate SB-initiated collected directly from SBLII’s major hosting organizations. Care was taken to
• NFL, NBC, ESPN, Mall of America
MSP Game, Broadcast eliminate any double counting, as well as material, service, and supply
• Corporate event planners
& Event Operations purchases made with vendors outside of Minnesota. In addition, an online
• City of Minneapolis
Spending survey of corporate event sponsors was used to estimate local ancillary event
• Metropolitan Airports Commission, MTA
hosting expenditures.
Translate spending into Spending streams for visitors and operations by detailed category were entered
economic impact on into the latest (2016) IMPLAN economic model of the MSP metropolitan • IMPLAN (www.implan.com)
Minneapolis & statistical area. Contributions to GDP, jobs, wages, and taxes are estimated by
Minnesota the model.
Calculate Minnesota &
Taxes directly applicable to visitor & operational transactions are calculated
local Minneapolis-St. • Minnesota Department of Revenue
using the categorical spending totals described above against appropriate
Paul-Bloomington • City of Minneapolis, Hennepin County
current tax rates less any exemptions (e.g. sales tax on groceries, clothing)
taxes
SBLII was assumed to have displaced most of regular tourism during Jan 26-
Estimate displaced Feb 5th period. Displaced tourism’s impact was estimated and subtracted from • Meet Minneapolis, D.K. Shifflet
tourism & calculate net the gross SBLII impact calculations to arrive at a net contribution. Displaced • STR daily hotel activity during Jan 26-Feb 5
SB LII impact tourism was estimated by using the 2012-2017 average of tourism spending in • IMPLAN model of MSP
MSP using seasonal tourism spending and daily hotel performance.
Copyright © 2018 Rockport Analytics, LLC. All Rights Reserved. 21Glossary
• Visitor -someone who has either stayed overnight
(regardless of origin) or traveled a distance of at least 50
miles one way during a day trip
• Gross Impact –economic impact of all SBLII-initiated gross
spending in MSP/ Minnesota
• Net Impact –the gross economic impact less the value of
regular MSP leisure and business tourism displaced by SBLII
• Direct Impact –benefit that accrues to those MSP
businesses that directly serve SBLII game attendees, visitors,
and out-of-town staff; plus businesses directly involved with
hosting operations, broadcast, and ancillary events.
• Indirect Impact –benefit to the many local upstream firms
that populate the supply chain of SBLII direct businesses
• Induced Impact –both direct and supply chain businesses
pay wages to their workers. Much of these local wages will
be spent in MSP throughout the year at business that provide
a broad range of consumer goods and services. Sometimes
referred to as the “ripple effect”.
• Leakages –that portion of gross spending that leaves the
MSP/MN economy: (1) as profits to non-MSP headquartered
businesses, (2) because of unavailable or insufficient local
supply, (3) non-local vendor choice, and/or (4) from reduced
downstream spending caused by savings, debt reduction, or
excess inventories.
• Displaced Tourism –the level of regular leisure and business
travel & tourism that is displaced by a mega-event. This is
subtracted from gross spending surrounding the event to
arrive at net incremental expenditures.
Copyright © 2018 Rockport Analytics, LLC. All Rights Reserved. 22About Rockport Analytics
Rockport Analytics is a research and analytical consulting
firm providing high quality quantitative and qualitative
research solutions to business, government, and non-
profit organization clients across the globe. We provide
fast, nimble service in a completely transparent
environment.
Capabilities include:
• Market Analysis and Forecasting
• Economic Impact Assessment, Tourism Satellite
Accounting, and Economic Development
• Market Modeling and Decision Support Tools
• Project Feasibility Assessment
• Primary and Secondary Research Synthesis
• Stakeholder Surveys – internal & external
Recent client examples include: Greater Houston Super Rockport Analytics LLC
Bowl Host Committee, the Orange Bowl Committee, U.S. West Chester, PA
Travel Association, Global Business Travel Association, Annapolis, MD
MPI, Indianapolis Super Bowl Host Committee, Delaware
web: rockportanalytics.com
Tourism Office, Indiana Office of Tourism Development,
email: info@rockportanalytics.oom
Boeing, Visa, American Express, Carlson Wagonlit, IHG,
phone: (866) 481-9877
Annapolis CVB…
Copyright © 2018 Rockport Analytics, LLC. All Rights Reserved. 23You can also read