THE CAMBRIDGE WEEKLY 4 February 2019
←
→
Page content transcription
If your browser does not render page correctly, please read the page content below
THE CAMBRIDGE WEEKLY
                          4 February 2019

                                Lothar Mentel
                     Lead Investment Adviser to Cambridge

DISCLAIMER

This material has been written on behalf of Cambridge Investments Ltd and is for
information purposes only and must not be considered as financial advice.

We always recommend that you seek financial advice before making any financial
decisions. The value of your investments can go down as well as up and you may
get back less than you originally invested.

Please note: All calls to and from our landlines and mobiles are recorded to meet
regulatory requirements.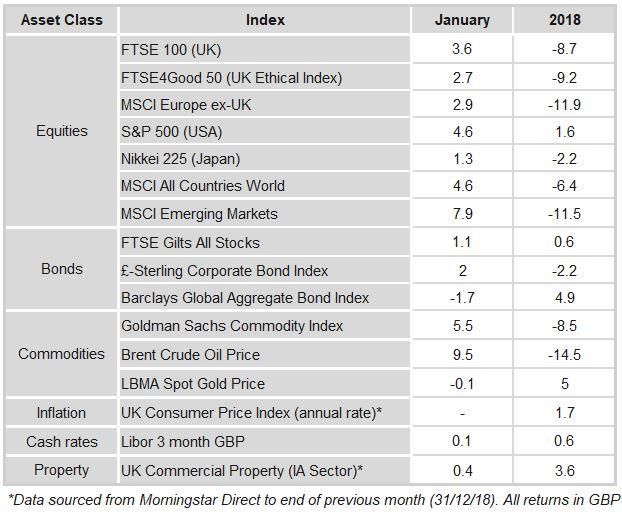
4th February 2019

                               Hedgeye - Central bank fairy godmother - Jan 2019

                                             Turnaround?
The first month of 2019 is over already and the new year has brought quite a remarkable turnaround for
investors compared to the last month of 2018. Global equity markets have recovered to the tune of 7%,
but most other asset classes have done so as well which is just as rare as was last year’s return dearth
across the board. After taking in the January 2019 asset returns as per our regular table below, UK
investors are forgiven to suspect Brexit shenanigans to be responsible for having missed out. The
opposite is the case: £-Sterling has risen on the back of optimism for a softer Brexit amongst
international investors and this increase in the pound’s purchasing power abroad makes up the difference.

www.cambridgeinvestments.co.uk | enquiries@cambridgeinvestments.co.uk
Tel : 01223 365 656 | CB1 Business Centre, 20 Station Road, Cambridge, CB1 2JD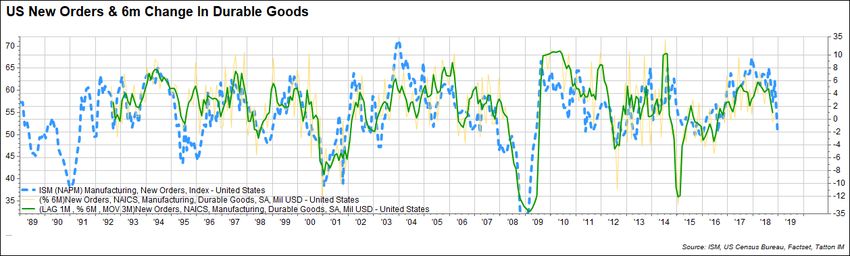
4th February 2019

We have written over the past weeks how this capital market turnaround must seem incomprehensible
to outsiders, but that it has as much to do with global liquidity conditions easing as last year’s sell-off had
all the hallmarks of a distinct liquidity squeeze. This week then, the most watched provider of monetary
liquidity for global financial markets – the US Federal Reserve central bank – indicated that they would be
likely refrain from further interest rises for the time being. They even went further than markets had
hoped and hinted that they may scale down the rate at which they are reducing their balance sheet and
thereby the US$ in circulation through quantitative tightening (QT).

The rate pause announcement fulfilled market expectations of the last weeks that the US Fed was not
about to commit a policy error through continued rate rises when the US economy was clearly slowing
and thus reducing the risk of inflationary pressures from economic overheating. However, the hint that
they may also slow down the reversal of quantitative easing (QE), if required, got capital market
commentators and analysts very excited.

This is because there has long been an observation that if capital markets show any sign of stress – like
last year end’s sell-off – then the central bank will come to the rescue and protect investors from
suffering too harsh a fall. Ultimately, these voices argue, this leads to irresponsible risk taking by overly
confident investors which causes asset bubbles and much more severe collapses of part or all of the
financial markets. The Global Financial Crisis of 2008/2009 (GFC) and the commodity market collapse of
2014/2015 are cited as validations.

We would agree that to capital markets this 180 degree turn by the Fed, compared to their December
statement, must seem like a return of too soft a central bank stance, given markets have already
recovered and a pausing of further rate rises should have sufficed to keep them relatively stable.
However, to our mind the scathing critique from capital market commentators is simply an expression of
their self-important assumption that Fed actions are primarily aimed at them rather than the economy.

As we discuss in the second article this week, the US economy has slowed much faster and more broadly
than had been previously forecast and as a result the US central bank no longer saw reason for slowing
the economy through monetary constraint. As we have written before, the unwind of the extraordinary
monetary easing measure of QE through QT is as much uncharted policy territory as QE was in the first
place. Central banks simply cannot know how much reduction of primary monetary liquidity is adequate
and necessary to prevent the next (aforementioned) asset bubble from building and/or the economy from
overheating.

2018 has taught US central bankers that they may have slightly overshot target, once adverse rather than
stimulating ‘Trump effects’ entered the equation. Now that low grade credit provision through leveraged
loan instruments has markedly slowed and equity markets no longer trade close to bubble territory, they
have relaxed and are willing to support US businesses with lower cost of capital to cope with the
Trumpian headwinds. This bodes well for stock markets who have tended to perform well during
economic slowdowns that were accompanied by accommodative monetary policy.

Before anyone gets too carried away in their market optimism, such central bank intervention could
prove quite temporary. Should the main economic worry points of trade tensions between the US and
China and a disorderly Brexit be resolved then we are likely to experience a profound enough

www.cambridgeinvestments.co.uk | enquiries@cambridgeinvestments.co.uk
Tel : 01223 365 656 | CB1 Business Centre, 20 Station Road, Cambridge, CB1 2JD
4th February 2019

reacceleration of the global economy for central banks to just as swiftly resume their monetary tightening
course.

From this turnaround angle, Trump’s optimistic announcement that a breakthrough in the US-Sino trade
negotiations is imminent could be a first sign that there may indeed be light at the end of the tunnel. The
UK parliament’s ability to unite behind a proposal rather than a rejection could be interpreted as another
positive. The muted market reaction to either tells us that ‘Mr Market’ foresees more pain before there
may be gain. For the moment we welcome the FTSE100 back above the 7,000 index mark, but caution
investors not to overinterpret January’s positivity as the likely market trajectory for all of 2019.

The easing of liquidity has certainly helped to pull asset valuation up from the oversold conditions of last
year. However, for January’s partial recovery to turn into a full recovery and beyond, we will need to see
a sustained turnaround in economic momentum from slowing, back to accelerating. From such a
perspective we just about make out tepid signs of improvement in certain economic indicators, but
together with other less positive macroeconomic data flow this currently amounts to no more than an
inkling that we may have reached the low point of this mini-cycle.

Capital markets tend to look ahead and it can therefore be argued that the current slowdown has already
been reflected in the disappointing 2018 returns. While this may well be so, it is also true that for a
positive first month to turn into a positive year overall, there are still many hurdles and sources of
renewed doubt ahead to make further market developments all but smooth.

                            US economy slowing but not stopping
Capital markets have ended January feeling positive. But that’s probably not in response to improving
economic data; it’s probably because of the response to the response.

In a press conference, Federal Reserve chair Jerome Powell appeared far more dovish (I.e. not inclined to
raise interest rates further) than before, calming fears that liquidity would run dry as monetary policy
tightens. After the Fed left interest rates unchanged, Powell’s language suggested to markets that the
central bank’s move could either be up or down – a far cry from last month’s suggestion of a further two
rate hikes this year.

Have recent “cross currents” made a change of policy guidance necessary? Is it about slowing growth,
trade tensions, and the US government shutdown? Or is it that, by changing the path of monetary policy,
Fed officials are merely making their own lives easier? Let’s face it, President Trump has made no secret
of his disapproval of the Fed’s rate-hiking path, calling Powell “crazy” just a few months ago, and
suggesting he’d made the wrong choice in appointing the Fed’s chair.

www.cambridgeinvestments.co.uk | enquiries@cambridgeinvestments.co.uk
Tel : 01223 365 656 | CB1 Business Centre, 20 Station Road, Cambridge, CB1 2JD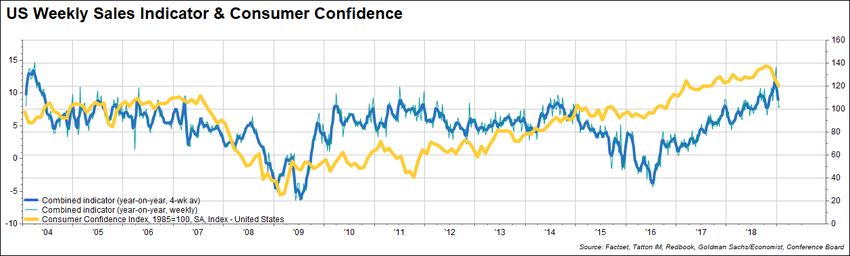
4th February 2019

But there’s a reasonable argument to make that the change of policy makes sense. Recent data has made
it clear that a US economic slowdown isn’t near; it’s here. According to economist estimates, GDP grew
at an annual rate of 2.6% in the fourth quarter of 2018, coming down from a peak of 3% the quarter
before. And growth this year is expected to slow even more markedly. Asked about US prospects in Q1
2019, economists such as those at JP Morgan predict an annual growth rate of just 1.8%. As we have
written recently, survey data – particularly for manufacturing – is showing a similar decline. As the chart
below shows, new orders for manufacturers are less positive than through most of last year.

This, combined with (and possibly partly caused by) a big tightening of financial conditions over the past
few months as the withdrawal of central bank purchases soured risk appetite among investors, has left
markets with very little liquidity. Even disregarding market moves and the President’s itchy twitter finger,
a moderation in monetary tightening seems an appropriate response to more trying conditions.

There are extenuating circumstances of course. The recent cold weather has likely had an effect on
consumers’ purchasing habits, and the longest government shutdown in US history will inevitably cause a
slump in the data. Both of these are (hopefully) transitory, and as they clear up the outlook should
improve. Economists already expect growth to rebound in Q2 to 2.5%.

But, fact is that the incoming data no longer looks as good as it did a year ago. Last year’s stellar growth
numbers in the world’s largest economy were fuelled largely by strong consumer demand. Recent signs
point to a slowing of consumer confidence, however. As shown in the chart below, the American
consumer confidence is falling. And while not yet a major cause for concern, this will likely slow demand

www.cambridgeinvestments.co.uk | enquiries@cambridgeinvestments.co.uk
Tel : 01223 365 656 | CB1 Business Centre, 20 Station Road, Cambridge, CB1 2JD
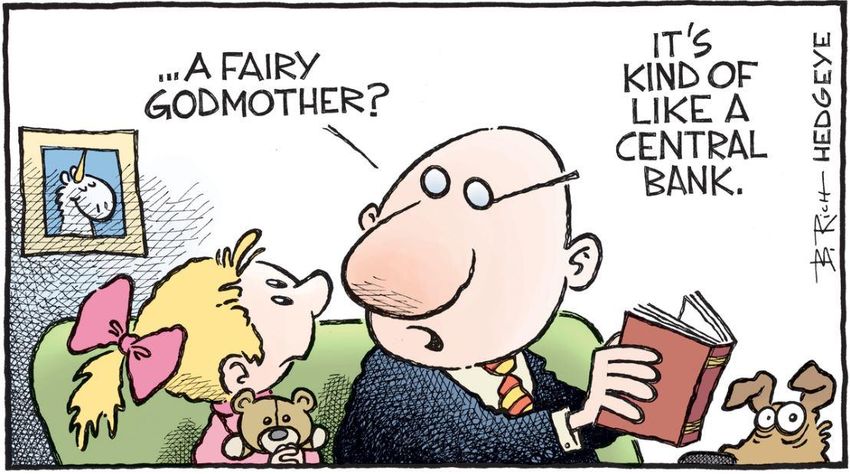
4th February 2019

and the economy with it.

Consumer confidence is affected by many things, but the stability of the jobs market has always been the
most important factor. Underpinning the extraordinarily long period of US growth has been the fall in
unemployment (or rather the growth of employment).

This week’s US jobs growth data (non-farm payrolls) for January surprised forecasters with another
higher-than expected monthly gain in payrolls: a rise of 304,00 versus an expected 165,000. However,
these data are often revised substantially and that was the case this time, with the previous two months’
data being reduced by a total of 70k. Meanwhile, the unemployment rate rose to 4% from 3.9% in
December.

In gauging US employment, we think it’s worth including other sources. The chart below shows two
different measures that we monitor.

The weekly unemployment claims data records those making an initial claim and those continuing to
claim. Although insurance is only available for 6 months, the change in continuing claims over a 13-week

period can indicate if the people are getting employed or not.

The lower chart is formed from data provided by Challenger, Gray & Christmas, the oldest executive
outplacement firm in the US. It has offices throughout North America. Since 1994, they’ve counted “job
cuts”. It’s likely that the count will be biased towards larger firms.

The upper chart shows that continuing claims has, for the first time since 2010, moved into a quarterly
increase in claims. It’s going to have been affected by the government shutdown. That is why the chart
that shows a pickup in job cuts earlier in the year is important; the continuing claims increase may not be
just down to a one-off factor. Certainly, the job market is still tight, but the fall back in consumer
confidence may be warranted.

There’s another reason to be more concerned about the US than the rest of the world.

www.cambridgeinvestments.co.uk | enquiries@cambridgeinvestments.co.uk
Tel : 01223 365 656 | CB1 Business Centre, 20 Station Road, Cambridge, CB1 2JD
4th February 2019

America rode the sugar high of Donald Trump’s tax cuts last year and the year before, but those
stimulatory effects are wearing off. While the US accelerated faster than the rest of the world before, its
deceleration could also be more sudden.

The government’s budget position is of particular concern. After the “boom-bust” 1950s and 1960s,
political consensus moved during the 1970s towards counter-cyclical fiscal policies (as suggested by JM
Keynes) – with the government raising debt and generating demand when growth is low and savings high,
and drawing it down in the opposite scenario. But Trump’s fiscal expansion came at a late cycle point
when demand was high, not low, meaning stellar growth has been coupled with (perhaps generated by)
loose fiscal policy.

That drastically tightens the government’s room for manoeuvre when conditions take a downturn. It also
heightens the risk attached to US government bonds. Just this week, the government announced plans to
issue a record-breaking amount of debt to cover tax-cut losses and increased spending. This, combined
with the Fed’s balance sheet reduction and a slowing economy, makes for a dangerous combination.
According to Powell, the government budget is “on a dangerous path that needs to be addressed…”

As we look toward the end of the year, that leaves us with two options: either the deficit keeps
ballooning, potentially tightening credit markets to the point of a sustained credit cycle downturn leading
to a repeat of December’s market panic; or the government is forced to tighten fiscal policy just as the
economy slows, exacerbating the downturn. Neither of those point to good scenarios. But given that the
leaders of both political parties seem to have accepted loose fiscal policy tout court, the former is more
likely. As does President Trump’s falling popularity – heightening the chance he’ll eschew fiscal discipline
for vote-winning policies.

This puts the US on a potentially weaker path than the rest of the world, but it doesn’t suggest a crash.
Contrary to the implied market expectations at the end of last year, we have yet to see any looming
recession in the current data. And while the risks mentioned are there, the slowing economy itself should
provide enough counterbalances to stop a major downturn. Worsening conditions should keep a lid on
US bonds, and low inflation from slowing global growth should support consumer demand somewhat.
The US is slowing down, but it’s unlikely to come to a halt anytime soon.

                                        Gold and real yields
Wikipedia says the following:

“It is impossible to know the exact date that humans first began to mine gold … but a group of German
and Georgian archaeologists claims the Sakdrisi site in southern Georgia, dating to the 3rd or 4th
millennium BC, may be the world's oldest known gold mine.

…Some of the oldest known gold artefacts were found in the Varna Necropolis in Bulgaria. The graves of
the necropolis were built between 4700 and 4200 BC, indicating that gold mining could be at least 7000
years old…“

www.cambridgeinvestments.co.uk | enquiries@cambridgeinvestments.co.uk
Tel : 01223 365 656 | CB1 Business Centre, 20 Station Road, Cambridge, CB1 2JD
4th February 2019
There’s no doubt that refined gold is attractive. Its immutability is probably the thing which ensures its
hold on us. It will outlast each and every one of us, and can be passed on after we’re gone. A standard
rectangular 1kg gold bar is only about 117mm by 53mm by 8.7mm (4.5 inches by 2 inches by 3/8 inch).
A typical shoe box full of gold would be worth over £3.75 million. It would weigh over 116kg! (1st Feb
2019: £32,516/kg). Having it does not require a small army to patrol its borders, although it would
require a lot of effort to move it.
It’s a physical, concentrated store of value. It does not require a contract to enforce ownership. This
makes it especially valuable if contracts become difficult to enforce, such as in times of a breakdown in
law and order. It’s no surprise therefore that people in fragile nations have higher ownership levels of
physical gold.
This aspect of gold, its store-of-value in extremis, is inextricable from its “inhumanness”. It is valuable
because it exists without human intervention (although for it to remain of value, a continuation of
humans’ desire to own it must perpetuate).
But the modern gold market has an inherent dissonance with this view of what makes gold valuable.
Virtually all forms of gold investment are offered in some secondary way. There’s gold exchange-traded
funds, such as the Wisdom Tree ETFS GBP Daily Hedged Physical Gold (abbreviated as “GBSP”). The
name suggests that you have physical gold. But their website says the following:
“GBSP is designed to track the Morgan Stanley Long Gold British Pound Hedged Index (the "Index"). The
product enables GBP investors to gain exposure to the gold spot price with a daily currency hedge
against movements in the GBP/USD exchange rate.
GBSP is an exchange traded commodity ("ETC"). Its securities can be created and redeemed on demand
by authorised participants and traded on exchange just like shares in a company. GBSP is backed by
physical allocated gold held by JP Morgan Chase Bank, N.A. and the provision of a daily currency hedge by
a FX counterparty. Only metal that conforms to the London Bullion Market Association's (LBMA) rules
for Good Delivery can be accepted by the custodian. Each physical bar is segregated, individually
identified and allocated.”
The owner of this “physical” gold instrument has at least four different contractual separations (five if
they hold the ETF on a platform). The chances of the owner being able to lay their hands on those
physical bars (or even knowing where the gold is) is virtually nil now, and certainly nil at the point when
the owner most wants it.
There are more direct ways to own gold, but most involve somebody else storing it and a contract to do
so. Even with this lesser degree of separation, accessing it can become a problem, as 20th century history
shows.
www.cambridgeinvestments.co.uk | enquiries@cambridgeinvestments.co.uk
Tel : 01223 365 656 | CB1 Business Centre, 20 Station Road, Cambridge, CB1 2JD4th February 2019
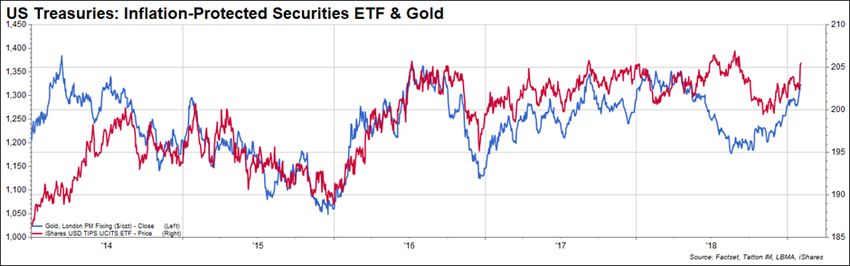
If an investor wants to hedge the effects of a destabilising slowdown in the world’s economy, an
alternative would be inflation-protected government bonds. Gold is more volatile, which might make it
more attractive (in terms of capital efficiency) but US Treasury Inflation-Protected Securities (TIPS) offer
a yield but in capital value terms behave very similarly:
The rationale for the similar price movements is this: if economic growth, institutional stability and
financial returns are decreasing, this makes non-returning assets like gold relatively more attractive. This
also applies to government bonds, which have a fixed real return but can vary with inflation. However,
unlike holding gold, which has virtually no ongoing yield, inflation linked government bonds (at least in the
US) offer both inflation protection and the real coupon.
So why have we gone to all this length to draw parallels between the price of gold and US inflation linked
government bonds? Well, firstly we think our readers are always interested in furthering their investment
insights, particularly regarding the mystic yellow metal. We hope to have shown that there are more
effective and convenient ways of hedging against ones fears of a looming downturn.
However, with the above article we also hope to have pointed out that the recent rise in the price of
gold is unlikely to be an expression of a spreading fear of a capital market collapse – as was the case
during and in the aftermath of the GFC ten years ago – but quite a rational consequence of falling real
yields against the backdrop of slowing global economic growth.
Huawei, 5G and the US-China trade war
Those who follow the news find one company regularly cropping up in the US-China trade war: Chinese
telecom equipment giant Huawei. Although not often directly mentioned, Huawei is a key player in the
rollout of next generation 5G mobile networks worldwide. On the surface, cars, soy beans and other
physical products garner most of the headlines in the US-China trade war. But there’s a deeper battle
here. Underneath trade concerns is an arms race to see who will get control of next generation
technology.
5G is at the centre of this battle. It’s the glue that holds together all the exciting new tech on the horizon.
Robotics, Driverless cars, airborne drone deliveries, Artificial Intelligence (AI), quantum computers, IoT
(Internet of Things) and a host of other technologies will all inevitably rely on 5G infrastructure. That also
means 5G – and who controls it – is a key national security concern.
www.cambridgeinvestments.co.uk | enquiries@cambridgeinvestments.co.uk
Tel : 01223 365 656 | CB1 Business Centre, 20 Station Road, Cambridge, CB1 2JD4th February 2019 That could help explain why Huawei’s CFO was detained in Canada, why the US has initiated criminal proceedings against Huawei for stealing US technology & breaking Iranian sanctions, why Western telco’s like Vodafone are halting/slowing purchases of Chinese made 5G equipment and why President Trump himself barred Singapore-based chipmaker Broadcom from acquiring US-based mobile chip specialist Qualcomm. The importance of 5G for future economic development cannot be overstated. Hyperbole aside, 5G brings the bandwidth (confusingly marketed as ‘speed’ to consumers) and low latency (also called ‘lag’ or how long it takes your device to get a response from another) needed to build the smart and interconnected world of tomorrow. Bandwidth is like the width of a water pipe. The wider the pipe’s diameter, the more that can flow through. But 5G brings more than just marginal improvements in connectivity. And the rewards for who runs it can be huge. After the introduction of 2G in the 1990s, a young and pioneering Qualcomm held a vast array of valuable patents on the US CDMA system (Code Division Multiple Access or the ability to send data from several transmitters over a single communications channel). Nokia & Ericsson led the European GSM system that was used everywhere bar the US and China. The Chinese opted to develop their own system, TDMA (T stands for Time). China didn’t want to rely on ‘western’ equipment makers but wanted to build up domestic expertise and create home grown equipment makers – leading to the birth of both ZTE and Huawei. When 3G technology came around, Qualcomm extended its reach to Europe and Japan, while ZTE and Huawei retained their Chinese dominance. The same was true for 4G – the first system to switch to data-led from voice-led. Despite the extra bandwidth, 4G did not fully live up to the hype, as high contention ratios (how bandwidth is shared among users) meant that theoretical speeds of 80-130Mbps were 10x lower in reality. Unsurprisingly, Qualcomm also owns the patents on 4G’s Orthogonal Frequency Division Multiplexing (OFDM). While once again, the patents for China’s TD-LTE revolve around Huawei and China Mobile. It’s not hard to spot a pattern in the ownership here. The technology cold war brewing beneath the surface expanded to include operating systems & app (application) stores – Google’s Android and Apple’s iOS dominate, smartphone CPUs & modems but also the ability to produce cutting edge (i.e. ever smaller) chips. Only Samsung, Intel and TSMC have the ability make cutting edge 7-10 nanometer or smaller chips. A nanometer is slightly larger than a single water molecule. At their core, smartphone CPUs are based on a UK designed (now Japanese owned – Softbank) ARM RISC (Reduced Instruction Set Computing) low power chip. Apple and Qualcomm take these reference designs and modify them to include specific customisations, such as graphics, but Chinese firms have rapidly gained ground and their custom designs are on par with those from the west. Leading the pack in China is, you guessed it, Huawei with its Kirin chips that are made in Taiwan (does that help explain China’s recent renewed interest in Taiwan?). China has been systematically trying to push out western technologies where possible, in favour of a home grown or at least home manufactured solution. This brings us back to 5G. 5G or NR (New Radio) www.cambridgeinvestments.co.uk | enquiries@cambridgeinvestments.co.uk Tel : 01223 365 656 | CB1 Business Centre, 20 Station Road, Cambridge, CB1 2JD
4th February 2019

is a Qualcomm led truly global standard and is an extension of its OFDM technology. Currently only
Qualcomm (Snapdragon X50) and Huawei (Balong 5G01) have 5G modems to communicate to the
network. But compared to the previous 4G experience, Huawei’s growing global clout has allowed it to
muscle its way into having a broader say on the NR wireless standard this time around.

In simple terms, expect 5-10x higher download speeds at extremely low latency (sub 1milisecond).
People have gotten used to gigabit (1gbps) internet speeds with home fibre connections, now imagine
that in your hand anywhere in the world. Faster downloads and low latency have a nice side effect of
extending battery life to around 2-3 days (or eventually 1 month according to Lowell McAdam, Verizon’s
CEO).

But as mentioned, there’s more than just mobile speed up for grabs. IoT will rely on 5G’s MTC or
Machine-Type Communication capabilities and connect an estimated 50 billion devices, or things,
together by 2020. Just imagine a driverless car being able to communicate with traffic lights for traffic
management, smart sensors around a city, smart home appliances (a fridge that automatically re-orders
milk when there’s little left), not to mention automated industrial production systems, health sensors
(these could be revolutionary for the NHS), drone deliveries, home robots, Virtual and Augmented
Reality and things we can’t probably conceive of right now.

The economic benefits of 5G are only likely to be felt in 10-15 years, but the numbers are massive. Some
good estimates suggest 5G could add $3.5 trillion to the global economy and support or create over 22
million jobs. 5G technologies will likely become embedded in a nation’s infrastructure and even in each
person’s way of life, just as the wired internet has today. It’s hard to imagine life without an internet
connection and the ability to instantly access information, to video call friends abroad or play a game with
anyone across the world. 5G will take all these things to the next level.

So, it’s easy to understand why governments around the world are increasingly concerned about the
ability of a state or private entity to illegally gain access to these networks to spy on another country or

to disrupt or degrade a nation’s infrastructure.

www.cambridgeinvestments.co.uk | enquiries@cambridgeinvestments.co.uk
Tel : 01223 365 656 | CB1 Business Centre, 20 Station Road, Cambridge, CB1 2JD
4th February 2019

This is why Huawei has come under such immense pressure, first from the US and also the UK,
Germany, Australia, Canada and others. Huawei is the largest provider of wireless network equipment,
with a 28% global market share. Huawei’s founder, Ren Zhengfei (and former army officer), said “I still
love my country, I support the Communist party, but I will never do anything to harm any country in the
world” and added that his company “stands on the side of customers when it comes to cyber security
and privacy”.

But given Beijing’s history of strong-arming Chinese companies, governments are worried that Huawei
might not have a choice but to comply with any requests if the Chinese government knocked on the
door. Matthew Whitaker, acting US attorney-general, speaking at the announcement of criminal
proceedings against Huawei, said the company’s actions were “serious” as it “appears to be using
corporate espionage and sanctions violations not only to enhance their bottom line, but also to compete
in the world economy. This is something the United States will not stand for.”

That seems clear. The question arises though: are the US moves against Huawei a negotiating tactic in its
trade war with the China, or is this a genuine attempt to remove what it sees as a potential national
security threat?

In any case, Huawei was tied closely to global telecoms firms as they gear up to launch their 5G
networks. The news that Vodafone, the world’s biggest mobile carrier outside of China Mobile, is halting
purchases or pulling Huawei’s equipment from the network means that such rollouts could be delayed,
putting at risk the billions of dollars of investments firms have made.

China has responded to US product bans by suggesting that domestic firms should only buy Huawei
phones and equipment and shun US brands. This has hit Apple particularly hard in recent months, on top
of the already slowing Chinese economy.

Hopefully the importance of 5G should now be clearer, as should why governments are acting against
possible security threats. One thing is clear, the arrival of 5G has the potential to enable far reaching
economic changes and new business models that will only be known in the years ahead. The true wireless
economy is almost here – as the raging battle over who will dominate it is showing.

www.cambridgeinvestments.co.uk | enquiries@cambridgeinvestments.co.uk
Tel : 01223 365 656 | CB1 Business Centre, 20 Station Road, Cambridge, CB1 2JD
4th February 2019
Global Equity Markets Top 5 Gainers Top 5 Losers
MARKET FRI, 16:30 % 1 WEEK* 1W TECHNICAL COMPANY % COMPANY %
FTSE 100 7020.2 3.1 211.0 Brit American Tobac 10.3 Hargreaves Lansd -8.1
Rio Tinto 9.1 TUI AG -4.3
FTSE 250 18811.4 0.9 167.8
Hikma Pharmaceutic 7.5 Hiscox Ltd -3.4
FTSE AS 3851.9 2.7 100.0 Evraz 7.2 Barclays -3.3
FTSE Small 5388.1 0.9 50.7 BHP Group 6.9 NMC Health -3.2
CAC 5019.3 1.9 93.4
DAX 11180.7 -0.9 -101.1 Currencies Commodities
PRICE LAST %1W CMDTY LAST %1W
Dow 25167.4 1.7 430.2 USD/GBP 1.31 -0.74 OIL 62.0 0.6
S&P 500 2712.1 1.8 47.3 USD/EUR 1.15 0.59 GOLD 1317.3 0.9
Nasdaq 6912.6 1.8 125.2 JPY/USD 109.54 0.01 SILVER 15.9 1.1
Nikkei 20788.4 0.1 14.8 GBP/EUR 0.88 -1.34 COPPER 277.0 1.5
CNY/USD 6.75 0.04 ALUMIN 1910.0 1.0
MSCI World 2028.5 1.3 26.6
MSCI EM 1049.9 1.7 17.6 Fixed Income
GOVT BOND %YIELD % 1W 1 W YIELD
Global Equity Market - Valuations UK 10-Yr 1.248 -4.4 -0.06
MARKET DIV YLD % LTM** PE NTM*** PE 10Y AVG US 10-Yr 2.684 -2.7 -0.07
FTSE 100 4.8 15.7x 12.4x 13.2x French 10-Yr 0.573 -4.2 -0.03
FTSE 250 3.6 21.0x 13.1x 14.1x German 10-Yr 0.166 -14.0 -0.03
FTSE AS 4.6 16.6x 12.4x 13.3x Japanese 10-Yr -0.012 -300.0 -0.01
FTSE Small 4 - 8.8x 14.0x
CAC 3.5 15.4x 12.7x 13.4x
DAX 3.2 12.5x 12.0x 12.6x
UK Mortgage Rates
MORTGAGE BENCHMARK RATES RATE %
Dow 2.3 16.3x 15.2x 15.0x
Base Rate Tracker 2.34
S&P 500 2 18.2x 16.1x 15.8x
2-yr Fixed Rate 1.73
Nasdaq 1.1 22.1x 19.0x 17.8x
3-yr Fixed Rate 1.81
Nikkei 2.1 14.6x 15.1x 19.8x
5-yr Fixed Rate 2.01
MSCI World 2.6 16.6x 14.8x 15.2x
Standard Variable 4.40
MSCI EM 2.8 12.6x 12.0x 12.1x
10-yr Fixed Rate 2.64
* The % 1 week relates to the weekly index closing, rather than our Friday p.m. snapshot values
** LTM = last 12 months’ (trailing) earnings;
***NTM = Next 12 months estimated (forward) earnings
For any questions, as always, please ask!
If anybody wants to be added or removed from the distribution list, please email
enquiries@cambridgeinvestments.co.uk
Please note: Data used within the Personal Finance Compass is sourced from
Bloomberg/FactSet and is only valid for the publication date of this document.
The value of your investments can go down as well as up and you may get back less than
you originally invested.
Lothar Mentel
www.cambridgeinvestments.co.uk | enquiries@cambridgeinvestments.co.uk
Tel : 01223 365 656 | CB1 Business Centre, 20 Station Road, Cambridge, CB1 2JDYou can also read