The Chinese Market Understanding the Indices - Union Securities Switzerland
←
→
Page content transcription
If your browser does not render page correctly, please read the page content below

The Chinese Market Understanding the Indices
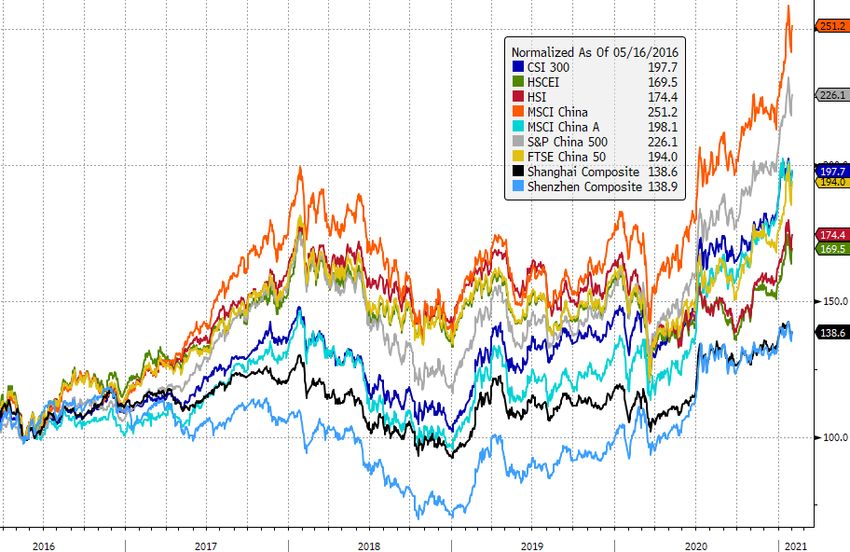
Introduction
Investor often wonder what is the best way to invest in Chinese equities and what is the best index to measure the performance of the their
investment. Chinese companies typically list their shares on one or more exchanges in mainland China, Hong-Kong or in the US as ADRs. For
that reason, the many Chinese equity indices have a very different compositions and performances. In this document, we analyse the
differences between the most used indices.

China’s mainland stock markets had historically been difficult to access for foreign investors amid quota systems and capital controls. Recent
changes of exchange regulations allow international investors to access mainland listed stocks. These regulation changes were critical in
MSCI’s decision to increase the A shares’ proportion in its indices. In 2019 MSCI increased the inclusion ratio of China A shares from 5% to 20%
in the MSCI Emerging Markets Index (no future weight increase is currently planned, as it would require Chinese authorities to address a
number of remaining market accessibility questions).

The development of Chinese equities ETF’s offering, in addition to MSCI’s decision, has permitted investors to invest more easily in China.

Some indices have similar performance patterns due to their main constituents and can be regrouped :

o       MSCI China (HKD) and S&P 500 China (HKD)

o       MSCI China A (USD), CSI 300 (CNY) and FTSE 50 China (HKD)

o       HIS (HKD), HSCEI (HKD)

o       Shanghai Composite (Renminbi) and Shenzhen Composite (Renminbi)

 February 3, 2021                                                                                                                              2
Chinese Main Indices

February 3, 2021       3
Chinese Main Indices
MSCI China Index
o          It covers 85% of the equity universe and across all types of Chinese shares, including foreign listings (e.g. ADRs).

o          It has an exposure to large and mid-cap companies. 20% of the large & mid-cap A Shares are included.

Hong Kong Hang Seng China Enterprises (HSCEI Index)
o          Reflects the performance of the 50 largest Chinese H-shares listed in Hong Kong.

o          It has a 10% cap on each constituent’s weight.

Hong Kong Hang Seng (HSI Index)
o          Reflects the performance of the largest stocks listed in Hong Kong.

o          It is composed of only a few sectors: industry, finance, utilities, and Real Estate.

o          It has a 10% cap on each constituent’s weight.

Hang Seng TECH (the “Hong Kong’s Nasdaq”, HSTECH Index)
o          Reflects the performance of the 30 largest technology companies listed in Hong Kong.

o          Stocks must have high business exposure to technology themes, such as Hardware, Semi-Conductors, e-commerce, FinTech or Software. It has a 8% cap on each
           constituent’s weight.

Shanghai Composite (SHCOMP Index)
o          Reflects the performance of all stocks (A and B shares) listed in Shanghai.

Shenzhen Composite (SZCOMP Index)
o          Reflects the performance of the 500 largest A-shares listed in Shenzhen.

    February 3, 2021                                                                                                                                              4
The Chinese Market
There are different markets where Chinese companies can list their stock.
The Chinese Mainland market
o A-Shares are quoted in Chinese Renminbi and B-Shares are quoted in foreign currencies. Both type of shares are difficult to invest in for foreign investors.
o The 2 principal mainland indices are the Shanghai Composite and the Shenzhen Composite. The Shanghai Composite Index tracks A-Shares and B-Shares listed in
Shanghai. The Shenzhen Composite tracks the 500 largest A-shares listed in Shenzhen.
The Hong-Kong Market
o H-Shares are listed on the Hong-Kong Exchange in HKD and are freely investable for foreign investors.
o The HSCEI index tracks the top 50 H-Shares stocks. Futures on the HSCEI are available and trade in high volumes on the Hong-Kong futures exchanges.
The US Market
o Some Chinese Tech Companies have chosen to be directly listed as ADRs in the US market.
The Hong-Kong Dollar is pegged to the US Dollar. Most companies report in CNY (even if the stocks is traded in HKD or USD). The CNY rate is
floating around a central parity determined by the People’s Banks of China with respect to a basket of world currencies.
February 3, 2021 5Types of Equity Shares
The China mainland equity market is comprised of A, B, H, Red chip and P chip shares.
A shares are incorporated in China and traded in Shanghai and Shenzhen.
o Quoted in local renminbi
o Entail foreign investment restrictions. However, professional foreign investors with a special license are able to invest in these stocks under certain restrictions.
B shares are incorporated in China and traded in Shanghai and Shenzhen.
o Quoted in foreign currencies
o Open to foreign investors
H shares are incorporated in China and traded in Hong Kong and other foreign exchanges.
o Quoted in HKD
o This is the historical preferred market by foreign investors and is relatively liquid.
Red chips are incorporated outside of China and traded in Hong Kong. Usually controlled by the state, a province or municipality.
o Quoted in HKD
o Open to foreign investors
P chips are incorporated outside of China and traded in Hong Kong. Usually non state-owned companies.
o Quoted in HKD
o Open to foreign investors
February 3, 2021 6Sectors weights and P/E ratios
Weights P/E Ratio
MSCI Shanghai Shenzhen MSCI Shanghai Shenzhen
HSCEI HSI HSTECH HSCEI HSI HSTECH
China Composite Composite China Composite Composite
MSCI China, HSCEI, HSI and
Consumer Discretionary 36.0 20.3 16.5 32.3 7.7 11.2 150.0 168.3 134.1 63.6 81.7 82.8
Retailing 25.7 13.5 10.6 31.3 2.1 0.7 30.8 47.2 41.6 47.1 29.8 25.1 HSTECH are tilted toward
Automobiles 5.2 2.4 1.6 3.5 3.1 44.1 24.1 24.1 17.0 20.9
Apparel 2.0 3.5 2.4 0.4 1.8 6.3 32.2 34.1 34.1 16.5 21.7 20.0 Retailing (Alibaba, JD.com) and in
Consumer Services 3.2 0.9 1.9 0.6 0.3 1.1 42.9 62.9 34.4 13.2 16.7
Communication Services 20.7 15.8 13.1 13.2 1.4 2.9 54.1 43.1 43.2 32.2 36.6 52.7 Medias (Tencent, Baidu).
Media & Entertainment 20.5 11.0 10.3 13.2 1.0 2.9 33.8 35.0 35.8 32.2 18.3 22.7
Telecommunication 0.2 4.8 2.8 0.3 0.1 20.3 8.1 7.4 18.3 30.0 HSCEI and HSI have a bigger
Financials 12.9 31.4 41.9 1.8 26.0 5.5 25.1 14.5 68.1 91.8 24.5 37.4
Banks 9.0 21.1 25.8 0.1 20.8 5.4 8.2 5.3 27.0 30.3 8.4 18.7
weight on financials (large banks
Insurance 4.0 10.4 16.1 1.7 5.2 0.1 8.7 9.3 14.2 61.5 7.7
& insurers).
Information Technology 6.0 7.9 5.0 45.1 10.0 20.1 191.9 116.5 33.0 210.3 123.6 110.1
Hardware & Equipment 3.8 6.4 5.0 24.0 3.6 13.7 24.9 34.5 33.0 23.8 20.2 27.5
Shanghai and Shenzhen
Software & Services 1.4 11.3 2.3 3.7 125.8 130.4 52.1 36.0
Semiconductors 0.8 1.5 9.8 4.1 2.8 41.2 82.0 56.1 51.3 46.6 Composites are tilted toward
Health Care 6.9 4.3 4.7 7.7 7.0 13.4 120.1 438.4 56.2 413.0 76.7 74.4
Health Care Equipment 1.6 1.4 7.7 1.3 5.3 40.6 411.7 413.0 29.7 35.0 smaller companies, exporters and
Pharma & Biotech 5.2 2.8 4.7 5.7 8.1 79.5 26.7 56.2 47.0 39.4
domestic stocks, in Industrials,
Industrials 4.3 1.4 3.8 15.2 17.9 44.9 4.8 35.8 43.3 78.2
Consumer Staples 4.2 5.0 2.3 12.7 12.6 69.3 41.5 30.2 108.4 73.1
Staples and Materials.
Materials 2.1 0.8 9.7 11.9 10.8 6.2 15.6 20.2
Real Estate 3.5 6.2 7.1 2.6 2.5 5.2 5.0 8.1 5.4 5.4
Utilities 1.8 3.2 3.1 3.1 1.2 10.6 14.9 17.2 11.8 8.7
Energy 1.6 3.7 2.5 4.6 0.7 8.2 8.8 8.8 9.3 13.0
February 3, 2021 7Financial Ratios
Chinese indexes have quite wide different financial metrics.
The HSTECH index has higher price-related ratios (P/E, P/B,.), but smaller dividend yield.
HSCEI, HSCI and HSTECH indexes are concentrated in a few companies. Shanghai and Shenzhen indexes are much more diversified.
Shanghai and Shenzhen indexes have more indebted components with a much smaller market cap.
MSCI Shanghai Shenzhen
HSCEI HSI HSTECH
China Composite Composite
Dividend Yield 1.5 3.0 2.8 0.5 2.9 1.2
P/E 17.6 10.7 13.3 42.0 11.8 23.2
P/B 2.3 1.2 1.3 5.1 1.2 3.5
P/S 1.9 1.4 1.9 2.1 0.9 2.2
EV/EBITDA 15.5 12.5 13.2 25.4 16.9 23.7
Debt/Assets 21.3 16.2 14.9 12.8 23.8 30.9
Market Cap Median $Bn 10.4 42.4 32.6 13.3 1.0 0.7
Number of constituents 592 51 52 31 1542 2396
February 3, 2021 8MSCI China Index – Top 20 holdings
Name Sector P/E Weight
Tencent Communication Services 43.5 15.1
Alibaba Consumer Discretionary 23.9 14.5
Meituan Consumer Discretionary 208.2 5.2
JD.com Consumer Discretionary 47.9 2.4
Nio Consumer Discretionary 0.0 2.4
China Construction Bank Financials 5.4 2.2
The MSCI China Index is concentrated on
Ping An Insurance Financials 11.9 2.2
Baidu Communication Services 25.9 2.0 Tencent and Alibaba (30%). Main sectors are
Pinduoduo Consumer Discretionary 0.0 1.9 Financials, Communication and Discretionary :
Xiaomi Information Technology 39.0 1.6
Netease Communication Services 36.1 1.4
Top 10 represents 49.7%
Wuxi Biologics Health Care 273.1 1.4 Top 20 represents 59.8%
Industrial & Commercial Bank of China Financials 5.2 2.0
Tal Education Consumer Discretionary 118.8 0.9
Bank of China Financials 4.2 0.8
New Oriental Consumer Discretionary 44.1 0.8
Geely Automobiles Consumer Discretionary 40.1 0.7
Kweichow Moutai Consumer Staples 52.0 0.7
Yum China Consumer Discretionary 29.8 0.7
BYD Co Consumer Discretionary 409.5 0.6
February 3, 2021 9HSCEI Index – Top 20 holdings
Name Sector P/E Weight
Tencent Communication Services 43.5 11.1
China Construction Bank Financials 5.4 8.3
Ping An Insurance Financials 11.9 7.3
Meituan Consumer Discretionary 208.2 5.4
Industrial & Commercial Bank of China Financials 5.2 4.7
Alibaba Consumer Discretionary 24.3 4.5
Xiaomi Information Technology 39.0 4.4 The HSCEI Index is concentrated on a few
China Mobile Communication Services 7.6 3.6
names, mainly in the Financials,
China Merchants Bank Financials 12.7 2.9
Bank of China Financials 4.2 2.7
Communication and Discretionary sectors:
Geely Automobiles Consumer Discretionary 40.1 2.5 Top 10 represents 55%
JD Health Consumer Discretionary 570.7 2.3
Top 20 represents 74%
Sunny Optical Tech Information Technology 43.9 2.0
Anta Sports Products Consumer Discretionary 45.7 1.8
CNOOC Ltd Energy 7.1 1.7
Shenzhou International Consumer Discretionary 35.7 1.7
China Mengniu Dairy Consumer Staples 34.2 1.6
Semiconductor manufacturing Information Technology 104.6 1.6
China Life Insurance Financials 7.9 1.6
JD.com Consumer Discretionary 51.2 1.5
February 3, 2021 10HSI Index – Top 20 holdings
Name Sector P/E Weight
Tencent Communication Services 43.5 11.1
AIA Group Financials 23.2 9.9
HSBC Financials 12.6 7.4
Meituan Consumer Discretionary 208.2 6.3
Hong Kong Exchanges Financials 50.7 5.6
China Construction Bank Financials 5.4 5.6
Ping An Insurance Financials 11.9 5.0
The HSI Index is concentrated on a few
Alibaba Consumer Discretionary 24.3 4.5 names, mainly in the Financials and
Xiaomi Information Technology 39.0 3.4 Discretionary sectors:
Industrial & Commercial Bank of China Financials 5.2 3.2
Wuxi Biologics Health Care 273.1 3.1 Top 10 represents 62.1%
China Mobile Communication Services 7.6 2.5 Top 20 represents 79%
Bank of China Financials 4.2 1.8
Geely Automobiles Consumer Discretionary 40.1 1.7
Techtronic Industries Industrials 39.4 1.6
Sunny Optical Tech Information Technology 43.9 1.3
CK Hutchison Industrials 6.1 1.3
Anta Sports Products Consumer Discretionary 45.7 1.2
CLP Holdings Utilities 16.0 1.2
Link Reit Real Estate 0.0 1.2
February 3, 2021 11HSTECH Index – Top 20 holdings
Name Sector P/E Weight
Meituan Consumer Discretionary 208.2 8.8
Sunny Optical Tech Information Technology 43.9 8.4
Tencent Communication Services 43.5 7.8
JD Health Consumer Discretionary 570.7 7.8
Alibaba Consumer Discretionary 24.3 7.5
Xiaomi Information Technology 39.0 6.6
Semiconductor manufacturing Information Technology 104.6 6.4
JD.com Consumer Discretionary 51.2 6.1 HSTECH index has few components and is
Alibaba Health Health Care 685.2 6.1
concentrated in the Tech and Discretionary sectors:
Kingdee International Information Technology 2397.8 4.1
Lenovo Information Technology 18.2 3.6 Top 10 represents 69.4%
Kingsoft Information Technology 46.1 3.0 Top 20 represents 92.8%
Netease Communication Services 0.0 3.0
BYD Electronic Information Technology 31.3 2.4
Weimob Information Technology 148.2 2.4
ASM Pacific Technology Information Technology 31.1 2.1
Ming Yuan Cloud Information Technology 249.4 1.9
AAC Technologies Information Technology 20.4 1.8
Zhongan Online Insurance Financials 101.0 1.7
Ping Healthcare Health Care 0.0 1.6
February 3, 2021 12Shanghai & Shenzhen Indexes – Top 10 holdings
Shanghai Composite
Name Sector P/E Weight
Kweichow Moutai Consumer Staples 52.0 6.2
ICBC Financials 6.2 3.1
China Merchants Bank Financials 8.1 2.4
Agricultural Bank of China Financials 5.7 2.3
Ping Insurance Financials 12.3 2.1
China Life Insurance Financials 20.3 1.8
Foshan Haitian Flavouring Consumer Staples 92.4 1.5
Petrochina Energy 14.3 1.5
Bank of China Financials 5.9 1.5 Shanghai and Shenzhen indexes are well diversified in
China Tourism Duty Free Consumer Discretionary 55.0 1.4 terms of components and sectors:
Shanghai’s Top 10 represents 23.7%
Shenghen Composite
Name Sector P/E Weight Shenzhen’s Top 10 represents 18.3%
Wuliangye Yibin Consumer Staples 52.1 3.4
Contemporary Amperex TechIndustrials 115.8 2.6
Yihai Kerry Arawana Consumer Staples 127.3 2.1
Midea Consumer Discretionary 24.6 2.0
Hangzhou Hikvision Digital Information Technology 40.9 1.7
Shenzhen Mindray Bio-Medical
Health Care 78.6 1.6
BYD Co Consumer Discretionary 231.6 1.3
SF Holding Industrials 63.8 1.3
Ping An Bank Financials 14.0 1.2
Luxshare Precision Industry Information Technology 39.2 1.1
February 3, 2021 13Chinese Equities ETFs
Here is a selection of the main ETFs (approved for distribution in Switzerland).
Fund Assets
Name Ticker Index Currency TER
(M USD)
iShares MSCI China A UCITS ETF CNYA LN MSCI China A USD 0.40% 2,208
Xtrackers Harvest CSI300 UCITS ASHR LN CSI 300 USD 0.65% 773
iShares China Large Cap UCITS IDFX LN FTSE China 50 USD 0.74% 693
iShares MSCI China UCITS ETF ICHD NA MSCI China USD 0.40% 315
Xtrackers FTSE China 50 UCITS XX2D LN FTSE China 50 USD 0.60% 139
Amundi Msci China UCITS ETF CC1U LN MSCI China USD 0.55% 82
February 3, 2021 14Contacts
CONTACT US
Union Securities Switzerland S.A.
Address
11 Cours de Rive
1204 Geneva, Switzerland
Let’s Talk
research@unionsecurities.ch
Want to know more about us ?
www.unionsecurities.ch
Union Securities Switzerland SA is a FINMA-registered Securities Dealer.
February 3, 2021Disclaimer
Investment research – Risk information: USS researches are prepared and published by Union Securities Switzerland SA (regulated by FINMA in Switzerland) “USS”.
The investment views have been prepared in accordance with legal requirements designed to promote the independence of investment research.
This material is for your information only and is not intended as an offer, or a solicitation of an offer, to buy or sell any investment or other specific product. Certain services and products are
subject to legal restrictions and cannot be offered worldwide on an unrestricted basis and/or may not be eligible for sale to all investors. All information and opinions expressed in this material
were obtained from sources believed to be reliable and in good faith, but no representation or warranty, express or implied, is made as to its accuracy or completeness (other than disclosures
relating to USS). All information and opinions as well as any forecasts, estimates and prices indicated are current as of the date of this report, and are subject to change without notice. The
market prices provided in performance charts and tables are closing prices on the respective principal stock exchange. The analysis contained herein is based on numerous assumptions. Different
assumptions could result in materially different results. Opinions expressed herein may differ or be contrary to those expressed by other business areas or divisions of USS as a result of using
different assumptions and/or criteria.
In no circumstances may this document or any of the information (including any forecast, value, index or other calculated amount ("Values")) be used for any of the following purposes (i)
valuation or accounting purposes; (ii) to determine the amounts due or payable, the price or the value of any financial instrument or financial contract; or (iii) to measure the performance of any
financial instrument including, without limitation, for the purpose of tracking the return or performance of any Value or of defining the asset allocation of portfolio or of computing performance
fees. By receiving this document and the information you will be deemed to represent and warrant to USS that you will not use this document or otherwise rely on any of the Information for any
of the above purposes or otherwise rely upon this document or any of the information.
Opinions expressed herein may differ or be contrary to those expressed by other business areas or divisions of USS, as a result of using different assumptions and/or criteria. USS and any of its
directors or employees may be entitled at any time to hold long or short positions in investment instruments referred to herein, carry out transactions involving relevant investment instruments
in the capacity of principal or agent, or provide any other services or have officers, who serve as directors, either to/for the issuer, the investment instrument itself or to/for any company
commercially or financially affiliated to such issuers. At any time, investment decisions (including whether to buy, sell or hold securities) made by USS and its employees may differ from or be
contrary to the opinions expressed in USS research publications. Some investments may not be readily realizable since the market in the securities is illiquid and therefore valuing the investment
and identifying the risk to which you are exposed may be difficult to quantify. USS relies on information barriers to control the flow of information contained in one or more areas within USS, into
other areas, units, divisions or affiliates of USS. Futures and Options trading is not suitable for every investor as there is a substantial risk of loss, and losses in excess of an initial investment may
occur. Past performance of an investment is no guarantee for its future performance. Additional information will be made available upon request. Some investments may be subject to sudden
and large falls in value and on realization you may receive back less than you invested or may be required to pay more. Changes in foreign exchange rates may have an adverse effect on the price,
value or income of an investment. The analyst(s) responsible for the preparation of this report may interact with trading desk personnel, sales personnel and other constituencies for the purpose
of gathering, synthesizing and interpreting market information. Tax treatment depends on the individual circumstances and may be subject to change in the future. USS does not provide legal or
tax advice and makes no representations as to the tax treatment of assets or the investment returns thereon both in general or with reference to specific client's circumstances and needs. We are
of necessity unable to take into account the particular investment objectives, financial situation and needs of our individual clients and we would recommend that you take financial and/or tax
advice as to the implications (including tax) of investing in any of the products mentioned herein. This material may not be reproduced or copies circulated without prior authority of USS. Unless
otherwise agreed in writing USS expressly prohibits the distribution and transfer of this material to third parties for any reason. USS accepts no liability whatsoever for any claims or lawsuits from
any third parties arising from the use or distribution of this material. This report is for distribution only under such circumstances as may be permitted by applicable law. Forecasts and estimates
are current only as of the date of this publication and may change without notice. USS manages conflicts and maintains independence of its investment views and publication offering, and
research and rating methodologies. Additional information on the relevant authors of this publication and other USS publication(s) referenced in this report; and copies of any past reports on this
topic; are available upon request from your sales representative.
External Asset Managers / External Financial Consultants: In case this research or publication is provided to an External Asset Manager or an External Financial Consultant, USS expressly
prohibits that it is redistributed by the External Asset Manager or the External Financial Consultant and is made available to their clients and/or third parties.
Important notice USA: This document is not intended for distribution into the US, and/or to US persons, by USS personnel.
February 3, 2021You can also read