The contribution of PCR testing to influenza and pertussis notifications in Australia
←
→
Page content transcription
If your browser does not render page correctly, please read the page content below
Epidemiol. Infect. (2016), 144, 306–314. © Cambridge University Press 2015
                      doi:10.1017/S0950268815001004

                      The contribution of PCR testing to influenza and pertussis
                      notifications in Australia

                      M. C. KACZMAREK 1 , 2 *, R. S. WARE 2 , 3                               AND     S. B. LAMBERT 1 , 3 , 4
                      1
                        Queensland Children’s Medical Research Institute, Brisbane, QLD, Australia
                      2
                        School of Public Health, The University of Queensland, Herston, QLD, Australia
                      3
                        Child Health Research Centre, The University of Queensland, Herston, QLD, Australia
                      4
                        Communicable Diseases Unit, Queensland Health, Brisbane, QLD, Australia

                      Received 26 January 2015; Final revision 12 April 2015; Accepted 21 April 2015;
                      first published online 26 June 2015

                      SUMMARY
                      Influenza and pertussis are the two most common vaccine-preventable infections notified in
                      Australia. We assessed the role of polymerase chain reaction (PCR) diagnosis in influenza and
                      pertussis cases notified to the Australian National Notifiable Diseases Surveillance System
                      (NNDSS). There were a total of 2 10 786 notified influenza cases (2001–2013) and 2 55 866
                      notified pertussis cases (1991–2013). After 1 January 2007, the majority of influenza and pertussis
                      notifications were PCR-based (80·5% and 59·6%, respectively). Before 31 December 2006,
                      PCR-based notifications were limited (29·1% and 11·7%, respectively). By 2013, PCR-based
                      notifications had largely replaced all other diagnostic methods, with the exception of serology-
                      based notifications in pertussis cases in adults aged 525 years.

                      Key words: influenza, PCR, pertussis, serology.

                      I N T RO D U C T I O N                                                               polymerase chain reaction (PCR), culture, antigen de-
                      Influenza and pertussis are the two most common                                       tection, and serology [4, 5].
                      vaccine-preventable infections notified in Australia                                     Compared to culture and serology, PCR testing is
                                                                                                           more sensitive and has a faster turn-around time for
                      [1]. The clinical illness for both influenza and pertussis
                      infections range from mild to severe, and asymptom-                                  results [6]. In Australia, the availability of PCR for
                      atic cases can occur across all age groups, and may                                  diagnosis of influenza and pertussis has increased
                                                                                                           over the last decade. Public funding for laboratories
                      not be uncommon [2, 3].
                         Both influenza and pertussis are nationally notifi-                                 to test specimens using PCR commenced under the
                      able in Australia according to State and Territory le-                               Australian Government-funded Medicare Benefits
                      gislation. For notification, cases must meet the case                                 Schedule in 2005 [7]. Additionally, public funding
                      definitions which require laboratory evidence of infec-                               was provided for laboratories to purchase equipment,
                      tion, with acceptable testing methods including                                      primarily for PCR, during the 2009 H1N1 influenza
                                                                                                           pandemic [8].
                                                                                                              Since 2007, increased influenza and pertussis inci-
                      * Author for correspondence: Ms. M. C. Kaczmarek, Queensland                         dence has been associated with a pertussis epidemic
                      Children’s Medical Research Institute, Level 4, Foundation                           (2009–2012) caused in part by waning immunity,
                      Building, Royal Children’s Hospital, Herston Road, Herston,
                      QLD 4029, Australia.
                                                                                                           and an influenza pandemic (2009) caused by the cir-
                      (Email: m.kaczmarek@uq.edu.au)                                                       culation of a novel virus strain [1, 9]. The role of

Downloaded from https://www.cambridge.org/core. IP address: 46.4.80.155, on 29 Jan 2022 at 00:31:39, subject to the Cambridge Core terms of use, available at https://www.cambridge.org/core/terms.
https://doi.org/10.1017/S0950268815001004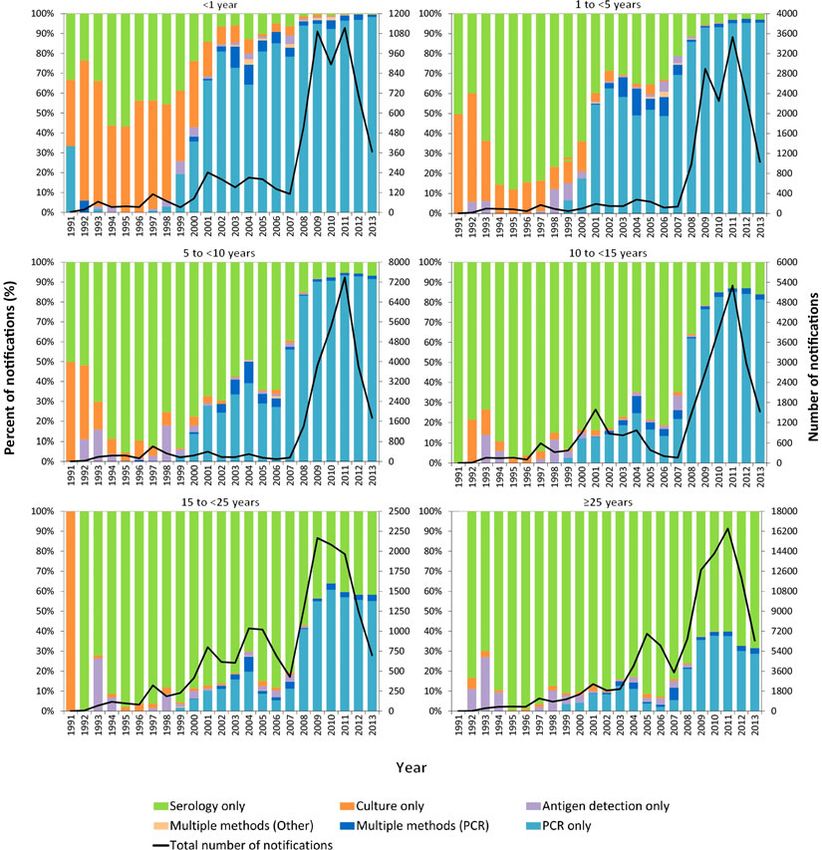
PCR diagnosis of influenza and pertussis                           307

             improved availability of PCR testing has been                                           Line listed data were provided for each notification,
             hypothesized to have led to improved case ascertain-                                 rather than each individual case, as cases could be
             ment and improved detection of disease activity                                      notified in duplicate following different diagnostic
             [1, 10].                                                                             tests. Duplicate notifications, where a case was diag-
                With this study, we describe patterns of notified                                  nosed using more than one diagnostic method and
             pertussis and influenza cases in Australia, and explore                               therefore notified more than once, were combined
             the role of newer laboratory diagnostic methods in                                   into a single record. Notifications with laboratory test-
             any changes.                                                                         ing methods of histopathology, microscopy, ‘other’ or
                                                                                                  ‘unknown’ were excluded, as the former two no longer
                                                                                                  meet the case definition and it is uncertain whether the
             METHODS                                                                              latter two meet the case definition. During analysis,
             All available pertussis and influenza notifications were                               data were aggregated by diagnostic method, year
             obtained from the National Notifiable Diseases                                        and age groups (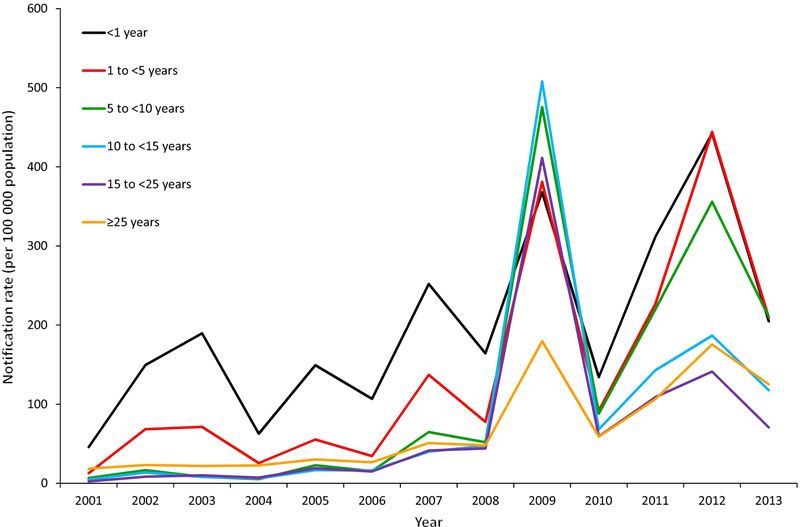
308        M. C. Kaczmarek and others

                      Table 1. Influenza and pertussis notifications, by diagnostic method and time period, to 31 December 2013, Australia

                                                   Influenza (from 1 January 2001), n (%)                               Pertussis (from 1 January 1991), n (%)

                                                   431 December           51 January                                   431 December 51 January
                                                   2006                   2007                   Total                 2006         2007                              Total

                      Total single                 13 219 (88·5)          1 70 589 (93·1)        1 83 808 (92·8)       49 175 (98·3)           1 38 515 (98·0)        1 87 690 (98·0)
                       diagnostic method
                       used
                      PCR only                     3442 (23·0)            1 35 620 (74·0)        1 39 062 (70·2)       5052 (10·1)             81 404 (57·6)          86 456 (45·2)
                      Culture only                 2061 (13·8)            5527 (3·0)             7588 (3·8)            1309 (2·6)              283 (0·2)              1592 (0·8)
                      Serology only                5395 (36·1)            22 495 (12·3)          27 890 (14·1)         41 537 (83·0)           56 466 (39·9)          98 003 (51·2)
                      Antigen detection            2321 (15·5)            6947 (3·8)             9268 (4·7)            1277 (2·6)              362 (0·3)              1639 (0·9)
                       only
                      Total multiple               1715 (11·5)            12 597 (6·9)           14 312 (7·2)          841 (1·7)               2897 (2·0)             3738 (2·0)
                       diagnostic
                       methods used
                      Multiple methods:            907 (6·1)              11 897 (6·5)           12 804 (6·5)          787 (1·6)               2818 (2·0)             3605 (1·9)
                       PCR*
                      Multiple methods:            808 (5·4)              700 (0·4)              1508 (0·8)            54 (0·1)                79 (0·1)               133 (0·1)
                       Other†
                      Total included               14 934 (100·0)         1 83 186 (100·0) 1 98 120 (100)              50 016 (100·0)          1 41 412 (100·0) 1 91 428 (100)
                       notifications
                      Total PCR-based              4349 (29·1)            1 47 517 (80·5)        1 51 866 (76·7)       5839 (11·7)             84 222 (59·6)          90 061 (47·0)
                       notifications‡
                      Excluded§                    3462                   9204                   12 666                46 564                  17 874                 64 438

                      * Includes all notifications where polymerase chain reaction (PCR) was used in combination with culture, serology and/or
                      antigen detection.
                      † Includes any combination of culture, serology and/or antigen detection-based notifications, without PCR testing.
                      ‡ Includes all ‘PCR only’ and ‘Multiple methods: PCR’ notifications.
                      § Excluded notifications include those with a laboratory method of histopathology, microscopy, ‘other’ or ‘unknown’.

                      respectively). The majority of influenza and pertussis                                the proportion of pertussis PCR-based notifications
                      cases were notified following a single diagnostic test                                (Table 3). The proportion of all non-PCR-based
                      (92·8% and 98·0%, respectively). From 2007 (the ‘PCR                                 notifications decreased 0·4-fold for influenza notifica-
                      era’), the majority of influenza and pertussis notifica-                               tions and 0·5-fold for pertussis notifications. The high-
                      tions were PCR-based (80·5% and 59·6%, respectively),                                est increases in the proportion of PCR-based
                      with serology largely responsible for the remainder of                               notifications were in children aged 1 to
PCR diagnosis of influenza and pertussis                           309

             Table 2. Median and mean age of influenza and pertussis notifications, by diagnostic method and time period, to 31
             December 2013*, Australia

                                                     431 December 2006                          51 January 2007                             Total

                                                                       All non-PCR                                 All non-PCR                                 All non-PCR
             Age, years                              PCR†              methods‡                 PCR†               methods‡                 PCR†               methods‡

             Influenza median (mean)                  18 (25·4)         19 (27·6)                25 (28·8)          34 (35·7)                24 (27·8)          31 (33·8)
             Pertussis median (mean)                 13 (19·9)         28 (30·5)                10 (19·1)          46 (44·7)                10 (19·1)          38 (36·9)

             PCR, Polymerase chain reaction.
             * Influenza reporting period: 1 January 2001 to 31 December 2013; pertussis reporting period: 1 January 1991 to 31 December
             2013.
             † ‘PCR’ includes all notifications where PCR was used as diagnostic method (irrespective of whether the sole method or in
             combination with other methods).
             ‡ ‘All non-PCR methods’ includes all culture, serology and/or antigen detection-based notifications, including any combin-
             ation of these diagnostic methods, without PCR testing.

             Fig. 1. Annual influenza notification rate per 1 00 000 age-specific population, 1 January 2001 to 31 December 2013,
             Australia.

             D I SC US S IO N                                                                     replaced all other diagnostic methods, other than in
             PCR-based influenza and pertussis notifications have                                   pertussis cases aged 525 years, which remain pre-
             increased substantially in Australia over the study per-                             dominantly serology-based (68·5% in 2013).
             iod. In the PCR era (52007), the proportion of notifi-                                  PCR has provided an opportunity to increase test-
             cations that were PCR-based for influenza and                                         ing due to its advantages over previously available
             pertussis was 3·1- and 8·7-fold higher, respectively,                                diagnostic methods. In Australia in the pre-PCR era,
             compared to the pre-PCR era. The largest increase                                    culture, antigen detection, and serology were the pri-
             in the proportion of PCR-based notifications was in                                   mary methods for diagnosing influenza and pertussis.
             children aged 5 to
310 M. C. Kaczmarek and others
Fig. 2. Annual pertussis notification rate per 1 00 000 age-specific population, 1 January 2001 to 31 December 2013,
Australia.
and has primarily been (and continues to be) used in test and notify cases in age groups (particularly 5 to
older age groups for retrospective diagnosis, especiallyhttps://doi.org/10.1017/S0950268815001004
Downloaded from https://www.cambridge.org/core. IP address: 46.4.80.155, on 29 Jan 2022 at 00:31:39, subject to the Cambridge Core terms of use, available at https://www.cambridge.org/core/terms.
Table 3. Influenza and pertussis notifications, by age group, diagnostic method and time period, to 31 December 2013, Australia
431 December 2006 51 January 2007
Age Fold difference in Relative difference Relative difference Absolute difference
group, All non-PCR All non-PCR number of PCR in % PCR*† in % all non-PCR in % PCR*‡
years PCR† methods‡ PCR† methods‡ Total tests*† (95% CI) methods*‡ (95% CI) (95% CI)
Influenza (from 1 January 2001)312 M. C. Kaczmarek and others
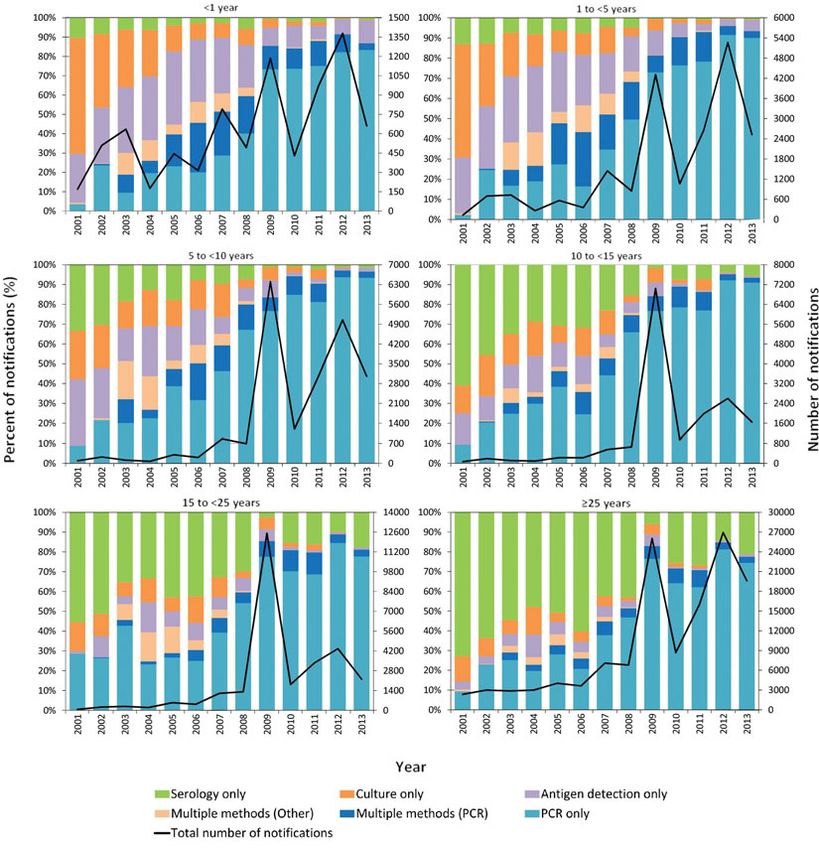
Fig. 3. Notifications of influenza by diagnostic method and year, 1 January 2001 to 31 December 2013, Australia, with
percent of notifications on the left axis and total number of notifications on the right axis.
attention about pertussis and influenza during peak health responses. While at a national level the
periods of activity and following deaths in young NNDSS functions very well to achieve these goals,
infants. Improved awareness, whether following as a passive surveillance system it is prone to case
media attention or training, has been found to in- under-ascertainment and has lower sensitivity than
crease diagnostic testing, through changed patient an active surveillance system. Over our study period,
and clinician behaviour [17–20]. Moreover, the com- the changes in the use of PCR, along with increased
bination of improved PCR availability, better aware- awareness of the illnesses, would have improved
ness and increased circulation of pathogens is likely NNDSS case ascertainment, sensitivity, and re-
to have created a positive feedback loop, ultimately presentativeness. There would also have been a
leading to more testing over time. reduction in ascertainment bias, as PCR allows
Overall, increasing PCR use has probably more widespread testing (and therefore notification)
improved case detection for notifiable infections of cases across the population. Although it is un-
such as influenza and pertussis. The purpose of likely that PCR use will decline in the near future,
infectious disease surveillance is to monitor trends, we hypothesize that the increase in testing will even-
detect outbreaks, and both guide and evaluate public tually plateau and set a new higher background
Downloaded from https://www.cambridge.org/core. IP address: 46.4.80.155, on 29 Jan 2022 at 00:31:39, subject to the Cambridge Core terms of use, available at https://www.cambridge.org/core/terms.
https://doi.org/10.1017/S0950268815001004PCR diagnosis of influenza and pertussis 313
Fig. 4. Notifications of pertussis by diagnostic method and year, 1 January 2001 to 31 December 2013, Australia, with
percent of notifications on the left axis and total number of notifications on the right axis.
incidence for pertussis and influenza. At this time it need to be interpreted in conjunction with knowledge
will be easier to identify true increases in incidence of underlying testing patterns.
without the influence of changes in testing and
awareness.
We have demonstrated the role that increased PCR CO N CLU S IO N
use has had on observed pertussis and influenza epi- In Australia, PCR-based influenza and pertussis notifi-
demiology; however, this phenomenon is not limited cations have been increasing since 2001 across all age
to Australia. Globally, other countries with increasing groups. By 2013, PCR-based notifications had largely
PCR use have reported similar changes to observed replaced all other diagnostic methods, with the exception
pertussis incidence and demographics [21, 22]. As of serology-based notifications in older pertussis cases.
PCR testing is expanded to other pathogens, such as
those that cause gastrointestinal infections [23, 24],
changes to the infection epidemiology are likely to AC KN OWL ED GE MEN T S
be observed. When relying on a laboratory-based sur- We thank the Australian Commonwealth Government
veillance system, any changes in disease epidemiology Department of Health for provision of NNDSS data
Downloaded from https://www.cambridge.org/core. IP address: 46.4.80.155, on 29 Jan 2022 at 00:31:39, subject to the Cambridge Core terms of use, available at https://www.cambridge.org/core/terms.
https://doi.org/10.1017/S0950268815001004314 M. C. Kaczmarek and others
used in this study. This research received no specific 9. Sheridan SL, et al. Waning vaccine immunity in teen-
grant from any funding agency in the public, commer- agers primed with whole cell and acellular pertussis vac-
cine: recent epidemiology. Expert Review of Vaccines
cial or not-for-profit sectors.
2014; 13: 1081–1106.
Ms. Kaczmarek is the recipient of a Sidney Myer 10. Kaczmarek MC, et al. Sevenfold rise in likelihood of
Health Scholarship and receives student support pertussis test requests in a stable set of Australian gen-
from the Queensland Children’s Medical Research eral practice encounters, 2000–2011. Medical Journal
Institute and The University of Queensland School of Australia 2013; 198: 624–628.
of Public Health. Associate Professor Lambert is sup- 11. Australian Bureau of Statistics. 3101·0 – Australian
demographic statistics. December 2013 (http://www.abs.
ported by an Early Career Fellowship from the
gov.au/AUSSTATS/abs@.nsf/DetailsPage/3101.0Dec%
Australian Government National Health and 202013?OpenDocument). Accessed July 2014.
Medical Research Council and a people support 12. Sintchenko V. The re-emergence of pertussis: implica-
grant from the Queensland Children’s Hospital tions for diagnosis and surveillance. New South Wales
Foundation. Public Health Bulletin 2008; 19: 143–145.
13. Harper SA, et al. Seasonal influenza in adults and chil-
dren – diagnosis, treatment, chemoprophylaxis, and in-
stitutional outbreak management: clinical practice
D E C L A R ATI O N O F I N T E R E S T guidelines of the Infectious Diseases Society of America.
None. Clinical Infectious Diseases 2009; 48: 1003–1032.
14. Dwyer DE, et al. Laboratory diagnosis of human sea-
sonal and pandemic influenza virus infection. Medical
Journal of Australia 2006; 185 (10 Suppl.): S48–53.
R E F E RE NC E S 15. Begg K, et al. Australia’s notifiable diseases status, 2006:
1. NNDSS Annual Report Writing Group. Australia’s Annual Report of the National Notifiable Diseases
notifiable disease status, 2011: Annual report of the Na- Surveillance System. Communicable Diseases Intelligence
tional Notifiable Diseases Surveillance System. Commu- 2008; 32: 139–207.
nicable Diseases Intelligence 2013; 37: E313–E393. 16. Lambert SB, et al. Influenza surveillance in Australia:
2. Fraaij PL, Heikkinen T. Seasonal influenza: the burden we need to do more than count. Medical Journal of
of disease in children. Vaccine 2011; 29: 7524–7528. Australia 2010; 193: 43–45.
3. Ward JI, et al. Bordetella pertussis infections in vacci- 17. Kenyon C, et al. Assessing the impact of a pertussis ac-
nated and unvaccinated adolescents and adults, as tive surveillance program on provider testing behavior,
assessed in a national prospective randomized Minnesota 2005–2009. American Journal of Public
Acellular Pertussis Vaccine Trial (APERT). Clinical Health 2014; 104: e34–39.
Infectious Diseases 2006; 43: 151–157. 18. Sharma V, et al. Influence of the news media on diag-
4. Australian Government Department of Health. Australian nostic testing in the emergency department. Archives
national notifiable diseases case definitions: pertussis of Pediatrics & Adolescent Medicine 2003; 157: 257–260.
case definition, 2004. (http://www.health.gov.au/inter- 19. Grilli R, et al. Mass media interventions: effects on
net/main/publishing.nsf/Content/cda-surveil-nndss-case- health services utilisation. Cochrane Database of
defs-cd_pertus.htm). Accessed August 2014. Systematic Reviews 2002. Issue 1. Art no. CD000389.
5. Australian Government Department of Health. Australian 20. Zhang Y, et al. Characterizing Influenza surveillance
national notifiable diseases case definitions: influenza case systems performance: application of a Bayesian hier-
definition, 2008. (http://www.health.gov.au/internet/ archical statistical model to Hong Kong surveillance
main/publishing.nsf/Content/cda-surveil-nndss-casedefs- data. BMC Public Health 2014; 14: 850.
cd_flu.htm). Accessed September 2014. 21. Cherry JD. Epidemic pertussis in 2012 – the resurgence
6. Fry NK, et al. Role of PCR in the diagnosis of pertussis of a vaccine-preventable disease. New England Journal
infection in infants: 5 years’ experience of provision of a of Medicine 2012; 367: 785–787.
same-day real-time PCR service in England and Wales 22. Fisman DN, et al. Pertussis resurgence in Toronto,
from 2002 to 2007. Journal of Medical Microbiology Canada: a population-based study including test-incidence
2009; 58: 1023–1029. feedback modeling. BMC Public Health 2011; 11: 694.
7. Australian Government Department of Health and 23. de Boer RF, et al. Detection of Campylobacter species
Ageing. Medicare Benefits Schedule Book: Operating and Arcobacter butzleri in stool samples by use of real-
from 1 November 2005. Canberra: Commonwealth of time multiplex PCR. Journal of Clinical Microbiology
Australia, 2005. 2013; 51: 253–259.
8. Australian Government Department of Health and 24. Liu J, et al. Simultaneous detection of six diarrhea-
Ageing. Review of Australia’s Health Sector Response causing bacterial pathogens with an in-house
to Pandemic (H1N1) 2009: lessons identified. pcr-luminex assay. Journal of Clinical Microbiology
Canberra: Commonwealth of Australia, 2011. 2012; 50: 98–103.
Downloaded from https://www.cambridge.org/core. IP address: 46.4.80.155, on 29 Jan 2022 at 00:31:39, subject to the Cambridge Core terms of use, available at https://www.cambridge.org/core/terms.
https://doi.org/10.1017/S0950268815001004You can also read


