The Cost of Poor Software Quality in the US: A 2020 Report - HERB KRASNER MEMBER, ADVISORY BOARD CONSORTIUM FOR INFORMATION & SOFTWARE QUALITYTM ...
←
→
Page content transcription
If your browser does not render page correctly, please read the page content below
The Cost of Poor
Software Quality in
the US: A 2020
Report

        HERB KRASNER
        MEMBER, ADVISORY BOARD
        CONSORTIUM FOR INFORMATION & SOFTWARE QUALITYTM (CISQTM)
        WWW.IT-CISQ.ORG
        HKRASNER@UTEXAS.EDU
        DATE: JANUARY 1, 2021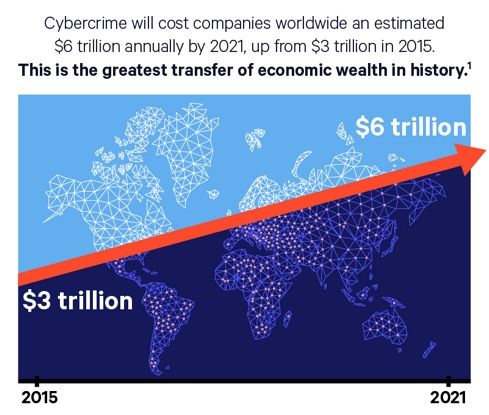
CISQ Consortium for Information & Software Quality I The Cost of Poor Software Quality in the US: A 2020 Report

     Contents

     1.      EXECUTIVE SUMMARY .................................................................................................................................4
     2.      THE ENVIRONMENT AFFECTING SOFTWARE AND ITS COSTS ...........................................................7
          2.1.    THE COST OF COVID-19 IN THE US ...................................................................................................................................... 7
          2.2.    COMPUTING TECHNOLOGY CONTINUES TO MOVE FORWARD ..................................................................................................... 7
          2.3.    SERVICES ARE NOW TRYING TO EAT SOFTWARE ....................................................................................................................... 8
          2.4.    KEY IT TRENDS EFFECTING SOFTWARE DEVELOPMENT IN THE NEXT DECADE .................................................................................. 8
             2.4.1.     Cloud must integrate with the edge ................................................................................................................... 8
             2.4.2.     Continued automation ........................................................................................................................................ 8
             2.4.3.     Data explosion continues .................................................................................................................................... 9
             2.4.4.     Harnessing AI ...................................................................................................................................................... 9
             2.4.5.     Cybersecurity ...................................................................................................................................................... 9
          2.5.    THE CHALLENGE TO SOFTWARE ENGINEERING, SOFTWARE QUALITY AND COSTS ........................................................................... 12
     3.      2020 FINDINGS FOR COST OF POOR SOFTWARE QUALITY................................................................14
          3.1.    COST OF UNSUCCESSFUL IT/SOFTWARE PROJECTS................................................................................................................ 14
          3.2.    COST OF POOR QUALITY IN LEGACY SYSTEMS ...................................................................................................................... 15
          3.3.    COST OF OPERATIONAL SOFTWARE FAILURES ...................................................................................................................... 16
          3.4.    COST OF CYBERSECURITY AND TECHNICAL DEBT ................................................................................................................... 20
             3.4.1.    Spotlight on Cybercrime .................................................................................................................................... 20
             3.4.2.    Attributing cybercrimes to software growth .................................................................................................... 23
             3.4.3.    Software technical debt .................................................................................................................................... 23
          3.5.    CPSQ 2020 CONCLUSIONS ............................................................................................................................................. 23
     4.      RECOMMENDATIONS ................................................................................................................................. 25
          4.1.    OPERATIONAL SOFTWARE FAILURES ................................................................................................................................... 25
             4.1.1.    Low quality development practices .................................................................................................................. 27
             4.1.2.    Inclusion of flawed components ....................................................................................................................... 28
             4.1.3.    Language-specific vulnerabilities ...................................................................................................................... 28
          4.2.    LEGACY SYSTEMS CPSQ .................................................................................................................................................. 29
          4.3.    COST OF UNSUCCESSFUL IT/SOFTWARE PROJECTS................................................................................................................ 29
     5.      CONCLUSIONS .............................................................................................................................................. 31
          5.1.       AT THE INDIVIDUAL LEVEL ................................................................................................................................................ 31
          5.2.       AT THE PROJECT/TEAM LEVEL ........................................................................................................................................... 31
          5.3.       AT THE ORGANIZATION LEVEL ........................................................................................................................................... 32
          5.4.       PULLING IT ALL TOGETHER - DEVQUALOPS .......................................................................................................................... 34
     6.      ACKNOWLEDGEMENTS .............................................................................................................................. 36
          6.1.       2020 REPORT SPONSORS ................................................................................................................................................ 36
     7.      APPENDIX A – 2018 CPSQ REPORT REVISITED ...................................................................................... 38
          7.1.       LOOKING AT LEGACY SYSTEMS ........................................................................................................................................... 39
          7.2.       SOFTWARE SYSTEM FAILURES IN OPERATION ........................................................................................................................ 40
          7.3.       TROUBLED/CHALLENGED PROJECTS ................................................................................................................................... 40
          7.4.       FINDING AND FIXING DEFECTS ........................................................................................................................................... 41
          7.5.       TECHNICAL DEBT............................................................................................................................................................ 42

     Page 2 of 46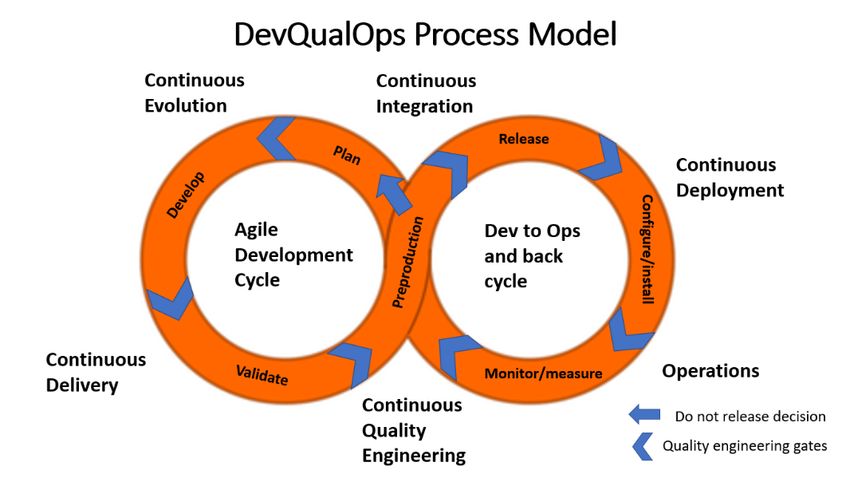
CISQ Consortium for Information & Software Quality I The Cost of Poor Software Quality in the US: A 2020 Report

          7.6.      CPSQ IN SUMMARY ....................................................................................................................................................... 42
          7.7.      CONCLUSIONS AND RECOMMENDATIONS SUMMARY - 2018 ................................................................................................... 43
     8.     APPENDIX B - IT SPENDING TRENDS ...................................................................................................... 45
          8.1.      IT MARKET TRENDS IN 2020 AND BEYOND .......................................................................................................................... 45
          8.2.      IT SPENDING TRENDS IN US AND CANADA .......................................................................................................................... 46

     List of Figures and Tables
     FIGURE 1: CPSQ IN 2020 IN THE US ............................................................................................................................................. 4
     FIGURE 2: IT PROJECT OUTCOME RATES: 2020 ......................................................................................................................... 14
     TABLE 1: SOFTWARE FAILURE STORIES IN THE NEWS ............................................................................................................... 17
     FIGURE 3: CYBERCRIME $$ GROWTH TREND: 2015-2021 ......................................................................................................... 21
     FIGURE 4: CYBERCRIME GROWTH TREND IN US........................................................................................................................ 22
     FIGURE 5: CYBERCRIME COST BY ATTACK TYPE ......................................................................................................................... 22
     FIGURE 6: VULNERABILITIES, WEAKNESSES & EXPLOITS ........................................................................................................... 26
     TABLE 2: PROBABILITY OF PROJECT CANCELLATION BY SIZE AND QUALITY LEVEL ................................................................... 30
     TABLE 3: BEST VS. WORST IT PERFORMANCE FACTORS ............................................................................................................ 32
     FIGURE 7: BEST PRACTICES VS. PROJECT PERFORMANCE ......................................................................................................... 33
     FIGURE 8: THE NEW DEVQUALOPS PROCESS MODEL ............................................................................................................... 34
     TABLE 4: COST OF BUSINESS DISRUPTIONS DUE TO SOFTWARE MANAGEMENT FAILURES ..................................................... 40
     FIGURE 9: SOFTWARE PROJECT OUTCOME RATES: 2018 REPORT ............................................................................................ 41
     FIGURE 10: THE PROCESS OF FINDING AND FIXING SOFTWARE DEFECTS ................................................................................ 42
     FIGURE 11: CATEGORIES OF IT SPENDING ................................................................................................................................. 45

     Copyright Notice
     © 2021 Consortium for Information & Software QualityTM (CISQTM). All rights reserved. You may download, store,
     display on your computer, view, print, and link to The Cost of Poor Software Quality in the US: A 2020 Report at
     the CISQ Web site subject to the following: (a) the Guidance may be used solely for your personal, informational,
     non-commercial use; (b) the Guidance may not be modified or altered in any way; (c) the Guidance may not be
     redistributed; and (d) the trademark, copyright or other notices may not be removed. You may quote portions of
     the Guidance as permitted by the Fair Use provisions of the United States Copyright Act, provided that you
     attribute the portions to the CISQ The Cost of Poor Software Quality in the US: A 2020 Report (2021).

     Page 3 of 46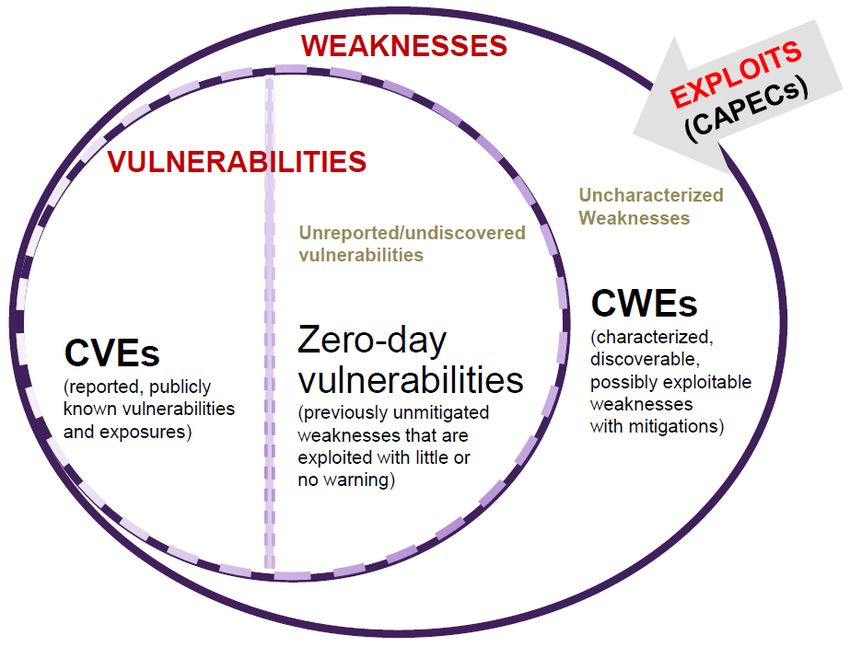
CISQ Consortium for Information & Software Quality I The Cost of Poor Software Quality in the US: A 2020 Report

     1. EXECUTIVE SUMMARY
     This report was developed during especially turbulent times with the world battling a global pandemic. Yet,
     software continues to grow, proliferate, and enhance our digitally enabled lives. As organizations undertake
     major digital transformations, software-based innovation and development rapidly expands. The result is a
     balancing act trying to deliver value at high speed without sacrificing quality. Generally, however, we are not
     very good at balancing. Software quality lags behind other objectives in most organizations. That lack of primary
     attention to quality comes at a steep cost, which is revealed in this report. While organizations can monetize the
     business value of speed, they rarely measure the offsetting cost of poor quality.

     For the year 2020, we determined the total Cost of Poor Software Quality (CPSQ) in the US is $2.08 trillion (T).
     We also note that the 2020 US figure for the software technical debt residing in severe defects that need to be
     corrected would be $1.31 T (minus interest) but did not include technical debt in the total CPSQ since it
     represents a future cost which is increasing (14% rise since 2018). The graphical results are shown below.

     Figure 1: CPSQ in 2020 in the US

     Specifically, we determined that:

          •    The largest contributor to CPSQ is operational software failures. For 2020 we estimated that it is ~$1.56
               T, a 22% growth over 2 years – but that could be underestimated given the meteoric rise in
               cybersecurity failures, and that many failures go unreported. The underlying cause is primarily
               unmitigated flaws in the software.
          •    The next largest contributor to CPSQ in unsuccessful development projects totaling $260 billion (B),
               which rose by 46% since 2018. The project failure rate has been steady at ~19% for over a decade. The
               underlying causes are varied, but one consistent theme has been the lack of attention to quality.
          •    Legacy system problems contributed $520 B to CPSQ (down from $635 B in 2018), mostly still due to
               non-value added “waste.”

     The detailed calculations leading to these totals are found in section 3 of this report.

     Page 4 of 46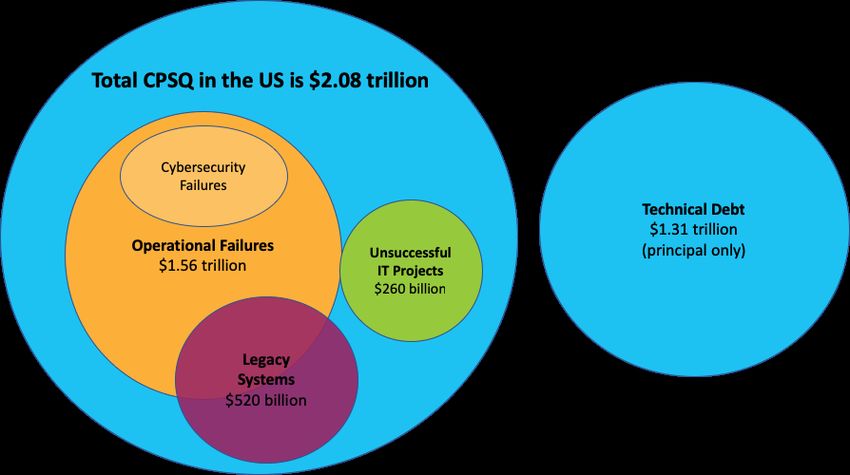
CISQ Consortium for Information & Software Quality I The Cost of Poor Software Quality in the US: A 2020 Report

     Our general recommendations for 2020 continue to emphasize prevention. The next best approach is to address
     weaknesses and vulnerabilities in software by isolating, mitigating, and correcting them as closely as possible to
     where they were injected to limit the damage done. More specifically, we recommend that software shops:

          •    Avoid low quality development practices and adopt secure coding practices.
          •    Recognize the inherent difficulties of developing software and use effective tools to help deal with those
               difficulties.
          •    Ensure early and regular analysis of source code to detect violations, weaknesses, and vulnerabilities.
          •    Measure structural quality characteristics.
          •    Focus on the evaluation of included components (e.g., open source) and platforms which may have
               unknown weaknesses or vulnerabilities.
          •    Learn more about the typical vulnerabilities and exploitable weaknesses attributable to certain
               programming languages.
          •    Use best known practices for managing a legacy system – especially when it comes to overcoming the
               loss of understanding and knowledge of how the system works internally. Benchmarking health status is
               a good place to start.
          •    Avoid unsuccessful projects by not creating arbitrary schedules. Pay attention to defined quality
               objectives and measure against those objectives throughout the project lifecycle.
          •    Invest smartly in software quality improvements based on CPSQ numbers in hand.
          •    Focus on the different results of good vs. poor software quality in your shop and relevant benchmark
               organizations.

     By attempting to improve CPSQ, other economic target areas will be impacted – e.g. cost of ownership,
     profitability, human performance levels, ability to innovate, and effectiveness of your mission critical IT systems.

     In our conclusions we identify what specific actions you can take at the level of: 1) individual software
     professional, 2) team/project leader, and 3) management/executive level of an organization. We also reveal an
     important (but little known) study that explains the difference in practices between high performing vs. low
     performing software organizations. That study revealed a 5-10X difference in performance between the top 10%
     and the bottom 10% of organizations sampled. When you dig deeper into the data, the reason is clearly the
     adoption of certain quality and process best practices. The key enablers for achieving the highest levels of cost,
     schedule AND quality performance are:

          •    A well-defined, yet adaptable development process
          •    Excellent estimation methods
          •    Project management discipline
          •    Excellent staff skill levels
          •    Quality vision
          •    Customer satisfaction focus
          •    TQM management culture
          •    Defect prevention

     These best practices and recommendations are then consolidated in our conceptual process model called
     DevQualOps – which represents the next evolutionary step beyond today’s Agile plus DevOps and similar
     continuous evolution and delivery models.

     Page 5 of 46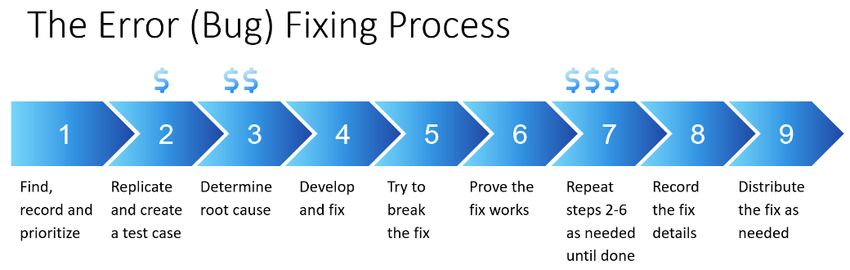
CISQ Consortium for Information & Software Quality I The Cost of Poor Software Quality in the US: A 2020 Report

     In this report we quantified the negative economic value of poor quality in our software systems at a US national
     level. We did so, with the hope and expectation that the readers of this report will be inspired to do likewise
     within their own organizations.

     Page 6 of 46
CISQ Consortium for Information & Software Quality I The Cost of Poor Software Quality in the US: A 2020 Report
2. THE ENVIRONMENT AFFECTING SOFTWARE AND ITS COSTS
2.1. The cost of Covid-19 in the US
This report is being developed during especially turbulent times with the world battling a global pandemic. In
mid-October 2020, the International Monetary Fund (IMF) predicted a steep fall in current international growth
as the global economy struggles to recover from the pandemic-induced recession, its worst collapse in nearly a
century. After 2.8% growth in 2019, the IMF predicts a rebound to global growth in 2021, but the recovery will
be long, uneven, and uncertain.
In the US, the IMF forecasts an economic contraction of 4.3% for 2020, compared to growth of 2.2% the
previous year. The US budget deficit soared to a record $3.1 trillion in the 2020 fiscal year, underscoring the
long-term economic challenges facing the US as it tries to emerge from its sharpest downturn since the Great
Depression.
Based on current assumptions, the estimated cumulative financial costs to the US of the COVID-19 pandemic
related to the lost output and health reduction is estimated at more than $16 trillion, or approximately 90% of
the annual gross domestic product. For a family of four, the estimated loss is nearly $200,000.
Technology companies have led the way on a variety of strategies other industries are now using to cope in this
crisis — from remote working to managing globally dispersed supply chains. This crisis might well spark further
creativity and innovation. Remote work, online education, and social distancing create demand for products and
services delivered by the IT industry.
2.2. Computing technology continues to move forward
The McKinsey & Co. October 2020 report found that nimble companies shifted to remote work more than 40
times faster than they expected possible. Interactions between customers and North American companies are
now 65% digital, compared to 41% pre-pandemic. Similar trends are seen globally. Changes made to cope with
the pandemic — like moving to cloud computing or online purchasing — are likely to stick in the long term.
Computing technology has allowed people to work, shop, and study remotely, and many people will continue
the habits they have acquired since March 2020 when the pandemic began. Rapid digitalization accelerates the
global demand for software-based solutions.
On the other hand, privacy violations, data breaches, social media-enabled disinformation, market domination,
and other controversies have thrust the technology industry, and many of its leading corporations, into the
media spotlight and government watchdog lens. And these are only the problems that are visible. The vast
majority of technology problems and failures are still well-hidden from public awareness, and therefore, so are
the costs.
Software and digital content companies now make up 78% of the Deloitte Fast 500 list of winners, while
hardware, device, and networking companies constitute just 10%. Over the last 25 years, software ate the
hardware. In 2011, Marc Andreeson proclaimed that “Software is eating the world” - which is still the case, but
more voraciously.
Page 7 of 46CISQ Consortium for Information & Software Quality I The Cost of Poor Software Quality in the US: A 2020 Report
The US is the largest technology market in the world, representing 33% of the global total, or approximately $1.6
trillion for 2021. More detail on the economic trends for the IT market may be found in Appendix B.
2.3. Services are now trying to eat software
Products and services that were traditionally delivered through other means are now being run by software and
delivered as online services with great financial success. In an age where billions of people have access to the
internet, the economic shift to software and software-enabled services took shape, disrupting traditional
industries. For example, consider the contrast between the fall of Borders and the rise of Amazon. New software
platforms and tools are ironically making the development of yet more disruptive software easier and more
accessible than any other time in history, spurring an accelerated cycle of development and growth.
Digital transformation is accelerating and being fueled by more software solutions. Software-as-a-Service (SaaS)
is at the heart of digital transformation, transforming industry after industry, as companies substitute capital
investments in software over labor and tangible assets. For more information, see Digital Transformation: The
Definitive Guide (2021). Many digital transformation initiatives fail not because of a focus on technology and
business, but rather poor software engineering and lack of attention to quality issues.
2.4. Key IT trends effecting software development in the next decade
Newer technologies to keep an eye on include virtual reality, autonomous vehicles, drones, 5G, augmented
reality, 4-D printing, digital currencies, digital assistants, blockchain, quantum computing, microchip implants,
volumetric displays/holograms, self-healing systems, digital twins, AI everywhere, smart dust, more mobile
devices, and the spread of IoT. From a software quality cost perspective, the following five areas in particular
bear further scrutiny over the next decade.
2.4.1. Cloud must integrate with the edge
Cloud adoption has now reached every industry, from government to manufacturing. Ninety-four percent of IT
professionals say their company is using public, hybrid, or private cloud. Of those using cloud, 84% are taking a
multi-cloud approach, using the best that large public clouds, including Amazon Web Services, Microsoft Azure,
and Google Cloud, have to offer (Flexera). In the next decade, we will see diminishing returns on cloud
investments in terms of differentiating from competition. Innovators are now focusing on improving capabilities
at the edge of networks. The capability to capture data at the edge and automate decision making will create
new competitive advantages for organizations. Some innovators are already collecting data inputs such as
human biometrics and using AI to determine emotional reactions to make better decisions. IoT devices can
collect a tremendous amount of data at the edge, and how best to store and transfer all that data leads to more
decentralized solutions. Some of this data is sensitive, and secure access needs will force society to grapple with
new ethical considerations.
2.4.2. Continued automation
Through robotic machinery and software, many tasks that were previously assigned to people are now fully
automated in certain controlled settings. Factory workers are the primary example of people being replaced by
robots, but many other professions will be impacted. A new paradigm of work will emerge that involves both
robots and humans working side by side for mutual benefit. This activity will create 133 million new roles in the
workplace, for a net gain of 58 million new jobs according to the World Economic Forum.
Page 8 of 46CISQ Consortium for Information & Software Quality I The Cost of Poor Software Quality in the US: A 2020 Report
2.4.3. Data explosion continues
Through 2025, annual data generation is expected to increase from 33 zettabytes to 154 zettabytes. Estimated
size of global datasphere in 2025 is 163 zettabytes; a 10x growth from 16.1 zettabytes in 2016 (Berthier). One
zettabyte is equal to one trillion gigabytes. Ultimately, the value of data is becoming more literally equated to
equity.
More data online means more opportunities exist for misuse, which has numerous consequences for our society
and economy. Some online services are being misused by manipulative algorithmic systems to amplify the
spread of disinformation and for other harmful purposes. These new challenges and the way platforms address
them have a significant impact on fundamental rights online. “Gatekeeper” platforms now bear an additional
burden to show responsibility for their content. The European Union (EU) is leading the charge in creating a
modern legal framework to ensure the safety of users online, establish governance with the protection of
fundamental rights at its forefront, and maintain fair and open online platform environments. 2021 will be a
landmark year for this trend to continue.
2.4.4. Harnessing AI
Artificial intelligence-driven technology is on the rise and is penetrating all manner of industries. The continued
development of machine learning platforms is making it easier and convenient for businesses to utilize artificial
intelligence. Some of the industries that are already adopting this technology include automotive, marketing,
healthcare, finance, and so on. In the next decade, AI will also impact agriculture, aerospace, construction,
logistics, robotics, connected mobility, and social media. Classifying and predicting data from the Internet of
Things (IoT) with multilayer perceptron (MLP) intelligence will provide new findings and insights into connected
devices. Intelligent data access, predictive analysis, enhanced customization, real-time marketing activities,
virtual agents and AI-powered chatbots are coming soon. As AI-driven processes become more sophisticated
and are specialized to solve more industry problems, there’s no telling how much AI could influence existing
business processes. On the home front we will continue to see more AI-driven smart devices/gadgets, media
streaming gadgets, semi/autonomous vehicles, and home appliances. Advanced MLP and natural language
processing (NLP) will lead to augmented analytics, augmented reality, and better speech recognition and
interpretation. AI-software writing its own new software is not going to make a widespread impact any time
soon, unless it can be taught to identify code patterns of vulnerabilities, weaknesses, and faults at the point of
injection.
2.4.5. Cybersecurity
It is not surprising that 2019 saw over 3,800 publicly disclosed breaches as cyberattacks, and 2020 ended with
one of the most publicized software supply chain attacks associated with the SolarWinds Orion
compromise. Still, the number of cyberattacks continues to grow. It is estimated that by 2021, the global
economy would bear the loss of $6 trillion due to cyberattacks. Ransomware damages alone are now predicted
to cost the world $20 billion in 2021. The above estimates could be low since they may not include cybercrimes
against individuals that don’t get reported, such as identity theft. What makes most of these attacks successful
by outside agents is vulnerable software systems – a problem we must vigorously address in the coming years.
Cybersecurity has become a chief concern and a business requirement among many business leaders. As
businesses keep shifting and becoming more digital, they expose themselves more to the growing attack
surface. With increasing awareness among businesses, 2021 will see an increase in spending on cybersecurity.
Page 9 of 46CISQ Consortium for Information & Software Quality I The Cost of Poor Software Quality in the US: A 2020 Report
Recent reports from PricewaterhouseCoopers (PwC) claim that the cyber insurance market is expected to
exceed $7.5 billion in premiums by the start of 2021. The PwC study also revealed over 60% of business owners
recognize cyber as a significant threat to growing their business.
It’s not surprising that privacy regulators have a tough time catching cybercriminals who breach cyber networks
to siphon private data. Failed cybersecurity protocols form the crux of data breaches and ransomware attacks.
Cybercriminals are evolving their tactics to outweigh the impact of cybersecurity investments by businesses.
Even cybersecurity organizations are being hacked by well-organized nation states.
As this report is being released, cyberattacks against more than 18,000 government, consulting, technology,
telecom and corporate entities in North America, Europe, Asia and the Middle East have been uncovered. Even
Microsoft products may have been indirectly hacked. Additionally, certain nation-state troll farms are now
franchising their tools and techniques to other troll farms.
Around 3.1 million professionals are needed worldwide to bridge the cybersecurity talent gap, according to the
International Information System Security Certification Consortium (ISC2).
The top cybersecurity trends to be watching in 2021 are described below.
Critical infrastructure
Critical infrastructure is composed of the systems on which the societies heavily rely on. These include the
electricity grid, water purification, traffic lights, shopping centers, and hospitals. To mitigate risk exposures
attributable to exploitable software or reduce the impact of cyber-attacks, the organizations responsible for
maintaining critical infrastructure must address software security. Organizations that utilize the critical
infrastructure must also evaluate the amount of damage that is caused due to cyber-attacks. These
organizations must have a contingency plan that would help their businesses to bear no brunt of the cyber-
attacks.
Networks
Computer networks must be secured from intruders, targeted attackers, and opportunistic malware. As the
Internet has an assortment of networks associated with various websites, it is often observed that organizations
become targeted with unauthorized intrusion with malicious intent. Also, as many websites contain third party
cookies, the users’ activities are tracked. Sometimes this might prove helpful for organizations to grow their
businesses, but often customers become prey to fraud and exploitation. Hence, to counter cyber-attacks and
malware associated with the network, organizations must deploy a security program to monitor the internal
network and infrastructure. Experts have suggested leveraging Machine Learning technology to alert the
authorities in the case of abnormal traffic. Organizations must continue to upgrade their network security by
implementing policies that can thwart cyber-attacks. Fixing vulnerable TCP/IP legacy code and network
management platforms would be a good place to start.
Unfortunately, the global Covid-19 pandemic has created new incentives for cybercriminals. In July, hackers
linked to a Russian intelligence service tried to steal information from researchers working to produce vaccines
in the US, Britain, and Canada, according to security officials in those countries. Later, in December, with one or
more vaccines being approved, sophisticated hackers, assumed to be state agents, have been carrying out a
global phishing campaign targeting the vital “cold chain” that will protect coronavirus vaccines during storage
Page 10 of 46CISQ Consortium for Information & Software Quality I The Cost of Poor Software Quality in the US: A 2020 Report
and transport, according to IBM security researchers and a US Cybersecurity and Infrastructure Security Agency
(CISA) alert.
Cloud
With the plethora of data available, it becomes difficult for organizations to store this data in physical form.
Also, it is observed that often this data is unstructured and derived from unknown sources, which can cause a
risk to the organization’s network. Hence, Amazon Web Services, Microsoft Azure, and Google Cloud present
their customers with a cloud computing platform where users can store and monitor data by implementing
security tools. Cloud services still rely on software to provide requisite capabilities.
Internet of Things (IoT) and Bring Your Own Device (BYOD)
IoT is being observed to be the next tool for the technological revolution. A report by Bain and Company has
estimated the market size for IoT to expand by $520 billion by the year 2021. With the help of its security
network, IoT provides the user with a variety of critical and non-critical appliances. The report suggests that one
of the main obstacles for implementing IoT in any organization is the threat to security. By integrating the
system with IoT security, organizations are provided with insightful analytics, legacy embedded systems, and a
secure network.
Applications
Users rapidly get infatuated with different applications which include hardware, software, and devices. But an
application becomes equally prone to cyber-attack or malware like the network. Application security thwarts
cybersecurity infringement by adopting hardware and software assurance methods at the development phase of
the project. With the help of an application security network, companies and organizations can detect sensitive
datasets and secure them with specific applications. Some of the methods associated with application security
are anti-virus, firewalls, encryption, and tools and practices focused on mitigating exploitable weaknesses and
vulnerabilities in software architecture, design, and code.
Data
Data is software too. Data highways pose a rampant cybersecurity threat. The public concern about their data
management has to be a top priority for businesses present online. The rising number of data breaches make it
tough for businesses to ignore data security and privacy concerns. The usage of third-party data for business
gains must fall under the following purviews:
• Individuals must know how their data will be used
• Data encryption cannot be ignored
• Individuals must have an option to forbid sharing their data
• Companies must report any public data breach within a stipulated time
Employees are increasingly getting involved in data leaks intentionally or unintentionally. 34% of cyber-attacks in
2019 were due to misdeeds of internal employees. Ubiquitous USB drives can transport massive information to
aid in data exfiltration. Phishing expeditions are still quite successful, too. The source vectors for many data
breeches continue to be unpatched software vulnerabilities.
Page 11 of 46CISQ Consortium for Information & Software Quality I The Cost of Poor Software Quality in the US: A 2020 Report
Financial transactions
Blockchain is the go-to technology for enabling distributed trust, where intermediaries in a network rely on it to
hold credible information about each participant's reputation, enabling transaction-level trust. This dynamic has
enabled new governance models for systems securing IoT devices as well as systems designed to match
problems to the best machine learning algorithms. It is also enabling new scenarios for data equity by allowing
for digital scarcity. Blockchain solves the problem of data being infinitely copied without cost, meaning
intellectual property owners can confidently enter digital markets where copyright is respected. In platform
organizations, blockchain is being embraced as a tool that can effectively disintermediate relationships, enabling
more efficient peer-to-peer connections where rules can be customized towards the end goals of the
transactional parties.
2.5. The challenge to software engineering, software quality and costs
There are simply not enough good software developers around to create all the new and modified software that
users need. Given the indirect as well as the direct contribution of software to the economic base of most
industrialized countries, and considering the ways in which software can amplify the powers of the
individual/teams/organizations, we cannot allow this situation to continue.
Just two percent of the worldwide population knows how to develop software, and the need is estimated to
grow by 24% over the next seven years. There aren’t enough educational programs available around the world
to keep pace with the need. According to software.org, the number of jobs created directly by the US software
industry increased 7.3% over 2016-2018, including a total of 14.4 million jobs (including indirect and induced
impacts) and 3.1 million direct jobs, thus creating a Total Value-Added impact to the US GDP of $1.6 trillion
(including indirect and induced impacts). The US Bureau of Labor Statistics (BLS) ranks IT-related employment as
a field that is growing “much faster than average” and that software developers can expect to see ongoing
robust growth through 2028. The BLS estimates that US software developer jobs will grow at a rate of 22% over
the next decade.
To address this challenge and other pressures, software engineers are building new software out of available
components to the extent possible. For example, currently popular open source software platforms include Fat
Free CRM, InfluxDB, D3.js, R, TensorFlow, Keras, Serverless, Apache Airflow, Activiti, PrestaShop, and OpenCart.
The quality of these software components is empirically unknown, and therefore might potentially introduce
flaws that compromise success.
Software engineering is a highly challenging profession, made so because:
• Software size, complexity and technical debt is growing
• The nature of the problems to be solved is shifting
• Global disruptive forces are at play – e.g., cyberattacks, widespread disinformation, pandemic, etc.
• Rapid technology advancement
• End-user needs that constantly evolve
• The technology stack that a system is made of constantly evolves and changes
• The operating model constantly evolves to adapt to changing customer needs, changing technologies,
and changing vendor environments
• The vendor ecosystem constantly evolves
• The necessary technical skills constantly evolve
Page 12 of 46CISQ Consortium for Information & Software Quality I The Cost of Poor Software Quality in the US: A 2020 Report
• Data trustworthiness, protection and cybersecurity have become more important
• The pressures to deliver IT value at speed have not diminished
• Every line of code is a potential point of failure
• All software is affected by external factors (e.g., dependencies, constraints)
Software is inherently complex; the complexity of which often exceeds human intellectual capacity. Thus, the
nature of software development is inherently difficult, and even more so when quality is not an explicit
objective. Better tools are needed to automate development activities, especially in terms of preventing and
mitigating flaws in software.
The definitions of software quality, good versus poor software quality, and the cost of software quality model
that we advocate were described in Chapter 6 of our 2018 report. These concepts are assumed background
knowledge for readers of the remaining sections of this year’s report.
Page 13 of 46CISQ Consortium for Information & Software Quality I The Cost of Poor Software Quality in the US: A 2020 Report
3. 2020 FINDINGS FOR COST OF POOR SOFTWARE QUALITY
The result of increased digitalization through software has created a balancing act trying to deliver value at high
speed without sacrificing quality or security. As it turns out, we are not very good at balancing.
We have assumed in this year’s findings that the cost of finding and fixing defects (although huge on its own) is
fully represented in the first three categories below. Cybersecurity and Technical debt will be addressed
separately. Cybersecurity has a measurable and growing impact on the cost of software quality. Technical debt
has a growing impact on future cost.
The main categories representing different components of the cost of poor software quality (CPSQ) are:
1. Cost of Unsuccessful IT/Software Projects
2. Cost of Poor Quality in Legacy Systems
3. Cost of Operational Software Failures
4. Cost of Cybersecurity and Technical Debt
In the following sections we present our CPSQ findings for 2020 followed by a brief discussion of technical debt
and a summary of the total CPSQ in the US. Those readers who are interested in a retrospective summary of our
2018 report findings and conclusions are referred to Appendix A of this document.
3.1. Cost of Unsuccessful IT/Software Projects
Since 1994, The Standish Group has been reporting on IT project outcomes and building their database of 50,000
projects. At the end of March 2020, The Standish Group released its latest report CHAOS 2020: Beyond Infinity.
In that report they stated that only 35% of projects were fully successful with respect to time and budget. Their
data says nothing about the quality of the result; presumably those projects had successful outcomes as well.
They show a staggering 19% of projects will be cancelled before they get completed, and 47% are challenged
(over budget, behind schedule, and produce low quality deliverables). The cost of cancelled and challenged
projects is usually hidden below the tip of the proverbial iceberg. The historical trend is seen in the summary
figure below based on The Standish Group data. Project failure rates have been steady at ~19% for many years.
Figure 2: IT Project Outcome Rates: 2020
Page 14 of 46CISQ Consortium for Information & Software Quality I The Cost of Poor Software Quality in the US: A 2020 Report
This year for the first time, The Standish Group tried to tease out why there might be such large variation in
project outcomes. To do that, they created a new definition of project maturity, which broke away from the
notions of organizational maturity (ala CMMI). Their new definition incorporates three factors of success,
namely, having in place: a good sponsor, a good team, and a good place.
They also claim that success rates go up dramatically when using agile + DevOps in a highly mature way, thus
leading to decision latency being minimized. They envision a seamless delivery pipeline between software
development, implementation, and services delivered. Their pipeline concept is segmented into a series of
cross-functional teams. Using this definition, they claim that highly mature projects are almost 90% successful,
whereas immature projects are 10% successful. Failed projects are only 2% likely given high maturity. It is not
clear how they came up with these likelihoods. Therefore, we will watch The Standish Group’s maturity concept
materialize in the coming years.
Recall from section 4.3 that the global computer and information technology industry was on pace to reach $5
trillion in 2020, with the US representing 32% of the total, or approximately $1.6 trillion for 2020. So, if the US
spent $1.6 trillion in 2020 on IT, and 25% of that was spent on development projects, that equates to $400
billion. And if 65% of that was spent on failed and challenged projects, the CPSQ due to unsuccessful projects in
the US in 2020 is $260 billion (up from $177.5 billion in 2018).
3.2. Cost of Poor Quality in Legacy Systems
Using the same approach as 2018, we created an estimate of the overall cost of poor-quality legacy software in
operation and maintenance (O&M). Following that reasoning, we estimate that the US spent $1.6 trillion in 2020
on IT, and that ~75% of that was spent on legacy systems, or $1.2 trillion. If $1.2 trillion is being spent on legacy
systems, and if as much as two-thirds of that could be classified as waste, that gives us an approximate upper
bound of $800 billion on the cost of poor-quality software in O&M from a maintenance perspective. This waste
does not include additional costs incurred outside of the IT organization. The lower bound using only corrective
maintenance in the calculation would be $240 billion. The mid-point between the upper and lower bound would
be $520 billion, which we take as our first order approximation of the CPSQ due to legacy systems in 2020.
Another way to approach this is to approximate the total IT wage base and estimate how much of that is being
spent on legacy systems. Using the US Bureau of Labor Statistics (US BLS) data allowed us to calculate the US
population of IT professionals and their approximate total salaries over all IT labor categories to come up with a
total level of US IT salary expenditure for 2018 of $600 billion. Adding in the missing categories from the BLS
database and gig workers, we concluded that the total US IT professional wage base in 2018 was ~$1 trillion,
with about 6.6 million Americans working in computer or IT fields. It was hard to get any information on the
number of gig workers. At that time, IT professionals were also experiencing annual salary growth of about 3.4-
4.0%.
US BLS says there were 1.4692 million software developers in 2019 with a median pay rate of $107,510 per year.
When you add up all of the other computer and IT occupations in the BLS, which are clearly involved with
software, you get an additional 2.733 million jobs. BLS says the median annual wage for all computer and IT
occupations was $88,240 in May 2019. Another report claims that the average annual wage for software
developers in the US was $114,000 in 2018. They probably included categories not in the BLS database.
But the BLS database does not include an additional set of occupations involved with software. For example, BLS
does not contain:
Page 15 of 46CISQ Consortium for Information & Software Quality I The Cost of Poor Software Quality in the US: A 2020 Report
• IT managers – 461,000 of them at a pay rate of $146,360
• IT project managers/SQA/testers– 412,800 of them at a pay rate of about $88,550
• Computer systems engineers – number and pay rate unknown
• CIOs, CTOs and other software C-suite executives – pay rate unknown
Employment in computer and IT occupations was projected by BLS to grow 11% from 2019 to 2029, much faster
than the average for all occupations. Other reports have claimed that employment growth in this field has been
7.3% over the last 2 years. For ease of computation, assume that the growth is ~10%. In 2018 we estimated 6.6
million IT workers in the US, so in 2020 there would be about 8 million workers in this field, and they are making
anywhere between $88,500 and $150,000, plus additional C-suite software executives that are making much
more. There are also many gig workers who are being paid hourly and have not been counted at all. When we
factor in higher-level jobs missing from BLS data, we could conclude that the average IT worker salary is closer to
$150K/year, which would give us an approximate wage base total for all US IT/software jobs in 2020 of $1.2
trillion. Which is not very different than the $1.6 trillion we calculated with our initial approach. Splitting the
difference gives us an estimate of $1.4 trillion.
So, we will stick with $520 billion as our first order approximation of the CPSQ due to legacy systems in 2020.
This is down somewhat from our 2018 estimate of $635 billion, which seems plausible as scarce resources may
have been shifted and senior IT maintenance staff retired.
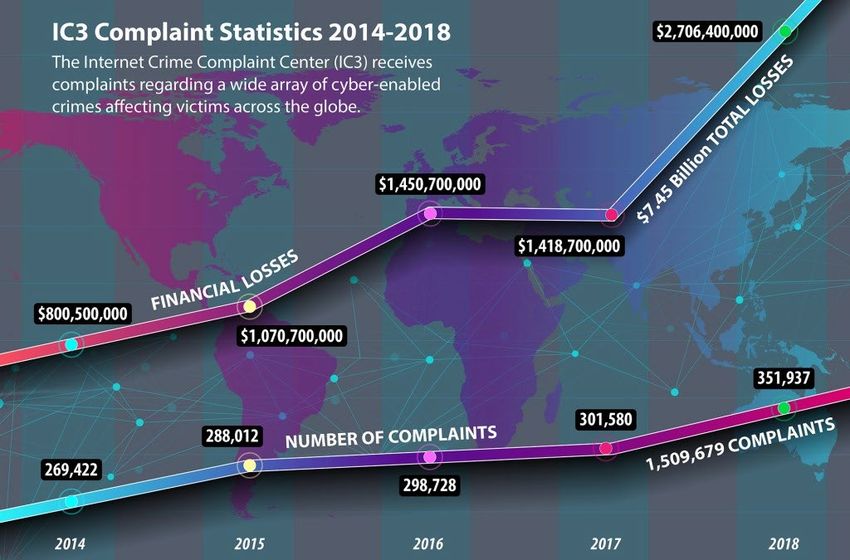
3.3. Cost of Operational Software Failures
2019-2020 was dominated by the biggest software failures in recent history including ransomware attacks,
cybersecurity attacks, IT outages, and data leakages that affected some of the biggest companies and millions of
customers around the world. Software failures wreaked havoc at banks, airlines, and in government systems,
costing billions of dollars in damage and creating devastating disruption. Cybercrimes enabled by exploitable
weaknesses and vulnerabilities in software are the largest growth area by far in the last 2 years.
This area of CPSQ is the most difficult to estimate due to the dearth of real empirical data on the subject and
that many/most of these failures are not reported. It is also the area where rapid growth is most likely. In 2018
we estimated that the CPSQ due to failures was $1.275 trillion. Continued growth in failure reports tells us that
in 2020 this should be much higher.
Over the last two years, we compiled a list of the most impactful software failures in the English news media, as
anecdotal indicators of the larger problem. The table below lists some of the top 2018-2020 IT failures in the
news (in no particular order), representing just the tip of the CPSQ iceberg.
Page 16 of 46CISQ Consortium for Information & Software Quality I The Cost of Poor Software Quality in the US: A 2020 Report
Table 1: Software Failure Stories in the News
Home Depot On 11/21/2020, six years after its 2014 data breach, Home Depot agreed to pay US
(update) states $17.5 million for an incident that compromised payment card data of 56 million
individuals.
Iowa Caucus In preparation for the 2020 Iowa caucus, the Democratic Party wanted to update its reporting
Smartphone app infrastructure, moving away from a system in which the state precincts would phone in results
to a smartphone app used to simply upload the information. The party (as did Nevada) paid
the new company, Shadow, $60,000 over a few months to develop an app called
IowaReporterApp. The app sends the results from 1,700 precincts to a central office for
tabulation. The caucus runners had to take and upload a picture of their results, which were
then supposed to be captured by the app. But the app was not well-tested with regards to its
intended usage environment and installation was not simple. This situation was clearly a
system and process failure, and perhaps included coding errors. Shadow probably had almost
no quality system (QA/QC) for this rushed effort. The damage done to the reputation of the
Iowa caucus was unenumerable.
NASA/Boeing NASA awarded Boeing nearly $5 billion to develop the Starliner spacecraft, which is built to
Starliner carry as many as five people. Now more than three years behind schedule, the project is
under heavy scrutiny from a NASA investigation, which is taking a closer look at problems
found during the December 2019 test flight. The goal of that mission was to fly Starliner
without crew to the International Space Station (ISS), deliver cargo, and return safely to
demonstrate its capabilities and safety. But the spacecraft did not dock with ISS after a
software issue during launch caused Starliner’s autonomous flight-control system to misfire,
putting Starliner in the wrong orbit. The mission was cut short, and the Starliner landed.
Additionally, NASA confirmed that Boeing’s Starliner suffered not one but two major software
defects during that test flight. The latter software problem could have caused “catastrophic
spacecraft failure,” a panel of NASA safety experts said, if Boeing had not caught the issue
during the mission. The second software issue was a piece of code that could have caused two
pieces of Starliner – its “crew module” and “service module” – to collide in orbit before the
spacecraft re-entered the atmosphere. “What we wish we’d done better was the software, so
there’s a lot of learning there,” Boeing Senior VP Jim Chilton said.
Boeing reported that it took a $410 million charge in 4Q2019 in case another uncrewed flight
is determined to be necessary. Future commercial crew contracts will be up for grabs, as NASA
would look to buy seats on SpaceX’s Crew Dragon.
Heathrow Airport On February 16, 2020 more than 100 flights were disrupted when their departure and check-
Disruption in systems were hit by “glitches.” This was fixed by the next day.
Google Plus Security A vulnerability in the Google+ social network exposed the private information of nearly
Glitch 500,000 people using the social network between 2015 and March 2018. The major part of
the problem was a specific API that could be used to gain access to non-public information.
The software glitch allowed outside developers to see the name, email address, employment
status, gender, and age of network users. The error had been discovered in March 2018 and
rectified immediately.
The interesting part is — Google did not share information about the bug in Google+ at first,
trying not to get into the limelight of the Cambridge Analytica scandal and become noticed by
Page 17 of 46CISQ Consortium for Information & Software Quality I The Cost of Poor Software Quality in the US: A 2020 Report
regulators. Google said they had no evidence of data misuse but also cannot say there was
none. In any case, the tech backlash ended sadly for Google+ – the consumer version of the
network was shut down shortly afterward.
Facebook’s User In late 2018, Facebook, whose ability to handle private information had already been
Data-Leak questioned, confirmed that nearly 50 million accounts could be at risk. Hackers exploited a
vulnerability in the system that allowed them to gain access to accounts and possibly to the
personal information of Facebook users. There were three software flaws in the network’s
systems that allowed hackers to access user accounts, including founder Mark Zuckerberg’s.
The hackers likely exploited a vulnerability in the “View as” code, the function that allows
checking how a profile looks as seen by other people. This, in turn, resulted in the acquiring of
authentication tokens. 90 million users were logged out of their accounts the day the
vulnerability was discovered. An additional 40 million accounts were logged out as a
preventative measure. Over 540 million records on Facebook users were eventually exposed
to Amazon cloud servers.
Sacramento Bee In February 2018, as many as 19.5 million records were breached from two databases owned
Records Breach and operated by The Sacramento Bee, a daily newspaper published in Sacramento, California.
These IT assets comprised California voter registration data that was provided by California's
Secretary of State. It also included the stored contact information of the subscriber base for
the newspaper. The attacker demanded a ransom for releasing this data to the organization.
Ultimately, the newspaper deleted the database to avoid any further risks and attacks. The
costs to restore it were not revealed.
Ransomware attacks have been one of the most prominent kinds of attacks on all segments of
organizations in recent history. These risks are increasing, reinforcing the need for robust
cybersecurity and data safeguarding measures.
Ticketfly Gets In May 2018, Ticketfly confronted an attack that vandalized its concert and sporting-event
Vandalized ticketing website. This resulted in total disruption almost for a week when the website had to
be taken down. Apparently, the hacker had alerted Ticketfly about a vulnerability and had
asked for a ransom to get it fixed. Eventually, when the company refused, the website was
hijacked, and the homepage was replaced with customer and employee data. The sensitive
data included names, addresses, email addresses, and even phone numbers of as many as 27
million Ticketfly account holders.
Equifax Data The Equifax breakdown has been one of the most prominent data breaches where sensitive
Breakdown information on millions of Americans was exposed. It included passport details, driver’s
license details, social security numbers, and much more. This affected the data of over 146
million consumers. The disclosure was made by the Securities and Exchange Commission and
given to congressional committees who were investigating the breach. As noted in a CSO
Online article on the biggest data breach fines, penalties and settlements, in 2020, Equifax was
made to pay further settlements relating to the breach: $7.75 million (plus $2 million in legal
fees) to financial institutions in the US plus $18.2 million and $19.5 million to the states
of Massachusetts and Indiana, respectively.
Page 18 of 46CISQ Consortium for Information & Software Quality I The Cost of Poor Software Quality in the US: A 2020 Report
British Airways glitch On August 7, 2019, over one hundred British Airways flights were cancelled and near to three
hundred flights delayed. During the busiest month for air travel, their computer system went
down completely. Thousands of passengers had to stay behind and wait long hours in packed
airports. The check-in procedures had to be switched to manual which made the queues start
to resemble Dante’s “Inferno.” This was not the first time the system screwed up. The pattern
of software failures over the last couple of years suggests poor computer management and
calls for concern. Investors are worked up because the financial risk with such issues is high.
Ticketmaster data The UK Information Commissioner’s Office fined Ticketmaster UK Ltd. £1.25 million ($1.6
breach million) for a 2018 data breach that potentially exposed information from more than 9 million
customers in Europe, BBC reports. Hackers accessed payment card details from Ticketmaster
customers through a chatbot operated by a third-party supplier. Ticketmaster took nine weeks
to start monitoring fraud on its website after it received alerts about possible fraud.
Investigators said 60,000 payment cards from Barclays Bank customers were subject to fraud
as a result of the breach. The regulator said Ticketmaster violated Europe’s General Data
Protection Regulation by failing to assess the risks of using the chatbot on its payment page
and the company did not use appropriate security measures or identify the breach fast
enough.
The Boeing 737-Max Although this situation was not exactly a classic software failure, it is still instructive to view
MCAS System how the software was misused within the larger context of overall system failure.
According to a well-regarded 737 pilot, “everything about the design and manufacture of the
Max was done to preserve the myth that ‘it’s just a 737.’ Re-certifying it as a new aircraft
would have taken years and millions of dollars.” The problems with the 737 Max emerged
after the Lion Air crash on October 29, 2018. Two planes crashed and 346 died, causing Boeing
stock to lose $28 billion in one week.
In the 737 Max, everything is monitored, if not directly controlled, by computers. From a
technical perspective, Boeing produced a dynamically unstable airframe. Boeing then tried to
mask the plane’s dynamic instability with a new software system, MCAS. MCAS relied on other
systems known for their propensity to fail (angle-of-attack indicators) and did not appear to
include even rudimentary provisions to cross-check the outputs of the angle-of-attack sensor
against other sensors, or even another angle-of-attack sensor. MCAS took complete control of
the plane away from the pilots. Pilots were also not trained on how to disable the MCAS
system. MCAS software was not well designed, implemented, or tested by knowledgeable
system engineers.
In reaction to the crashes and the FAA examining the plane’s certification process, the 737
Max was grounded in the US and has not flown commercially since then. The company
suspended production of the 737 Max in January 2020. Additional software flaws were found
in February 2020. Since then, Boeing rolled out a set of software updates to the 737 Max flight
control system. These updates include additional layers of protection and additional
redundancy and safety capabilities. In August, the FAA said Boeing's software changes and
other design changes are acceptable if instituted and inspected fully.
As of March 2020, the cost of the Boeing 737 Max crisis was estimated at $18.7 billion and
counting. This includes $8.3 billion in compensation to the company's airline customers, and
$6.3 billion in increased costs to build the jet. That price tag could go significantly higher.
Financial analysts estimate it will be about $23 billion, excluding liability for loss of life and
interest expenses. Nor do the estimates include the cost of litigation - not just the suits filed
Page 19 of 46You can also read