The Effectiveness of a Neighbor-to-Neighbor Get-Out-the-Vote Program: Evidence from the 2017 Virginia State Elections
←
→
Page content transcription
If your browser does not render page correctly, please read the page content below
Journal of Experimental Political Science (2021), 8, 145–160
        doi:10.1017/XPS.2020.11

        RESEARCH ARTICLE

        The Effectiveness of a Neighbor-to-Neighbor
        Get-Out-the-Vote Program: Evidence from the
        2017 Virginia State Elections
        Cassandra Handan-Nader1,* , Daniel E. Ho1,2, Alison Morantz2 and Tom A. Rutter3
        1
         Department of Political Science, Stanford University, Stanford, CA, USA, 2Stanford Law School, Stanford,
        CA, USA, Twitter: @DanHo1 and 3Department of Economics, London School of Economics, London, UK
        *Corresponding author. Email: slnader@stanford.edu

            Abstract
            We analyze the results of a neighbor-to-neighbor, grassroots get-out-the-vote (GOTV)
            drive in Virginia, in which unpaid volunteers were encouraged to contact at least three
            nearby registered voters who were likely co-partisans yet relatively unlikely to vote in
            the 2017 state election. To measure the campaign’s effectiveness, we used a pairwise ran-
            domization design whereby each volunteer was assigned to one randomly selected member
            of the most geographically proximate pair of voters. Because some volunteers unexpectedly
            signed up to participate outside their home districts, we analyze the volunteers who
            adhered to the original hyper-local program design separately from those who did not.
            We find that the volunteers in the original program design drove a statistically significant
            2.3% increase in turnout, which was concentrated in the first voter pair assigned to each
            volunteer. We discuss implications for the study and design of future GOTV efforts.

        Keywords: Voter turnout; local elections; neighbor-to-neighbor canvassing; localism

        In many representative democracies, increasing voter turnout is viewed as a desir-
        able public policy goal. If voter turnout is low, politicians may fail to adequately
        represent the interests of the electorate. The problem of chronically low voter turn-
        out is particularly acute in the USA, where only 55.7% of the voting-age population
        cast ballots in the 2016 presidential election (DeSilver 2017). Turnout in off-year
        and local elections is typically well under 40% (DeSilver 2014).

           The design of the randomized controlled trial reported herein was developed by D.E.H. and A.M. as
        unpaid consultants, working in their personal capacity, and by C.H. and T.A.R. in their consulting capacity,
        independent of Plus3. For full disclosure, A.M. is the spouse of the founder of Plus3, but the evaluation was
        structured to be independent. The authors otherwise declare no conflicts of interest related to the research
        described in this paper. We are grateful to David Nickerson, Donald Green and Aaron Strauss for their
        helpful comments and suggestions. We are also grateful to Plus3 for their willingness to collaborate.
        The data, code, and any additional materials required to replicate all analyses in this article are available
        at the Journal of Experimental Political Science Dataverse within the Harvard Dataverse Network, at:
        https://doi.org/10.7910/DVN/QPRZD4. All errors remain our own.
        © The Author(s), 2021. Published by Cambridge University Press on behalf of The Experimental Research Section of the
        American Political Science Association

Downloaded from https://www.cambridge.org/core. Stanford Libraries, on 12 Oct 2021 at 23:29:00, subject to the Cambridge Core terms of use
, available at https://www.cambridge.org/core/terms. https://doi.org/10.1017/XPS.2020.11
146 C. Handan-Nader et al.
A widely investigated aspect of get-out-the-vote (GOTV) campaigns has been the
method of contact (Bedolla and Michelson 2012; Gerber and Green 2017; Green and
Gerber 2015). A consistent finding of this literature is that “the more personal the
interaction between [the] campaign and [the] potential voter, the more it raises a
person’s chances of voting” (Green and Gerber 2015, p. 10). Meta-analyses have
consistently shown that in-person canvassing is the most robust and efficacious
method of increasing turnout. With a few noteworthy exceptions (Gerber et al.
2008), campaigns that rely on other forms of contact – such as phone, direct mail,
email, texts, and social media – have had much smaller effects.
Less investigated has been the relationship between the volunteers who partici-
pate in these campaigns and the voters they target – the “who” rather than the
“what” of GOTV. Yet a related strand of research on social pressure in voting sug-
gests that the relationship between the campaign representative and the voter may
matter a great deal. This literature has shown that many voters are sensitive to social
pressure exerted – even if only tacitly or implicitly – by peers, family, and neighbors.
For example, mailings promising to publicize to a voter’s neighbors whether (s)he
casts a ballot in an upcoming election are remarkably effective in stimulating turn-
out (Gerber et al. 2008), and several studies suggest that increasing a voter’s likeli-
hood of voting also increases the odds that his/her close friends and family will cast
ballots (Bhatti et al. 2017; Bond et al. 2012; Nickerson 2008). More tellingly, can-
vassers seem to be more effective when they interact with voters who reside in the
same zip code (Sinclair et al. 2013).
In addition to this GOTV literature, there is a substantial literature in political
science concerning interpersonal discussion of politics within close networks such as
with family, close friends, and neighbors. Lake and Huckfeldt (1998) and McClurg
(2003) analyzed survey data and found that having a large and politicized social
network was correlated with higher levels of political participation. Klofstad (2009,
2010, 2015) used random assignment of students to college dormitories to show that
part of this correlation in fact reflects a causal pathway from engagement in civic talk
to civic participation and that political discussion with college neighbors increases an
individual’s level of political participation even several years after graduation.
We analyze data from a novel GOTV campaign uniquely positioned to test the
efficacy of a design based on volunteer–voter relationships. The Plus3 campaign was
conducted in Virginia during the three months leading up to the 2017 state election,
in which the governor, lieutenant governor, attorney general, and all 100 House of
Delegates seats were on the ballot (see Appendix 4 for more details on the campaign
(Supplementary Material)). The program combined three unique elements: (1)
volunteers were responsible for turning out three specific voters (with the option
of requesting more later on); (2) volunteers could make varied and repeated
attempts over time to reach each voter, instead of just a single attempt at contact;
and (3) voters were selected for close geographic proximity to volunteers and were
therefore more likely to be perceived as “neighbors.”
Only a subset of districts in Virginia contained enough interested local activists to
field the program. Volunteers who resided in these districts were assigned to contact
a minimum of three voters who were on average 0.32 miles away from their homes,
in keeping with the original design of the program. Our primary analysis focuses on
these volunteers, since they participated in the program as originally designed. Due
Downloaded from https://www.cambridge.org/core. Stanford Libraries, on 12 Oct 2021 at 23:29:00, subject to the Cambridge Core terms of use
, available at https://www.cambridge.org/core/terms. https://doi.org/10.1017/XPS.2020.11The Effectiveness of a Neighbor-to-Neighbor Get-Out-the-Vote Program 147
to the unexpectedly high interest generated by this particular election, however,
Plus3 made an accommodation shortly before the election to assign volunteers
residing outside of participating districts (and at times outside of the state) to
the nearest available voters in participating districts. We analyze the efforts of these
volunteers separately as an alternate GOTV program that engaged different types of
volunteers, targeted different voters, and involved different methods of contact.
Because participation in these two programs was not randomly assigned, we cannot
interpret differences between the two programs in a causal fashion, but we report
both results for completeness.
We find that the volunteers who participated in the original Plus3 design (“origi-
nal”) drove a statistically significant 2.3% increase in voter turnout. The volunteers
in the alternate design (“alternate”) had no substantive or significant impact on
voter turnout. To analyze the most novel aspect of the Plus3 design, which was pro-
viding volunteers with a shortlist of three geographically proximate voters, we
decompose the treatment effect for original volunteers by the order in which the
voters were assigned to them. Even though the original volunteers’ (self-reported)
behavior toward the first three voters was largely uniform, the volunteers were able
to drive the largest increase in turnout among their first assigned voter. Volunteers
may have been most successful with their first assigned voter for a variety of reasons,
including that the voter was on average the most geographically proximate to the
volunteer and also the most salient (listed first on the assignment sheet). We discuss
implications for the design of future GOTV programs that seek to leverage hyper-
localism with a small number of assigned voters.
Our paper proceeds as follows. The Design, Data and Methods section discusses
the data, randomization procedure, and empirical strategy used to assess the efficacy
of each program design. The Results section presents the empirical results. The
Discussion section discusses implications for the study and design of future
GOTV efforts.
Design, data, and methods
Data
Our primary data come from Catalist, a purveyor of data on voting-age individuals
in the USA. The Catalist data include information on each voter’s name; street and
mailing address; phone number (populated in about 65% of cases); email address
(populated in about 20% of cases); gender; race; age; voting “propensity” score
(ranging from 0 to 100) indicating the probability that the voter will turn out in
an election given his/her past voting history and demographic characteristics;
and “partisanship” score (also ranging from 0 to 100) indicating the probability that
the individual is a Democrat.1 Due to concerns about the quality of the data available
for unregistered individuals, only registered voters were included in the program.
For each of the 27 House of Delegates districts with participating volunteer groups
(shaded in color in Figure 1), data were obtained on all registered voters who were
likely Democrats (with partisanship scores ranging from about 60 to 100) yet
1
The final field is important because Virginia is one of several states in which voters do not register party
affiliation.
Downloaded from https://www.cambridge.org/core. Stanford Libraries, on 12 Oct 2021 at 23:29:00, subject to the Cambridge Core terms of use
, available at https://www.cambridge.org/core/terms. https://doi.org/10.1017/XPS.2020.11148 C. Handan-Nader et al.
Proportion of voters with hyper-local volunteer
(0,0.25] (0.25,0.5] (0.5,0.75] (0.75,1]
Figure 1
Participating districts in Virginia. NOTES: This figure shows participating districts in Virginia shaded in
color by the proportion of voters with a home-district volunteer. Districts not participating are shown
in lightest shade.
relatively unlikely to vote in the November election (with propensity scores typically
ranging from 11 to 60).2
The volunteer program was run entirely by the partner organization Plus3, which
designed and presented the program at monthly meetings held by various progres-
sive and Democratic party organizations in Virginia. During each meeting, Plus3
leaders explained that after the election, academic researchers would use the data
collected on volunteers’ outreach efforts and voter turnout to analyze the effective-
ness of the program. The principal investigators (PIs) were not involved in running
the volunteer program, and volunteers were given no financial incentives for their
participation. Volunteers were offered an opportunity to register for the program in
one of two ways: either by writing their name, address, email, and phone number by
hand on a sheet of paper, or by signing up online through the Plus3 website. In both
scenarios, consent to the use of volunteer information for the running of the pro-
gram and its evaluation was obtained.
In total, 1,009 volunteers participated in the campaign. Each volunteer signed up to
participate in at least one of the 27 districts.3 Because of the large amount of interest
generated by the election, Plus3 adjusted at the last minute to field two separate
GOTV programs to accommodate the participation of as many volunteers as possible.
72% of volunteers signed up at least once within their district of residence in keeping
with the original design of Plus3,4 while the remaining volunteers participated in a
2
These ranges varied slightly between districts. More details on the inclusion criteria for each district are
presented in Appendix 4.
3
Most volunteers signed up for only one district – only six volunteers signed up for multiple districts.
A small percentage of volunteers (4%) signed up for the program more than once through multiple
accounts. We merged their accounts based on matching first name, last name, and home address.
4
Two of these volunteers participated both in their home district and in another district.
Downloaded from https://www.cambridge.org/core. Stanford Libraries, on 12 Oct 2021 at 23:29:00, subject to the Cambridge Core terms of use
, available at https://www.cambridge.org/core/terms. https://doi.org/10.1017/XPS.2020.11The Effectiveness of a Neighbor-to-Neighbor Get-Out-the-Vote Program 149
district not their own as an alternate accommodation. Most (87%) of the alternate
volunteers were forced to participate outside their home district because they lived
within a district in which not enough local activists were available to field the pro-
gram. The remaining alternate volunteers lived either within the region but outside
of the state of Virginia (7%), or within a participating district but voluntarily chose a
different district (6%). Because district participation depended on the level of ex ante
interest in the program among grassroots activists, the demographic composition of
participating districts was different from that of non-participating districts. For exam-
ple, participating districts tended to have higher population densities than non-par-
ticipating districts. Figure 1 shows the proportion of voters that were assigned to a
volunteer in the original program by district.
Beginning in mid-September of 2017 until the election in early November, each
Plus3 volunteer was sent the names and contact information for the three closest
voters meeting the inclusion criteria for the relevant district through an online sys-
tem. Contact information included street addresses and, where available, phone
numbers and email addresses. The volunteer was then encouraged to contact these
voters in whatever way(s) he or she preferred – such as by mail, by phone, through
social media, and/or in person – to highlight the importance of the upcoming elec-
tion and encourage the voter to cast a ballot. Any volunteer who wished to contact
more than three voters was permitted to do so through the online system but first
had to fill out a Voter Contact Summary Form (VCSF) summarizing the progress
(s)he had made in contacting the voters to whom (s)he had previously been
assigned. Appendix 5 provides the survey instrument in detail. Volunteers who
did not wish to contact more than three voters were also encouraged to fill out
the VCSF summarizing their progress. 76% of volunteers did not request more than
their three initially assigned pairs. The median number of voters requested by both
sets of volunteers was 3, and the average was 4.84 voters for original-design volun-
teers and 5.46 voters for alternate-design volunteers.
The VCSF was comprehensive, reflecting all voters to whom a volunteer had
been assigned, and dynamic in the sense that it could also be updated at any time.
The descriptive information on methods of contact used by volunteers was gleaned
from the final version of the VCSF submitted by each active Plus3 volunteer.5
Volunteer attrition was relatively high: Roughly, one-third (34%) of volunteers
never opened their voter assignments. Volunteer attrition also varied significantly
by program: 31% of volunteers in the original design never opened their voter
assignments, compared to 44% of volunteers in the alternate design. While we
did not collect individual-level demographics on volunteers, a comparison of
imputed gender and race using volunteer names and counties suggests that volun-
teers who did not open their assignments were not statistically different on these
demographics from volunteers who did.6 As discussed in the analysis section, this
high rate of volunteer attrition decreases statistical power but does not bias the
5
Volunteers had until the end of November to finish documenting their efforts during the pre-election
period.
6
We used the Bayesian method proposed in Imai and Khanna (2016) to infer ethnicity, and the method
proposed in Blevins and Mullen (2015) to infer gender. 1.7% of volunteers could not be assigned a gender
through this method.
Downloaded from https://www.cambridge.org/core. Stanford Libraries, on 12 Oct 2021 at 23:29:00, subject to the Cambridge Core terms of use
, available at https://www.cambridge.org/core/terms. https://doi.org/10.1017/XPS.2020.11150 C. Handan-Nader et al.
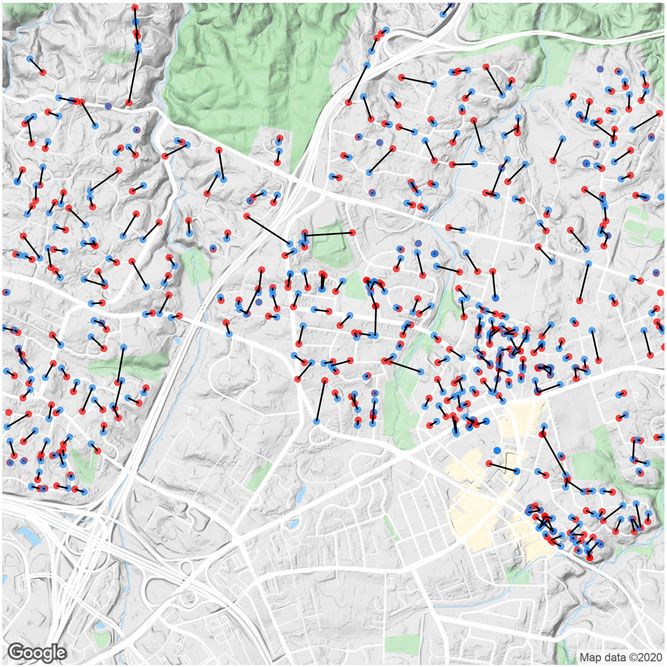
Figure 2
Example of treatment–control pairs of voters.
Notes: In this figure, red dots indicate voters in the treatment group, blue dots indicate voters in the
control group, and the lines between dots designate a treatment–control pair of voters.
intent-to-treat effect, since we include all randomized voter pairs in the analysis
regardless of whether their assigned volunteers made contact with the treated voter.
Randomization Scheme
We conducted a pairwise randomization of eligible voters into our treatment and
control groups. In light of research suggesting that voting behavior is subject to
within-household spillover effects, which can be as large as 30%–60% (Bhatti
et al. 2017; Nickerson 2008), we included only one eligible voter from each house-
hold in the sample frame (Rubin 1980).
To implement the pairwise randomization design, we first geocoded the house-
hold of each volunteer and voter and then used the Blossom V algorithm
(Kolmogorov 2009) to calculate the optimal set of voter pairs (from among all qual-
ifying voters in each district) that minimized the average within-pair geographic
distance. Figure 2 illustrates the results of this process by displaying the set of paired
voters for one city. For each pair, we then (1) calculated the latitude and longitude of
the midpoint between the two voters’ street addresses; (2) randomly assigned one
voter to the treatment condition, rendering him/her eligible for assignment to a vol-
unteer; and (3) assigned the other voter to the control condition, precluding him/her
from assignment to any Plus3 volunteer. Finally, each volunteer was allocated the
Downloaded from https://www.cambridge.org/core. Stanford Libraries, on 12 Oct 2021 at 23:29:00, subject to the Cambridge Core terms of use
, available at https://www.cambridge.org/core/terms. https://doi.org/10.1017/XPS.2020.11The Effectiveness of a Neighbor-to-Neighbor Get-Out-the-Vote Program 151
treated member of a physically proximate voter pair within their chosen House of
Delegates district, identified by minimizing the global geographic distance between
all volunteers’ home addresses and the midpoint of the voter pairs’ respective
addresses within each district. We used the midpoint to preserve balance on dis-
tance to the volunteer between treated and control voters.
This assignment process was carried out using the Hungarian Algorithm (Kuhn
1955). Since the optimization problem was global within each district, taking distances
between all volunteer–voter pairs into account, the first voter assigned to a volunteer
was not always strictly closer than the second voter assigned (though this was the case
for 70% of original-design volunteers). We explore this aspect of the optimization in
more detail in Appendix 8. Volunteers could ask for more pairs dynamically through-
out the course of the program, in which case they would receive their closest geo-
graphic match out of the remaining unassigned pairs. In this way, the volunteers
were assigned 5,068 pairs of voters throughout the course of the program.
After randomization and assignment, while we had excluded the same household
from appearing as a treatment–control pair, we discovered that 3% of volunteer-pair
matches assigned a volunteer to a household member (or in rare instances them-
selves). To simplify interpretation of treatment effects, especially with regard to
spillovers, we drop all volunteer–voter pairs in which the volunteers were assigned
to a pair including themselves or a household member. This left us with 4,914 voter
pairs. In Appendix 6, we report weaker results using all voter pairs, likely due to
spillover effects.
Hypotheses
Our primary goal was to evaluate the Plus3 program as originally designed. Because
the alternate design was a last-minute addition to the program, we also evaluate this
effort separately, but we did not form hypotheses ahead of time for this group.
We conducted our evaluation of the program based on the most novel feature of
the original design, which was the shortlist of proximal voters. In particular, we
investigated two specific quantities.
1. The overall effect on voter turnout. We expect this effect to be positive.
2. The effect on voter turnout for each voter pair on the shortlist. We expect the
effect to be decreasing in the order in which the voters were assigned, in keep-
ing with the design principle that volunteers would be most effective with a
smaller number of voters in close proximity to them.
Empirical Strategy
Due to the fundamental differences in volunteers, targeted voters, and tactics
between the original design and the alternate design, we analyzed voter pairs in
two mutually exclusive groups – those assigned to the original program, in which
volunteers engaged primarily with their neighbors and those assigned to the alter-
nate program, in which out-of-district volunteers (residing within Virginia,
Maryland, West Virginia, or DC) contacted voters in particpating districts often
Downloaded from https://www.cambridge.org/core. Stanford Libraries, on 12 Oct 2021 at 23:29:00, subject to the Cambridge Core terms of use
, available at https://www.cambridge.org/core/terms. https://doi.org/10.1017/XPS.2020.11152 C. Handan-Nader et al.
Table 1
Covariate Balance Between Voters in the Treatment and Control Conditions
Original design Alternate design
Covariates Control Treatment p Control Treatment p
Asian 0.04 (0.00) 0.04 (0.00) 0.95 0.06 (0.01) 0.06 (0.01) 0.72
Black 0.17 (0.01) 0.18 (0.01) 0.75 0.36 (0.01) 0.35 (0.01) 0.72
Hispanic 0.07 (0.00) 0.07 (0.00) 0.75 0.07 (0.01) 0.07 (0.01) 0.72
Male 0.37 (0.01) 0.36 (0.01) 0.75 0.37 (0.01) 0.37 (0.01) 1.00
Partisanship score 75.94 (0.20) 76.33 (0.20) 0.75 78.47 (0.29) 78.85 (0.29) 0.72
Under 30 0.23 (0.01) 0.24 (0.01) 0.75 0.25 (0.01) 0.25 (0.01) 0.72
Vote propensity score 29.96 (0.26) 29.78 (0.26) 0.75 27.89 (0.38) 28.90 (0.38) 0.44
Notes: In this table, the means of each variable are shown for voters assigned to each program, with standard errors given
in parentheses. p-values are adjusted for multiple testing using Benjamini and Hochberg (1995).
far from their own. Table 1 shows that, by virtue of the randomization, voter dem-
ographics were well balanced within each program. It is worth noting that the
communities – and in turn, the characteristics of voters – targeted by the Plus3
intervention differed between the two program designs. Overall, the original design
targeted significantly lower proportions of Black (18% vs. 35%) and Asian voters
(4% vs. 6%) than the alternate design. The original design also targeted voters with
slightly higher average vote propensity scores (29.87 vs. 28.39) and slightly lower
partisanship scores (76.14 vs. 78.66) than the alternate design. However, a compar-
ison of imputed gender and race using volunteer names and counties suggests that
the volunteers themselves were not statistically different between programs on gen-
der and race: about 75% were predicted to be female based on first name and about
91% were predicted to be White based on last name and county. Such differences
affect the comparability (and generalizability) of findings from the two program
designs, but not their internal validity given the uniformly excellent balance between
the treatment and control groups.
Our quantity of interest is the intention-to-treat (ITT) effect of a voter being
assigned to be contacted by a volunteer. This quantity is unbiased because it pre-
serves balance between paired voters yet is likely under-powered due to high vol-
unteer attrition. Because the treatment was randomized with equal probability
within pairs, we estimate the ITT effect as an average over within-pair differences
in turnout as shown in Equation 1.
1X J
1X J
τ̂pair Yj;t Yj;c ΔYj ; (1)
J j1 J j1
where Yj;t is the observed binary turnout indicator for the voter assigned to treat-
ment in pair j, and Yj;c is the turnout for the voter assigned to control in pair j.
This quantity and the conservative within-pair standard error can be obtained
through an ordinary least squares (OLS) regression of the within-pair differences
Downloaded from https://www.cambridge.org/core. Stanford Libraries, on 12 Oct 2021 at 23:29:00, subject to the Cambridge Core terms of use
, available at https://www.cambridge.org/core/terms. https://doi.org/10.1017/XPS.2020.11The Effectiveness of a Neighbor-to-Neighbor Get-Out-the-Vote Program 153
in turnout on a single intercept term (Athey and Imbens 2017; Imbens and Rubin
2015). To increase the precision of our estimates, we also present OLS estimates of
the ITT effect controlling for within-pair differences in the voter demographic con-
trols as shown in Equation 2, where ΔYj is the within-pair difference in turnout,
ΔXj represents a vector of within-pair differences in the control variables, and
the intercept term, τ, is our parameter of interest for the ITT.7 The model in
Equation 2 assumes an additive and linear function for the conditional expectation
of within-pair differences in turnout given within-pair differences in covariates
(Imbens and Rubin 2015). We present the ITT estimates separately for the voter
pairs assigned to volunteers under the original design and the voter pairs assigned
to volunteers under the alternate design.
0
ΔYj τ ΔXj β εj : (2)
To investigate the most novel feature of the original design, the shortlist of geo-
graphically proximate pairs, we also estimate conditional average intent-to-treat
effects by the order in which the pair was assigned to the volunteer. All volunteers
were initially assigned three voter pairs as part of the program, but volunteers were
free to request as many voter pairs as they liked throughout the program. Pairs were
assigned in an order that minimized the global distance between all volunteers and
their voter pairs, such that earlier assignments generally reflected closer distance to
the volunteer.8 We first estimate conditional average treatment effects as
the within-pair average difference in turnout for each assignment order group
k 2 f1; 2; 3; 4g by regressing the within-pair differences in turnout on indicators
for each assignment order group. To improve precision, we also estimate the model
including the vector ΔXj of within-pair differences in the control variables as shown
in Equation 3.
X 0
ΔYj τ k ΔXj β εj : (3)
k2f1;2;3;4g
Appendix 3 presents an alternative conditional logit specification, which pro-
vides directionally similar (though noisier) results.
Results
Table 2 presents our main findings. Model (1) shows that the unconditional ITT
estimate for the original design is positive at 2.2% but lacking in precision to reach
conventional levels of statistical significance (p 0:065). After adding in controls
to improve precision, we find that the original design increased turnout by
2.3% (p < 0:05). The alternate design saw neither substantively nor statistically sig-
nificant differences in turnout, with point estimates close to zero. We note, however,
7
Demographic controls include race, gender, age, and Catalist’s proprietary estimated partisanship and
vote propensity scores as shown in Table 1.
8
As mentioned before, distance was not always monotonically related to assignment order for volunteers
because of the global nature of the optimization. We also report results in Appendix 8 specifically for vol-
unteers for whom monotonicity in their assignments held.
Downloaded from https://www.cambridge.org/core. Stanford Libraries, on 12 Oct 2021 at 23:29:00, subject to the Cambridge Core terms of use
, available at https://www.cambridge.org/core/terms. https://doi.org/10.1017/XPS.2020.11154 C. Handan-Nader et al.
Table 2
OLS ITT Estimates
Original design Alternate design
(1) (2) (3) (4)
Intercept 0.022 (0.012) 0.023* (0.011) 0.005 (0.018) −0.004 (0.017)
Voter covariates N Y N Y
Pairs 3,364 3,364 1,550 1,550
Adjusted R 2
0.000 0.075 0.000 0.066
Notes: This table presents the within-pair OLS ITT estimates for voter pairs assigned to home-district volunteers only
(“original design”), and voters assigned to out-of-district volunteers only (“alternate design”). Robust standard errors
in parentheses. p-values are two-tailed. p < 0:05; p < 0:01; p < 0:001.
that a causal comparison between the two programs’ effectiveness cannot be made
due to the wide range of aforementioned demographic differences between the vot-
ers involved in each program.
Table 3 shows that, in addition to the fact that voter demographics differed
across the two programs, volunteers in the original design engaged in different
GOTV tactics than the volunteers in the alternate design.9 In particular, origi-
nal-design volunteers were less likely to send postcards and more likely to contact
their voters in person or by methods other than postcards, social media, email,
phone, or text. Alternate-design volunteers waited nearly 4 days longer on aver-
age to give status updates. They were also more likely to report their contact
efforts as “in progress,’’ and less likely to confirm that they had success in inter-
actions with their voters, by the end of the program. These tactical differences
evidence the difficulties of fostering more personal methods of contact in the
alternate design.
Table 4 shows that the conditional intent-to-treat effect for voters in the origi-
nal design was the largest and statistically significant only for the first assigned
pair (p < 0:01). By virtue of the assignment order, the first pair was the most
salient, and usually the closest, pair to the volunteer. In particular, Table 4 shows
that the ITT point estimate for the first pair was about three times the overall aver-
age ITT point estimate reported in Table 2. Although we cannot reject a Wald Test
for the joint equality of all conditional intent-to-treat effects (p 0:09), the effect
for the first pair is significantly different from the effect for the second pair
(p 0:01) and significantly different from the pooled effect for pairs 2–4
(p 0:04). Figure 3 presents the covariate-adjusted conditional average treatment
effects graphically to facilitate inspection. We do not see a monotonic relationship
between the conditional intent-to-treat point estimates and assignment order, as
we had initially expected. We caution as a matter of interpretation that, while the
9
We learned of these tactical differences through the volunteers’ VCSF submissions. 62% of treated voters
had a VCSF submitted (n 3; 047). There was no significant difference in submission rates between vol-
unteers in each design (p 0:82).
Downloaded from https://www.cambridge.org/core. Stanford Libraries, on 12 Oct 2021 at 23:29:00, subject to the Cambridge Core terms of use
, available at https://www.cambridge.org/core/terms. https://doi.org/10.1017/XPS.2020.11The Effectiveness of a Neighbor-to-Neighbor Get-Out-the-Vote Program 155
Table 3
Comparison of Volunteer Behavior in Original and Alternate Designs
Original design Alternate design
(treated voter n = 2090) (treated voter n = 957)
Contact methods (proportion of voters)
Postcard 0.66 0.84**
Social media 0.02 0.02
Email 0.07 0.06
Phone 0.12 0.17
In person 0.16 0.03***
Text 0.09 0.07
Other method 0.24 0.10**
Number of unique contact methods 1.36 1.29
Status updates
Days until first status update 29.84 33.53*
Total number of status updates 4.90 6.26
Proportion last status in progress 0.41 0.63*
Proportion last status success 0.12 0.03***
Notes: This table presents descriptive comparisons of volunteer behavior in the two programs toward treated voters,
based on submissions of the VCSF (response rate = 62%). Appendix 7 shows that there was demographic balance
between voters with updates and those without. Statistical significance is for a test of (unadjusted) differences in
means, with standard errors clustered on volunteer. p-values are adjusted for multiple testing using Benjamini and
Hochberg (1995). p < 0:05; p < 0:01; p < 0:001.
Table 4
OLS Conditional Average Intent-to-treat Estimates
Original design Alternate design
(1) (2) (3) (4)
Order 1 0.075** (0.026) 0.071** (0.026) 0.021 (0.042) 0.024 (0.041)
Order 2 −0.019 (0.026) −0.021 (0.024) −0.004 (0.043) −0.022 (0.042)
Order 3 0.025 (0.026) 0.030 (0.026) 0.050 (0.042) 0.026 (0.040)
Order 4 0.016 (0.019) 0.020 (0.018) −0.016 (0.026) −0.019 (0.025)
Voter covariates N Y N Y
Pairs 3,364 3,364 1,550 1,550
Adjusted R2 0.002 0.076 −0.001 0.065
Notes: This table presents OLS conditional average treatment effect estimates for voter pairs assigned to home-district
volunteers only (“original design”), and voters assigned to out-of-district volunteers only (“alternate design”). Robust
standard errors in parentheses. p-values are two-tailed. p < 0:05; p < 0:01; p < 0:001.
Downloaded from https://www.cambridge.org/core. Stanford Libraries, on 12 Oct 2021 at 23:29:00, subject to the Cambridge Core terms of use
, available at https://www.cambridge.org/core/terms. https://doi.org/10.1017/XPS.2020.11156 C. Handan-Nader et al.
0.10
0.05
CATE
0.00 −0.05
1 2 3 4+
Assignment order
Figure 3
Conditional average treatment effects (CATEs) with 95% confidence intervals.
population of volunteers remains relatively constant for the pairs in groups 1, 2,
and 3,10 the 4 group contains pairs assigned only to the volunteers who chose to
receive more than the minimum number of voter assignments.
Once more, we turned to the VCSF responses to see whether this pattern might
arise from volunteers exerting the most effort for the first pair and perhaps less
effort for subsequent pairs, or even due to demographic imbalances across pairs,
since pairs were assigned in an order that minimized global geographic distance.
For this analysis, we estimated the model in Equation 4:
Covariatej α γ 2 Order 2j γ 3 Order 3j γ 4 Order 4 j εj ; (4)
where Covariatej is the covariate for pair j shown in the rows of Table 5 and “Order
n” is a set of dummy variables taking on the value of 1 if pair j was assigned in order
n 2 f2; 3; 4g, and 0 otherwise. For covariates that were measured using the VCSF,
the sample is limited to treated voters from pair j for whom a volunteer submitted a
VCSF entry. Otherwise, the sample includes all pairs, and the covariate value is the
average value across voters in each pair. Table 5 displays the coefficients γ 2;3;4 in
the columns, which show the difference in means from the first assigned pair. Note
that, in contrast to Table 4, the population of volunteers does not remain largely
constant across orders 1–3 for the contact method and status update covariates,
since 19% of the volunteers who submitted updates did not submit updates for
all three of their assigned voters.
Table 5 suggests that volunteers behaved largely similarly toward their first three
assigned voters. However, the volunteers who requested more than the obligatory
three pairs may have exerted less effort for their subsequent pairs. It took original
volunteers an average of 11 days longer to give status updates on their progress for
voters in pairs 4 compared to the first pair (p < 0:001), and they gave slightly over
three fewer status updates on average for these voters compared to the first pair
10
The only exception is that pairs assigned to members of their own households are removed from the
analysis, so affected volunteers would only appear in groups 2, 3, and 4.
Downloaded from https://www.cambridge.org/core. Stanford Libraries, on 12 Oct 2021 at 23:29:00, subject to the Cambridge Core terms of use
, available at https://www.cambridge.org/core/terms. https://doi.org/10.1017/XPS.2020.11The Effectiveness of a Neighbor-to-Neighbor Get-Out-the-Vote Program 157
Table 5
Balance in Volunteer Behavior and Pair Demographics by Assignment Order
Original Alternate
Order 2 Order 3 Order 4 Order 2 Order 3 Order 4
Contact methods (proportion of voters)
Postcard 0.02 0.06 0.10 0.02 0.01 0.01
Social media 0.00 0.00 −0.02 −0.02 −0.02 −0.01
Email −0.02 −0.02 −0.02 −0.01 0.02 −0.00
Phone 0.00 −0.00 −0.04 −0.00 0.00 −0.06
In person 0.03 0.00 −0.07 −0.02 −0.02 −0.03
Text −0.01 −0.00 0.08 −0.02 −0.00 −0.00
Other method −0.05 −0.04 −0.08 −0.03 −0.00 −0.13
Method count −0.02 −0.00 −0.05 −0.07 −0.01 −0.22
Status updates
Days until first status update 0.67 0.74 11.08*** 0.77 0.58 12.89***
Total number of status updates −0.03 0.00 3.70* −0.04 −0.07 4.64
Proportion last status in progress 0.02 0.09** 0.27*** 0.04 −0.01 0.27
Proportion last status success 0.00 −0.05 −0.08* −0.00 −0.00 0.01
Pair distance from volunteer (mi) 0.04*** 0.09*** 0.30*** 0.37 0.38 3.87
Demographics (pair average)
Black 0.01 0.02 0.08*** 0.03 0.01 0.17***
Hispanic 0.01 0.00 0.01 0.00 −0.00 −0.01
Asian 0.01 0.01 0.01 −0.02 −0.01 −0.02
Male 0.00 0.01 −0.00 −0.03 −0.03 −0.07
Under 30 −0.01 0.02 0.00 0.03 0.01 0.04
Vote propensity −0.87 −0.97 −1.38 2.07 1.71 0.11
Partisanship −0.34 0.08 0.32 −0.45 0.72 2.19*
Note: This table presents balance for pairs on volunteer behavior and voter demographics by assignment order. The
sample for the volunteer behavior covariates is limited to treated voters for whom the volunteer filled out a VCSF,
while the distance and demographic comparisons use all pairs. Values in the table are the coefficients 2;3;4 in
Equation 4, which represent differences in means between the assigned order and order 1. Standard errors for VCSF
responses and volunteer–voter distance are clustered on volunteer. p-values are two-tailed and adjusted for multiple
testing using Benjamini and Hochberg (1995). p < 0:05; p < 0:01; p < 0:001.
(p < 0:05). Similar patterns exist for the alternate volunteers. Original volunteers
were also significantly more likely to report that they were still working on contact-
ing their voters assigned third and later (last status “in progress”) compared to their
first assigned voter (p < 0:01) and less likely to report success for their fourth and
later pairs (p < 0:05). However, there were no significant differences in reported
tactics between the first and second voter pairs. We note that these are self-reported
Downloaded from https://www.cambridge.org/core. Stanford Libraries, on 12 Oct 2021 at 23:29:00, subject to the Cambridge Core terms of use
, available at https://www.cambridge.org/core/terms. https://doi.org/10.1017/XPS.2020.11158 C. Handan-Nader et al.
methods of contact, but there is no obvious reason to infer that self-reporting should
differ between assigned pairs. Demographic covariates were also relatively well bal-
anced across assignment order, though pairs assigned fourth and later were more
likely to include Black voters than the first assigned pair for both original- and alter-
nate-design volunteers (p < 0:001.
As expected for the original-design volunteers, the strongest differentiation
between the assigned pairs was distance from the volunteer to the pair. On average,
pair 2 was 0.04 miles farther from the volunteer compared to pair 1 (p < 0:001), pair
3 was 0.09 miles farther than pair 1 (p < 0:001, and all subsequent pairs were on
average 0.30 miles farther than pair 1 (p < 0:001). Although this strong monotonicity
did not hold for each individual volunteer, the aggregate patterns are suggestive of a
relationship between proximity and effectiveness. In particular, the fact that behavior
choices in the aggregate remained largely consistent across the first three voters, but
that distance varied significantly, suggests that the effectiveness of the same GOTV
tactics can change substantially alongside small changes in distance from the volun-
teer to the voter. However, it is important to note that the assignment order mecha-
nism was more than simply a function of volunteer–voter distance. Volunteers were
assigned their first three pairs simultaneously with other volunteers in their district
who signed up for the program at the same time, and given the most proximate voter
pair in a way that minimized the distance across all concurrent voter–volunteer
matches. Consequently, assignment order is not solely a reflection of volunteer–voter
distance. Other factors, such as the salience of the first position on the assignment list,
may have contributed to the stronger effect observed within the first assigned pair.
Discussion
The GOTV program analyzed in this study was just one of several grassroots organ-
izations conducting numerous GOTV activities alongside campaign workers and
party operatives. What distinguished the program from its peers, and from pro-
grams analyzed in prior literature, was the confluence of three factors: the fact that
volunteers were assigned no more than three voters at a time; that they were encour-
aged to contact each voter repeatedly (and, if they wished, in different ways) over a
multi-week time frame; and that the volunteers and voters were so geographically
proximate that they would likely perceive one another as “neighbors.” We find that
the volunteers who adhered to the original program design were able to generate a
2.3% increase in turnout, and volunteers in the alternate design were not able to
meaningfully influence turnout. The fact that the original program effect was con-
centrated in the first, and usually most proximate, assigned voter pair may suggest
that the shortlist of a small number of proximate voters was an important design
feature shaping the effectiveness of the volunteers’ efforts.
There are some limitations to this study which could be improved upon by sub-
sequent work. The Virginia 2017 election was an off-year election, with unusually
high turnout, so external validity cannot be assumed. It is difficult to interpret the
difference in effectiveness between the original and alternate arms of the program
for several reasons. First, since the participating districts were not randomly
assigned, original-design volunteers may have had characteristics that made them
better canvassers independent of the effect of being perceived as a “neighbor.”
Downloaded from https://www.cambridge.org/core. Stanford Libraries, on 12 Oct 2021 at 23:29:00, subject to the Cambridge Core terms of use
, available at https://www.cambridge.org/core/terms. https://doi.org/10.1017/XPS.2020.11The Effectiveness of a Neighbor-to-Neighbor Get-Out-the-Vote Program 159
Because over 1,000 volunteers had to be coordinated in a highly decentralized fash-
ion, we could not collect detailed information on the volunteers themselves to assess
this possibility. Second, the characteristics of the voters canvassed differed between
the original and alternate treatment arms. Different groups of voters will vary on
how responsive they are to partisan persuasion to cast a ballot. Third, as shown
in Table 3, the canvassing methods used differed between original- and alter-
nate-design volunteers, with original-design volunteers far more likely to try to con-
tact their assigned voters in person. Prior evidence shows that personal contact is
more effective (Green and Gerber 2015), so the difference between the two arms
may stem from the different methods of voter contact. As was the theory by the
Plus3 group, localism may also facilitate more personal methods of contact.
Canvassers who are neighbors of potential voters may have more background
knowledge to engage with voters, which may constitute one of the advantages of
hyper-local canvassing. Finally, our survey instrument did not measure frequency
of contact beyond whether or not contact was made at all and which type of contact
the volunteer chose. It is possible that localism also fostered more frequent oppor-
tunities to contact voters, especially given the extended length of time volunteers
were given to engage with their assigned voters. Future studies may investigate this
further by measuring frequency as well as the personal intensity of contact.
Our results suggest that, in the aggregate, small increases in volunteer–voter dis-
tance (0.04 miles on average between the first and second assigned voter) can correlate
with less observed effectiveness in the same GOTV tactics. Future randomized studies
of GOTV efforts can more precisely measure the impact of volunteer–voter distance
as a mediating variable by randomizing the distance between volunteers and voters.
Yet the primary implication for the design of GOTV programs is that a trade-off exists
between high-impact activities and geographic reach. Volunteer efforts may be best
leveraged on only one voter who is their closest neighbor rather than across several
voters who are within their neighborhood or local area. Furthermore, the geographic
composition of the volunteer base might determine which voters can be mobilized to
the greatest extent, which has implications for the equity impacts and targeting capa-
bilities of GOTV programs. It would seem fitting that, true to the grassroots nature of
these campaigns, their impact stays close to the locales of volunteers.
Conflict of interests. For full disclosure, A.M. is the spouse of the founder of Plus3, but the evaluation was
structured to be independent. The authors otherwise declare no conflicts of interest related to the research
described in this paper.
Supplementary material. To view supplementary material for this article, please visit https://doi.org/
10.1017/XPS.2020.11
References
Athey, S. and G. W. Imbens. 2017. “The Econometrics of Randomized Experiments,” In Handbook of
Economic Field Experiments, eds. Banerjee A. V. and Duflo E., vol. 1 of Handbook of Field Experiments,
North-Holland, 73–140.
Bedolla, L. G. and M. R. Michelson. 2012. Mobilizing Inclusion: Transforming the Electorate through
Get-Out-the-Vote Campaigns. New Haven, CT: Yale University Press.
Benjamini, Y. and Y. Hochberg. 1995. “Controlling the False Discovery Rate: A Practical and Powerful
Approach to Multiple Testing,” Journal of the Royal Statistical Society. Series B (Methodological)
57(1): 289–300.
Downloaded from https://www.cambridge.org/core. Stanford Libraries, on 12 Oct 2021 at 23:29:00, subject to the Cambridge Core terms of use
, available at https://www.cambridge.org/core/terms. https://doi.org/10.1017/XPS.2020.11160 C. Handan-Nader et al.
Bhatti, Y., J. O. Dahlgaard, J. H. Hansen, and K. M. Hansen. 2017. “How voter mobilization from short
text messages travels within households and families: Evidence from two nationwide field experiments,”
Electoral Studies 50: 39–49.
Blevins, C. and L. A. Mullen. 2015. “Jane, John : : : Leslie? A historical method for algorithmic gender
prediction,” Digital Humanities Quarterly 9.
Bond, R. M., C. J. Fariss, J. J. Jones, A. D. I. Kramer, C. Marlow, J. E. Settle, and J. H. Fowler. 2012.
“A 61-million-person experiment in social influence and political mobilization,” Nature 489: 295–298.
DeSilver, D. 2014.“Voter turnout always drops off for midterm elections, but why?” Pew Research Center:
Fact Tank.
DeSilver, D. 2017. “U.S. trails most developed countries in voter turnout,” Pew Research Center: Fact Tank.
Gerber, A. S. and D. P. Green. 2017. “Field Experiments on Voter Mobilization: An Overview of a
Burgeoning Literature,” In Handbook of Economic Field Experiments, eds. A. V. Banerjee and Duflo
E., vol. 1 of Handbook of Field Experiments, North-Holland, 395–438.
Gerber, A. S., D. P. Green, and C. W. Larimer. 2008. “Social Pressure and Voter Turnout: Evidence from a
Large-Scale Field Experiment,” American Political Science Review 102: 33–48.
Green, D. P. and A. S. Gerber. 2015. Get Out the Vote: How to Increase Voter Turnout. Washington, DC:
Brookings Institution Press.
Handan-Nader, C., D. E. Ho, A. Morantz, and T. A. Rutter. 2020. “Replication Data for: The Effectiveness
of a Neighbor-to-Neighbor Get-Out-the-Vote Program: Evidence from the 2017 Virginia State
Elections,” doi: 10.7910/DVN/QPRZD4.
Imai, K. and K. Khanna. 2016. “Improving Ecological Inference by Predicting Individual Ethnicity from
Voter Registration Records,” Political Analysis 24: 263–272.
Imbens, G. W. and D. B. Rubin. 2015. Causal Inference in Statistics, Social, and Biomedical Sciences. New
York, NY: Cambridge University Press.
Klofstad, C. A. 2009. “Civic Talk and Civic Participation: The Moderating Effect of Individual
Predispositions,” American Politics Research 37: 856–878.
Klofstad, C. A. 2010. “The Lasting Effect of Civic Talk on Civic Participation: Evidence from a Panel Study,”
Social Forces 88: 2353–2375.
Klofstad, C. A. 2015. “Exposure to Political Discussion in College is Associated With Higher Rates of
Political Participation Over Time,” Political Communication 32: 292–309.
Kolmogorov, V. 2009. “Blossom V: a new implementation of a minimum cost perfect matching algorithm,”
Mathematical Programming Computation 1: 43–67.
Kuhn, H. W. 1955. “The Hungarian method for the assignment problem,” Naval Research Logistics
Quarterly 2: 83–97.
Lake, R. L. D. and R. Huckfeldt. 1998. “Social Capital, Social Networks, and Political Participation,”
Political Psychology 19: 567–584.
McClurg, S. D. 2003. “Social Networks and Political Participation: The Role of Social Interaction in
Explaining Political Participation,” Political Research Quarterly 56: 449–464.
Nickerson, D. W. 2008. “Is Voting Contagious? Evidence from Two Field Experiments,” The American
Political Science Review 102: 49–57.
Rubin, D. B. 1980. “Discussion of “Randomization Analysis of Experimental Data in the Fisher
Randomization Test” by Basu,” Journal of the American Statistical Association 75: 591–593.
Schneider, G. S., L. Vozzella, and F. Nirappil. 2017. “In the final sprint to Election Day, a historic push to
turn out voters in Va.” Washington Post.
Schwartzman, P. 2017. “Why a historically conservative county in Virginia is making national Republicans
nervous,” Washington Post.
Sinclair, B., M. McConnell, and M. R. Michelson. 2013. “Local Canvassing: The Efficacy of Grassroots
Voter Mobilization,” Political Communication 30: 42–57.
Cite this article: Handan-Nader C, Ho DE, Morantz A, and Rutter TA (2021). The Effectiveness of a
Neighbor-to-Neighbor Get-Out-the-Vote Program: Evidence from the 2017 Virginia State Elections.
Journal of Experimental Political Science 8, 145–160. https://doi.org/10.1017/XPS.2020.11
Downloaded from https://www.cambridge.org/core. Stanford Libraries, on 12 Oct 2021 at 23:29:00, subject to the Cambridge Core terms of use
, available at https://www.cambridge.org/core/terms. https://doi.org/10.1017/XPS.2020.11You can also read


