The Financial Crisis of 2015 - An Avoidable History - STATE OF THE FINANCIAL SERVICES INDUSTRY
←
→
Page content transcription
If your browser does not render page correctly, please read the page content below
STATE OF THE FINANCIAL SERVICES INDUSTRY | 2011

       The Financial Crisis of 2015
       An Avoidable History
John Banks was woken by his phone at 3am on Sunday, April 26, 2015. John worked for Garland Brothers, a formerly British bank that had relocated its headquarters to Singapore in late 2011 as a result of what Garland’s CEO had described as “irreconcilable differences” between the bank and the UK regulators. The last three years had been the most exciting of John’s life. Having led the bank’s aggressive expansion into emerging markets wholesale activities, he had recently been promoted to its executive committee. John picked up the phone. It was the bank’s legal counsel, Peter Thompson, calling. He had dramatic news. Garland Brothers, one of the world’s oldest banks, would declare bankruptcy tomorrow. As he lay there in his spacious air-conditioned bedroom, unable to return to sleep, John tried to reconstruct the events of the last four years. Planting the seeds of failure At the beginning of 2011, the global economy was showing signs of finding a “new normal”. With the exception of a few smaller troubled economies, the world had returned to positive growth, and Western stock markets had returned to their levels prior to the Lehman crisis. Banks had started lending to each other again, becoming gradually less reliant on central bank funding. Insurers had rebuilt their capital positions back to pre-crisis levels. Ireland had joined Greece in the list of peripheral Euro countries requiring a bailout, but there was a general sense that the broader contagion problems had been contained. New bank (Basel III) and insurance (Solvency II, in Europe) regulatory regimes had been introduced and were designed to avoid a repeat of the sub-prime crisis. Banks were phasing in the new tougher controls around capital, liquidity and leverage, albeit over a relatively relaxed timeframe. The Basel Committee’s impact study had estimated that the largest banks needed to raise a total of €577 BN to meet the new standards, and several banks came to market in 2011 with multi- billion Euro rights issues. Beneath this relatively calm surface, however, trouble was brewing. Stakeholders in financial services firms wanted lower risk, but shareholders were still demanding high returns. Executives felt their institutions were holding more capital than they needed, and they were struggling to find investment opportunities that satisfied their shareholders’ return requirements. Despite attempts by central banks to inject liquidity into the system, loan growth in Western economies had ground to a halt as consumers continued to deleverage and companies remained reluctant to invest, uncertain of the future interest rate, tax and regulatory environment. Copyright © 2011 Oliver Wyman 1
The ability of banks to generate fee income by re-packaging credit
books had been eliminated by punitive new securitization rules. New
consumer protection laws prevented the sale of complex derivatives to
many customers. Proprietary trading by banks had been outlawed in
many jurisdictions.

The talented and ambitious employees of Western banks found
themselves under-utilized in an industry that was starting to resemble
a utility. They needed to find new outlets for their creativity and drive.

Disappearing into the shadows
Talent began shifting into the shadow banking sector. During the
low interest rate environment of 2011, investors were desperate
for alternative investments with additional yield. Assets under
management in the shadow banking sector grew rapidly during 2011.
Asset managers were promising “inflation busting” returns but many
of the strategies were based on the short-term growth prospects of the
hottest markets and often employed leverage to maximize gains.

New types of specialist loan funds disintermediated the highly
regulated banking sector by matching borrowers and investors directly.
These funds tapped into the long-term liquidity pools of pension
funds and insurance companies. Their pitch books described such
investors as “advantaged holders of illiquid credit”. Lacking their own
distribution channels, these funds relied on outsourced origination,
either through banks or networks of “hungry” agents. Credit discipline
was poor. Even at this early stage, the pattern was familiar, but
regulators did not intervene. Because the asset flows were global
and did not have banks at their center, no single regulatory body
felt responsible.

Go East (or South) young man!
Other restless Western banks and bankers moved, not into the
shadows, but into the heat of emerging markets. In contrast to the
anti-banking sentiment growing in the West, many emerging markets
jurisdictions were still viewed as “banker friendly”. At the same time,
growth opportunities in emerging markets had already encouraged
some banks to base their growth strategies on these markets. In early
2011, several small international banks closed down their Western
wholesale subsidiaries and re-located them to Singapore or Hong
Kong. Garland Brothers was the first British bank to make the move,
giving up its UK base when it decided to relocate its headquarters to
Singapore in late 2011.

2                                              Copyright © 2011 Oliver Wyman
Western banks tackled the emerging markets in different ways. Those
that had already established deposit and customer bases in emerging
markets continued to grow organically, employing a well‑tested
and consistent set of risk standards across markets regardless of
regulatory inconsistencies. Other Western players, such as Garland
Brothers, that were struggling to find an edge, employed unorthodox
techniques to build a presence in the faster growing markets. Some
began to build large wholesale divisions in Asia and set up complex
legal entity structures to take advantage of inconsistencies across
regulatory regimes.

Sales of complex derivatives were once again producing a large
proportion of many banks’ income. Lacking an emerging markets
deposit franchise, many of these Western banks started to fund their
emerging markets lending activities via the wholesale markets or
by tapping domestic funding sources in the West. Problems in the
Eurozone meant that many European banks were paying 200-300bps
above LIBOR for funding back home, and there were few opportunities
in Europe to lend out such funds profitably. European banks found
that lending to emerging markets banks and governments was one
of the few ways of generating a positive margin over their rising cost
of funds. This was part of a general trend among Western banks of
moving down the credit spectrum to pick up yield.

Bubble creation
Based on favorable demographic trends and continued liberalization,
the growth story for emerging markets was accepted by almost
everyone. However, much of the economic activity in these markets
was buoyed by cheap money being pumped into the system by Western
central banks. Commodities prices had acted as a sponge to soak
up the excess global money supply, and commodities-rich emerging
economies such as Brazil and Russia were the main beneficiaries.

High commodities prices created strong incentives for these emerging
economies to launch expensive development projects to dig more
commodities out of the ground, creating a massive oversupply of
commodities relative to the demand coming from the real economy. In
the same way that over-valued property prices in the US had allowed
people to go on debt-fueled spending sprees, the governments of
commodities-rich economies started spending beyond their means.
They fell into the familiar trap of borrowing from foreign investors to
finance huge development projects justified by unrealistic valuations.
Western banks built up large and concentrated loan exposures in
these new and exciting growth markets.

Copyright © 2011 Oliver Wyman                                         3
The banking M&A market was turned on its head. Banks pursuing
high growth strategies, particularly those focussed on lending to the
booming commodities-rich economies, started to attract high market
valuations and shareholder praise. In the second half of 2012 some of
these banks made successful bids for some of the leading European
players that had been cut down to a digestible size by the new anti-
“too big to fail” regulations. The market was, once again, rewarding the
riskiest strategies. Stakeholders and commentators began pressing
risk-averse banks to mimic their bolder rivals.

The narrative driving the global commodities bubble assumed a
continuation of the increasing demand from China, which had become
the largest commodities importer in the world. Any rumors of a
slowing Chinese economy sent tremors through global markets. Much
now depended on continued demand growth in China and continued
appreciation of commodities prices.

The bubble bursts
Western central banks pumping cheap money into the financial
system was seen by many as having the dual purposes of kick-starting
Western economies and pressing China to appreciate its currency.
Strict capital controls initially enabled the Chinese authorities to resist
pressure on their currency. Yet the dramatic rises in commodities prices
resulting from loose Western monetary policies eventually caused
rampant inflation in China. China was forced to raise interest rates and
appreciate its currency to bring inflation under control. The Western
central banks had been granted their wish of an appreciating Chinese
currency but with the unwanted side effect of a slowing Chinese
economy and the reduction in global demand that came with it.

Once the Chinese economy began to slow, investors quickly realized
that the demand for commodities was unsustainable. Combined
with the massive oversupply that had built up during the boom, this
led to a collapse of commodities prices. Having borrowed to finance
expensive development projects, the commodities-rich countries in
Latin America and Africa and some of the world’s leading mining
companies were suddenly the focus of a new debt crisis. In the same
way that the sub-prime crisis led to a plethora of half-completed
real estate development projects in the US, Ireland and Spain,
the commodities crisis of 2013 left many expensive commodity
exploration projects unfinished.

4                                               Copyright © 2011 Oliver Wyman
Western banks and insurers did not escape the consequences of the
commodities crisis. Some, such as the Spanish banks, had built up
direct exposure by financing Latin American development projects.
Others, such as US insurers, had amassed indirect exposures through
investments in infrastructure funds and bank debt. Inflation pressure
in the US and UK during the commodities boom had forced the Bank
of England and Fed to push through a series of interest rate hikes that
forced many Western debtors that had been holding on since the sub-
prime crisis, to finally to default on their debts. With growth in both
developed and emerging markets suppressed, the world once again
fell into recession.

Judgement day for sovereigns
The final phase of the crisis saw the US, UK and European debt
mountains emerge as the ultimate source of global systemic risk.
Long-term sovereign yields had been gradually rising during the
last few years, but analysts had assumed that this was because of
increasing inflationary expectations. With the advent of the new
commodities lending crisis, rising sovereign yields were suddenly
being attributed to the deteriorating solvency of the sovereigns. Their
high debts, combined with increasing refinancing costs, made it
apparent that the debt burden of many developed world sovereigns
was unserviceable. It was judgement day for sovereigns.

Those sovereigns that were highly indebted and needed to roll over
large amounts of short-term debt were forced to either restructure
their debts or accept bailout money from other healthier sovereigns.
This period, which spanned 2013 to 2015, was the single biggest
rebalancing of economic and political power since World War II.

The final irony in the tale was that the large sovereign exposures that
the banking system had built up as a result of the new liquidity buffer
requirements left the banking system, once again, sitting on the edge
of the abyss.

Our unemployed protagonist
As John ran through these facts it became clear to him that not enough
had been learned from the sub-prime crisis. Bankers had gone chasing
the next rainbow only to find another pot of toxic waste rather than
a pot of gold. The new wave of regulations had proved ineffective
at stopping another bubble from forming. John was struggling to
understand what he should have done differently. Heads would
certainly roll. But who was really to blame this time around?

Copyright © 2011 Oliver Wyman                                             5
1. The purpose and structure of
this report

The sub-prime crisis of 2007 will not be the last financial sector crisis.
Even during the relative calm of the last 25 years, we witnessed the
property crises of the early 90s, the Asia currency crisis, the LTCM/
Russia crisis and a number of other smaller emerging markets-led
financial crises. We are due another crisis soon.

Financial services executives and regulators have worked hard to
design a safer and more stable financial system, but we will not know
whether they have succeeded until it is tested by the next crisis. The
first aim of our 2015 crisis scenario is to stress test the design of the
new financial system, to consider how well it would stand up to this
type of adverse scenario.

The broader aim of the report is to encourage readers to think about
the future financial system using several scenarios rather than basing
decisions on a single predicted course of events. Shell Oil, guided by
Arie de Geus1, was a pioneer in using scenario planning in the 1980s.
De Geus claimed that the main purpose of using scenarios was to
“think the unthinkable” and claimed that scenarios were “vastly
superior in dealing with the future than predictions”. Strategists who
focus on a single path of future events, he claimed, tend to filter out
news that does not fit their view of the world. Companies with a single
strategy or plan are “virtually blind” to new information.

Our scenario is not a prediction. Our aim in describing it is to show
that current efforts underway to create a better system should not
be taken as an assurance that the system is now safe from future
crises. Other plausible scenarios may show the same thing, though
potentially with different strategic implications. We encourage you to
use several such adverse scenarios in your planning, tailoring them to
the risks facing your institution.

The rest of this report is structured as follows. Section 2 presents
supporting evidence for our scenario, showing that it is not as unlikely
as we might hope. Then, in Section 3, we review some of the measures
regulators and financial institutions are taking to limit the probability
and severity of future crises and, based on lessons from our 2015
crisis scenario, we make some suggestions about what they could
do differently.

1   See The Living Company by Arie de Geus, Harvard Business Press, 1997

6                                                            Copyright © 2011 Oliver Wyman
2. How plausible is our 2015
crisis scenario?

In our scenario, the crisis has three principal drivers: the resurgence
of shadow banking, the formation of emerging market asset bubbles
and sovereign debt restructurings in developed markets. Below, we
consider the likelihood of these three events.

2.1. The resurgence of shadow banking

Definition of shadow banking
By “shadow banking” we refer to credit intermediation, maturity
transformation and liquidity transformation that takes place outside
of the deposit-taking institutions that have access to central bank
liquidity and whose depositors receive government guarantees
(or deposit insurance). Money market mutual funds, structured
investment vehicles, credit hedge funds, asset-backed commercial
paper conduits and securities lenders are all, therefore, parts of the
shadow banking system, though not the whole of it.

Since the 1980s, shadow banking has grown even more rapidly than
the official banking sector (see Exhibit 1). This growth has been caused
in part by the real economic advantages of some shadow banking
activities in matching the needs of investors and borrowers through
product innovation. However, it has also been driven by “regulatory
arbitrage”: that is, by the desire to hide leverage outside of the official
banking sector, especially to avoid regulatory capital requirements. As
can be seen in Exhibit 1, the liabilities of the shadow banking sector
dropped rapidly during the recent crisis, showing that the official
banking system was by comparison a safe place to keep your money.

Copyright © 2011 Oliver Wyman                                             7
Exhibit 1: Shadow Bank Liabilities vs. Traditional Bank Liabilities (US$ TN)
20

18

16

14

12

10

 8

 6

 4

 2

 0
     1945   1950   1955   1960   1965   1970   1975   1980   1985   1990    1995   2000   2005   2010

                                  Shadow Banking        Traditional Liabilities

Source: Flow of Funds Accounts of the United States as of 2010:Q1 (FRB) and FRBNY

The connections between shadow banking and the
official banking sector
When these off-balance sheet activities ran into trouble during the
recent crisis, many banks were forced to bring the troubled assets back
onto their balance sheets, in some cases to protect their reputations in
the bond markets.

In theory, the shadow banking system did not enjoy the same implicit
support that is offered by governments to the banking system
which is the main reason it has escaped the same level of regulatory
scrutiny. However, given its scale and its connections with the official
banking sector, governments could not allow many parts of the
shadow banking sector to fail during the crisis. The AIG bailout and
government support for money market funds that had promised never
to “break the buck” are cases in point.

Regulatory response
The response from policy makers has been to increase the strictness
of regulation for shadow banking. For example, the European Union
recently approved a new Directive on Alternative Fund Managers
which introduces official capital and reporting requirements.

These regulations may constrain risk-taking at alternative fund
managers, and other regulations may similarly constrain other
known types of shadow banks. But shadow banking is a remarkably
dynamic and opaque industry, and we are skeptical about the ability
of regulators to control the quantity of risk it takes on. In a game of
cat and mouse between regulators and shadow bankers, the mice will

8                                                                Copyright © 2011 Oliver Wyman
win. There are far more mice; they are typically better informed and
better motivated than the cats; and the extraordinary complexity of
modern financial products and the global scope of the industry give
the mice a nearly limitless supply of nooks and crannies to hide in.
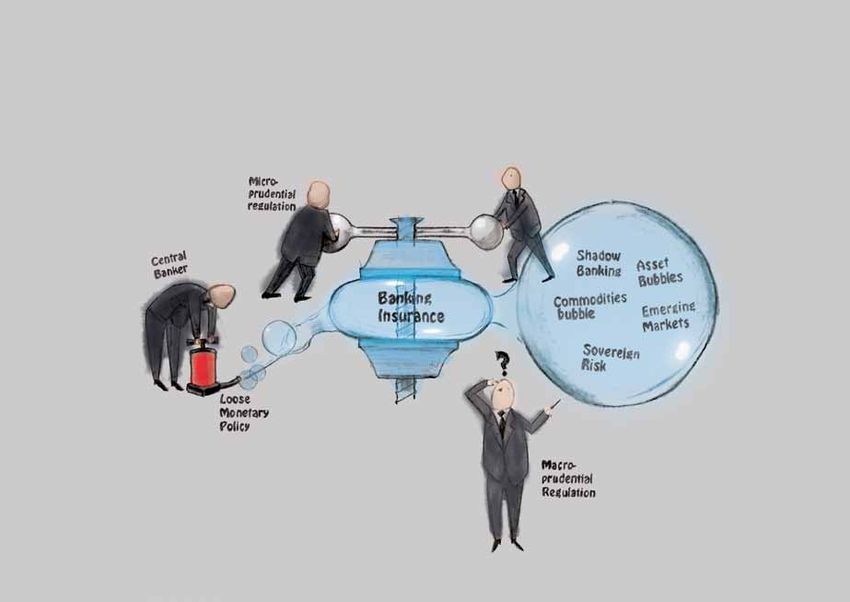
Squeezing the balloon
The regulatory trend of coming down hard on the banks will increase
the amount of risk in the shadow banking sector. The fundamental
macro imbalances2 that are driving up levels of risk in the financial
system will not be addressed by any of the new regulations. The
only question is where these risks will go. Squeezing them out of the
more transparent and manageable banking system could prove to be
a mistake.
Exhibit 2: The regulatory squeeze on banking
Regulation
Shadow
Macro Banking banking
imbalances
Given the tendency of financial institutions to manage their risks
by partially placing them in the shadow banking sector, there is also
a strong possibility that the interconnectedness between the two
systems will increase as the new rules create even greater incentives
for regulatory arbitrage. Short of any reduction in the actual risks,
and contrary to the instincts of vote-seeking politicians, the best
way to avoid another bubble may be to loosen the regulatory vice on
the banks.
2 For example, the trade imbalances between the US and China have actually grown during
the crisis rather than having been diffused
Copyright © 2011 Oliver Wyman 92.2. Emerging markets asset bubbles
In a study of emerging markets crises for the IMF in 19993, Graciela
Kaminski observed that such crises tended to be “preceded by an
explosion of international lending to emerging markets at very
low real interest rates” and that the crises later erupted “as the
industrialized countries engaged in extremely tight monetary
policies”. In other words, emerging markets’ asset bubbles, and their
bursting, are to a great extent effects of Western monetary policy. She
then notes that the sudden “switch to contractionary monetary policy
provoked a sharp rise in real interest rates, profound recessions in
industrial countries, and plummeting commodity prices.”
Our scenario builds on these historical observations and has a
commodity price bubble at its center. The fallout from such an emerging
markets crisis could be even more severe than in previous crises, with
the biggest losers coming from the developed world. Western monetary
policy is looser than ever, so the bubble could be unprecedented in size.
And the high levels of indebtedness in developed economies means
that they are in no position to absorb a rapid monetary tightening
without experiencing a massive rise in insolvencies, including perhaps
the insolvency of several developed world sovereigns.
Below we outline in more detail the two phases of our scenario.
Phase 1 describes the “bubble formation” while Phase 2 describes the
“bursting of the bubble”.
Exhibit 3: Phase 1 – Bubble formation
Phase 1: Bubble formation
Emerging markets – commodities exporters China – world’s largest commodities importer
(LatAm, Africa, Australia) “Commodities narrative”
Storage of Strong
excess Real Real world
Chinese
commodities demand commodities
economic
supply demand
CNY growth
Speculative
Undervalued
Commodities demand Commodities Chinese
Business case Commodities Chinese
development CNY investors/ inflation
price currency
projects speculators concerns
bubble CNY
US$ Cheap debt financing US$ Speculative demand Currency peg
Western
banks
Loose Commodities Weak
Inflation
monetary investors/ US currency
concerns
policy speculators US$
Western world (US, UK, Eurozone) – loose monetary policy
3 Currency and Banking Crises: The Early Warnings of Distress, Graciela Kaminsky, IMF Institute, 1999
10 Copyright © 2011 Oliver WymanDuring phase 1 we distinguish between two sources of demand
affecting commodities prices: demand for use in the production of other
goods (“real” demand) and demand for the purpose of price speculation
(“speculative” demand). There are three major groups of players in our
scenario. Firstly, there are economies, such as Latin America, Africa,
Russia, Canada and Australia, which are the largest commodities
producers. Secondly, there is China, which is now the world’s largest
commodity importer. Thirdly, there are the developed world economies,
such as the US, which are pumping liquidity into the financial system
through their loose monetary policies.
As with any bubble, our scenario contains a compelling narrative that
allows investors to convince themselves that “this time is different”.
In this case it is a story of strong economic growth coming from China
creating a sustainable increase in demand for commodities.
However, it is already apparent that increasing commodities prices are
also creating inflationary pressure in China, which is exacerbated by
China holding its currency artificially low by effectively pegging it to the
US dollar. This makes commodities look like an attractive hedge against
inflation for Chinese investors. The loose monetary policy in developed
markets is similarly making commodities look attractive for Western
investors. This “commodities rush” is demonstrated in the right-hand
chart below, which shows the asset allocations of European and Asian
investors. A recent investor survey by Barclays also found that 76% of
investors predicted an even bigger inflow into commodities in 2011.
Exhibit 4: The Commodities Rush
CRX index vs. S&P 500 (Market value of European and Asian mutual fund
equity of commodity-related companies) investments in commodities
Index: 2005-05-31 = 100 €MM
450 40,000
CRX
400 35,000
350
30,000
300
25,000
250
20,000
200
15,000
150
S&P 500 10,000
100
50 5,000
0 0
2005 2006 2007 2008 2009 20101
2000
2001
2002
2003
2004
2005
2006
2007
2008
2009
2010
1. Based on Q3 data
Source: Bloomberg, FERI, Oliver Wyman analysis
Copyright © 2011 Oliver Wyman 11Based on the currently inflated commodity prices, commodity
producers in countries such as Brazil and Russia have clear business
cases for investing in projects to dig more commodities out of the
ground. As competition to launch such projects increases, the costs
of completing them also starts to rise, with the owners of mining
equipment and laborers capitalizing on the increased demand by
charging higher rates. Because a portion of the demand for the
projects is not coming from the real economy, an excess supply of
mining capacity and commodities will be created.
As with previous asset bubbles, we expect much of the debt financing
for these projects to come from banks. And much of this bank
financing is likely to be supplied by Western banks that are eager
to preserve their diminishing return-on-equity and need to find
lending opportunities that are sufficiently lucrative to cover their own
increasing cost of funds. The balance sheets of life insurers will play
a supporting role here, as insurers look for long-term investments
that can match their liabilities and seek to earn additional
illiquidity premia.
Exhibit 5: Phase 2 – Bubble bursts: commodities price crash
Phase 2: Bubble bursts – commodities price crash
Emerging markets – commodities exporters China – major commodities importer
Commodities narrative ends
Massive
oversupply of Fall in Slowing Currency
commodities commodities economic allowed to
demand growth appreciate
Broken Commodities
Commodities
business case price Commodities Tightened
development Spiraling
crash CNY investors/ monetary
projects inflation
Rush speculators policy
halted
for exits
US$ Debt crisis US$ Rush for exits
Commodities
Western
investors/
banks
speculators
As a result of Phase 1
Tightened
Inflation Commodities
monetary
pressure price
policy
bubble
Western world – tightened monetary policy
Whatever bursts the bubble, it will involve investors coming to doubt
that the real demand for commodities is sustainable. For example,
further trouble in the Eurozone or political instability in the Middle
East or Asia could lead to concerns about global growth prospects
and burst the bubble. In our scenario, we have made the “prick” a
tightening of monetary policy in China in response to inflationary
pressure caused by China’s hot economy and rising commodities
prices. Once China’s currency appreciates and its economy slows, it
will become clear that the commodities narrative is over optimistic.
12 Copyright © 2011 Oliver WymanAt the first sign of trouble, the speculative investors will head for
the exits, causing commodities prices to crash. Many development
projects will be abandoned before completion. The parallels with the
recent real estate development crisis are clear. Developed markets’
banks that lent to the developers will suffer large losses. The ensuing
pressures on emerging market debt will also be felt by insurers that
operate in these countries and invest a large proportion of their assets
in local sovereign debt.
How big could the losses be?
Recent disclosures from mining companies and economies that
export commodities suggest that several hundred billion dollars will
be invested in commodities exploration projects in the coming years.
Losses from a commodities debt crisis could therefore be on a similar
scale to the $400 BN of direct losses that stemmed from the sub-prime
crisis. However, the IMF now estimates that the combined direct and
indirect losses stemming from the sub-prime crisis are more like
$4 TN (a factor of 10 larger). Should we expect a similar multiplier
effect in a commodities crisis?
There are reasons to think so. Commodities prices are correlated with
the broader economic growth of economies that are big commodities
producers. The chart below demonstrates this for Latin America:
Exhibit 6: Correlation between commodities prices and Latin American GDP
Year-on-year growth
40%
30%
20%
10%
0%
-10%
-20%
1990 1992 1994 1996 1998 2000 2002 2004 2006 2008 2010
Commodities prices Latin American GDP
Source: IMF commodities price and GDP data; Oliver Wyman analysis
Copyright © 2011 Oliver Wyman 13It is likely then that the prices of other assets classes in these
economies, such as real estate, will rise and fall with commodities
prices. We should expect significant additional losses for those who
own these other asset classes, and for their financiers.
2.3. Sovereign debt crisis
The next part of our scenario brings the 2015 crisis home to the
Western sovereigns. A commodities crash driven by a bank-led
financing boom would cause more problems for Western banks and,
as with any price crash, create deflationary pressure. A return to
worldwide recession would be a strong possibility.
Do Western sovereigns have the debt servicing capacity to absorb
another recession? In our scenario, they do not and the next step is
the debt restructuring of some of the world’s leading sovereigns. Is
there any historical precedence for such a dramatic sovereign default
scenario? Alas, the answer is “yes”. The chart below is based on data
compiled by the economic historians Carmen Reinhart and Kenneth
Rogoff. It shows that while sovereign defaults in recent history have
been contained to a few small countries, the longer term history of
sovereign defaults is very different.
Exhibit 7: Historical sovereign default/restructuring events
As percentage of
world income
45
Share of countries in default
40
Which
35 Scenario?
30 Power
Defaults increased re-balancing
25 dramatically scenario
during the previous
re-balancing of power
20
15 Post-war
average
10 Average of
last 20 years
5
Recent
history
0
1800
1807
1814
1821
1828
1835
1842
1849
1856
1863
1870
1877
1884
1891
1898
1905
1912
1919
1926
1933
1940
1947
1954
1961
1968
1975
1982
1989
1996
2003
2010-2015
Source: Reinhart, Carmen M and Rogoff, Kenneth S; This Time is Different: Eight Centuries of Financial
Folly. ©2009 Princeton university Press. Reprinted by permission of Princeton university;
Oliver Wyman analysis
14 Copyright © 2011 Oliver WymanBased on our analysis of this data, we think it makes sense to consider
four scenarios for how sovereign risk might evolve during the period of
our story (2011-15):
Scenario severity Example scenario1
(sovereigns in default or restructuring as
a percentage of world GDP)
Benign case Default events limited to very minor economies such
Recent history continues as Iceland
1-2%
Base case Defaults limited to smaller Eurozone economies (e.g.
Average from last 20 years Ireland, Greece and Portugal) and the occasional
emerging market sovereign
3-4%
Bad case Some of the bigger names in the Eurozone caught
Return to post-war average in the contagion. China’s slowing economy causes
instability and sovereign problems in the Asia
8-10% Pacific region
Worst case Doubts about the ability of the world’s most indebted
Global power re-balancing economies (US, UK, Japan and Eurozone) to service
their debt causes a global sovereign debt crisis
20% +
1. The countries named in our examples are intended merely to give examples of the types of
countries that might get caught if default rates rise to the levels specified in our four scenarios.
In reality, if default rates rise to, say, 10%, the exact list of countries that would make up that
10% is difficult to predict; the reader should not attach too much weight to the names used in
our example.
Benign case
Over the last decade, sovereign default and restructurings have been
restricted to a few small countries, such as Iceland. Our most benign
scenario is therefore to assume that future default and restructuring
events continue to be limited to the smallest players on the
global scene.
Base case
Our base case assumes that sovereign default rates revert to the average
default rate observed over the last 20 years. The peripheral nations of
the Eurozone would be candidates for inclusion in this scenario, and
external shocks such as our commodities crisis could see some of the
larger emerging economies such as Brazil and Russia involved in the
problems. If the external shock comes from something other than
commodities then the countries involved could be very different.
Bad case
A worse scenario would see default rates rise up to their post-war
average. Under this scenario we might see problems in the Eurozone
spread to some of the bigger countries, such as Spain. The network
of exposures that exist between the Eurozone banks and sovereigns
could see some of the other larger Eurozone countries dragged down
and survival of the Euro currency in its current form brought into
question. Alternative scenarios of this magnitude might see a slowing
Copyright © 2011 Oliver Wyman 15Chinese economy or rising food prices lead to political instability which could destabilize the Asia Pacific region. There are many other political hotspots, including problems in the Middle East or the Korean peninsula, which could be the driver of future sovereign problems as either civil unrest or war takes hold. Worst case Our worst-case scenario assumes that default rates move back up to their historical peak based on the 200 years of data in the Reinhart & Rogoff chart. This would represent the culmination of trends that amount to a complete global rebalancing of economic power: most likely from the US and European economies to the emerging markets. From this perspective, the sub-prime crisis was merely the start of a period of economic instability engendered by this realignment. One way of interpreting the historical data in the chart is that the transfer of power from the British Empire to the United States in the first half of the 20th century caused a period of global instability that ultimately led to the default of some of the world’s largest economies. Only when the US emerged as the dominant economic and military power at the end of WWII did the world enter a new period of economic stability. In 1940 the British pound still accounted for two- thirds of foreign currency reserves but by 1945 the US dollar had become the global reserve currency. We attach only a small probability to this severe version of a global rebalancing scenario given that many of the historical defaults in the early 20th century example were caused by massive wartime spending combined with the destruction of a large proportion of the world’s economic production capabilities. In addition, there is no clear alternative to the US dollar as a reserve currency now that the Euro has lost its luster (and it feels a little early, in our view, to be talking about a Renminbi reserve currency). Optimists might argue that the G20 will avoid the chaos in our more adverse scenarios by resolving the global economic imbalances through negotiation and careful management of the process. However, the recent history of Greece and Ireland has shown that a nation needs to be on its knees before it is willing to make these types of concessions. 16 Copyright © 2011 Oliver Wyman
3. What financial institutions and
regulators might learn from our
pessimistic scenario

The purpose of considering pessimistic scenarios, such as ours, is not
simply to depress readers. Our scenario is designed to “stress” the
new financial and regulatory system and uncover the weaknesses
that remain. In this section, based on these findings, we suggest
some possible changes in course for regulators and for those running
financial institutions.

3.1. Ideas for regulators

Prepare for crises

Our scenario should remind regulators that they cannot succeed in
creating a risk-free financial system and that future crises will occur.
William Shakespeare noted that there is a “tide in the affairs of men”
and we believe that any attempt to eliminate this natural tide is
neither achievable nor desirable. Regulators should encourage banks
and insurers to put as much effort into preparing for adverse events as
into modeling their probability. Many efforts have been focused on the
areas of contingency planning and resolution regimes but much more
can be done.

Do not force risk out of sight

Removing risk from the regulated banking sector sometimes merely
shifts it into the shadow banking sector, where it is harder for
supervisors to monitor and contain (see section 2.1 above). A financial
system in which more risk stays in the traditional or regulated sector
may be safer altogether. Regulators should avoid squeezing too hard,
especially given that a shadow banking crisis will almost certainly
precipitate failures in the regulated sector.

Copyright © 2011 Oliver Wyman                                         17
Focus on scenario analysis and stress testing

Many of the most successful initiatives that regulators have launched
recently have incorporated the use of stress testing and scenario
analysis to help financial institutions understand how much capital
                                                4
they need to guard against future crisis events . These approaches
are a useful complement to the internal models that currently lie
at the heart of financial regulation. We recommend that regulators
take these exercises further and make them a regular part of the
supervisory process.

In addition to requiring banks and insurers to run stress tests,
regulators should run scenarios to stress test their entire financial
system. As much as policymakers might reassure the public that it
will never happen, we would hope that behind closed doors European
regulators have, for example, assessed what might happen to their
financial system in the event of a break-up of the Eurozone. Like
financial institutions, regulators should have clear contingency plans
for dealing with such scenarios.

Follow the money

Another lesson from our scenario is that a financial crisis tends to be
preceded by a period of excessive profit generation. When trying to
identify risks, regulators should ask which businesses and investment
strategies are currently contributing most to the earnings growth of
financial institutions. There were notable examples from the previous
crisis where off-balance sheet SIV vehicles were at times generating
much of the profits of some large international banks.

Although we do not recommend regulators trying to micro-manage
financial institutions’ business decisions, one suggestion is that any
lines of business that are generating “super profits” should receive
additional attention from regulators. It may turn out that the next
generation of super-profitable businesses have manageable risks, but
we would not bet on it.

4    The Fed, CEBS and the UK FSA have all implemented successful bank stress testing
     exercises during the last few years and, in all three cases, the results of the exercises helped
     to identify vulnerable areas in the system and led to additional capital raising efforts by
     the banks

18                                                               Copyright © 2011 Oliver Wyman
Remove subsidies The scale of the damage caused by the recent crisis created an understandable backlash against financial services and even raised questions about the merits of free markets. We believe that financial institutions should continue to play a key role in ensuring the efficient allocation of capital and that the global economy will continue to benefit from the free flow of trade and capital. The most common source of “market failure” is governmental distortion of prices, usually by way of taxes or subsidies. In the financial markets, the most obvious such distortion arises from the implicit government support for bank creditors. This effectively subsidizes bank risk-taking by reducing the risk premia on banks’ debt funding. Requiring banks to hold more and higher quality capital should help to counteract the risk subsidy, and “living wills” and other measures aimed at imposing losses on debt holders may help to eliminate the subsidy. However, regulators should also address the other sources of price distortion in markets that financial institutions operate in. These can cover very diverse areas of public policy ranging from tax incentives to housing policy to the existence of government-backed lending institutions. A broader definition of price distortion might also include the effects of quantitative easing and the expansion of central bank repo facilities. As our scenario reminds us, such price distortions can cause bubbles to form and changes in them can be a source of future risk. We recommend that financial regulators work to understand how market distortions might be perverting incentives and behavior in their financial markets and to work with other policy makers to eliminate them or, at least, to mitigate their impact. 3.2. Ideas for Financial institutions Let your risk capabilities shape your strategy It is often said that a financial institution’s risk capabilities should be better used to support business activities. We would go a step further. Risk management is (or, at least, should be) what financial institutions do well. Your risk capabilities should not merely support your business activities but should drive your business strategy. If you are trying to decide which markets to operate in, the first question you should ask is whether you have the right risk management Copyright © 2011 Oliver Wyman 19
capabilities to understand and manage the risks they present. The
same thinking can be extended to other functional capabilities, such
as your infrastructure and systems. Are you using these capabilities to
support, align or drive your business strategy? Our scenario highlights
the dangers of entering new markets where you lack the capabilities
required to back up your strategy.
Plan with scenarios
While working for Shell in the 1980s, Arie de Geus was a pioneer
in scenario-based planning. His approach built on the company’s
engineering heritage. Any engineer who builds a new bridge will
“stress” its design. Can the bridge withstand unusually heavy traffic?
Can it withstand heavy lateral wind? What happens if we try twisting
the bridge? Similarly, Shell began analyzing its business plans under
various possible external conditions.
Most financial institutions have something they would describe as a
“scenario-based planning” process, but it is a million miles away from
what Arie de Geus had in mind. They typically begin with a base case
forecast from which they then construct some alternative scenarios.
However, the thought put into the scenarios often amounts to little
more than “let’s move revenues and costs up and down by 20% and
see what happens”. Shell’s approach was, and still is, to invest a great
deal of effort into the articulation of alternative scenarios and then to
force senior managers to engage in a thorough discussion and analysis
of the scenarios as they apply to each business line. An illustration of
how this might work for a financial institution is shown below.
Exhibit 8: Scenario-based planning framework
4 Iteration
1 Business plans
2 Micro view – P&L by business under each scenario
Current P&L and B/S by Historial scenarios Hypothetical scenarios
business (2010) Base Equity Asian LTCM/ Sub-prime Commodities Eurozone CCP Interest
Business Case crash 87 crisis 97 Russia 98 crisis 08 crisis crisis blow up rate hike
Growth plans by Retail 100 80 60 90 -500 70 -300 70 130
business (2011 to 2013) Middle Market 50 20 20 50 -200 40 -230 40 40
Specialized lending 30 -50 -150 -500 -1,500 -900 -450 20 40
Starting capital and
Capital Markets 60 -200 -80 -420 -400 -300 -1,600 -600 -150
RWA position for entire Insurance 40 10 30 -120 20 -50 -350 -30 -200
group (year-end 2010) TOTAL 280 -140 120 -900 -2,580 -1,120 -2,930 -500 -140
Macro view – commodities crisis
GDP – +
Interest rates – + 3 Risk appetite constraints
Commodities – + Regulatory constraints
Equity – + Minimum capital ratios
Property – + Target credit rating
Ability to pay dividend
Etc. Base
20 Copyright © 2011 Oliver WymanOur commodities crisis scenario might be one of many adverse scenarios to consider in such a framework. Another might be a “CCP blow up” now that vast volumes of derivatives exposures will be concentrated within these centrally cleared counterparties. Some companies also include unusually benign scenarios to ensure they all understand the full spectrum of opportunities during planning discussions. A more substantive scenario planning process would include the following: 1. Each business unit submits its business plans and growth ambitions 2. These plans are stressed using the various scenarios (note: it is vital that the risk factor shocks used in the scenarios are set independently of the business, incorporating the views of risk management) 3. A number of criteria are checked to see whether the scenario combined with the business plans breaches the bank’s risk appetite statement 4. If the risk appetite is breached then the businesses must iterate their plans until the plans are consistent with the company’s risk appetite statement Only a handful of financial institutions have anything close to these scenario capabilities, either in terms of generating scenarios or using them for planning. The true test of the integration of scenario analysis into the planning process is the extent to which businesses modify their growth plans as a result of the scenario outputs. The example above focuses on the quantitative aspects of scenario analysis but de Geus’ framework also encouraged senior management to engage in a qualitative discussion of each scenario. A budgeting process generally leads to a “consensus view” of the world where individual opinions are lost. Scenario-based discussions allow people to explore and develop individual opinions and to drill down into areas of the business that might otherwise remain hidden. Such an approach would elevate the status of risk managers that have the ability to think laterally rather than the previous tendency to value most highly those with the greatest quant skills. The narrower a risk manager’s focus, the more likely they are to get sidelined and miss out on the important discussions that shape the future of the company. Any process that creates a closer working relationship between risk managers and business people would be, in our view, a good thing. Copyright © 2011 Oliver Wyman 21
Diversify in a new way
The textbook concept of diversification usually involves spreading
your bets across multiple assets, asset classes or markets. One of the
lessons from our crisis scenario is that, in a globally connected world,
the risks in different geographical markets may actually be highly
correlated. The sub-prime crisis, in particular, showed that credit
assets across the entire globe can simultaneously drop in value.

An alternative way for financial institutions to create diversification
is to find revenue sources that are either insensitive to the economic
cycle or are driven by sources of risk other than credit. These could
include investing in less cyclical businesses, such as payment systems
or for insurers, underwriting-driven products. Other ideas might
include developing retirement solutions for our aging populations
which would contain a new set of risks that are uncorrelated to credit
and equity risks. Given the low expected loan growth in developed
markets, such diversification may be necessary not only to avoid
future downside but to grow at all.

Lead rather than follow
Our scenario includes two phases of herd behavior. The first involves
investors trying to squeeze into an already overcrowded market;
the second occurs when the same investors simultaneously rush
for the exits. It is the actions taken during this first phase that will
determine exposure to a crisis. Options during the second phase are
severely limited.

In the build up to the sub-prime crisis bank balance sheets became
more and more homogenous with all banks basically betting on
the same set of risks. Most banks jumped on the structured credit
bandwagon in one form or another, regardless of whether they had
any expertise or other advantage to bring to this market. Insurers
followed the banking “herd’, taking an investment grade credit rating
as an article of faith and building up large positions in “high quality”
structured credit for relatively small improvements in yield. We
are now seeing a similar type of herd behavior as banks rush into
emerging markets.

The alternative to herd behavior is leadership. By this we mean
leading your own organization down a path that is right for it based
on its ability to manage certain types of risks. This is easier said than
done. Once the herd starts running towards the new Promised Land,
only the strongest leaders can stand firm against criticism that they
are falling behind the pack.

22                                              Copyright © 2011 Oliver Wyman
Follow the money

As we highlight in the regulatory section above, bubbles are highly
correlated with super profits. Focusing additional board and executive
attention on extraordinary growth areas will help to prevent the
situation we experienced in the last crises where many in senior roles
did not fully understand the risks that accompanied the extraordinary
sources of profits at the time.

Be patient

While our scenario paints a picture of doom and gloom, we should
remember that two of the greatest banking dynasties in history,
Rothschild and JP Morgan, emerged from the crises of 1815 and 1907
respectively. A conservative strategy that allows you to operate as a
safe haven in a storm can guarantee your future and provide many
opportunities to take actions from a position of strength.

It is also interesting to compare the timing of RBS’s acquisition of ABN
Amro to Barclays’ takeover of Lehman Brothers. No level of operational
or management savvy can fix the problem of having overpaid for an
asset. But the rewards can be great for those who pounce when the
time is right which often means waiting for a bubble to burst. Such
opportunities are, however, reserved for those that have resisted the
temptation to take too much risk during the boom period.

Accept that the world has changed

All stakeholders in financial institutions must understand that their
world has changed. The last couple of decades of constantly falling
interest rates is over; customer demographics are shifting; regulations
are tightening. Trying to replay the successful strategies of the past
25 years will not work.

Highlighting the difficulty of accepting this change, many bank
executives have stated that their number one priority is “RoE
preservation” in the face of these new challenges. However, they need
to understand that with higher capital requirements, the returns
of the past are unsustainable. It is vital that bank shareholders
also understand this if we are to avoid the irresponsible risk taking
that might otherwise result. More dialogue is required between
shareholders and executives to agree realistic targets for the next
five years.

Copyright © 2011 Oliver Wyman                                           23
Conclusion

The financial crisis of 2008 shook politicians, bankers, regulators,
commentators and ordinary citizens out of the complacency created
by the 25 year “great moderation”. Yet, for all the rhetoric around a
new financial order, and all the improvements made, many of the
old risks remain. The basic regulatory framework – of bank debtor
guarantees and regulatory bank capital and liquidity minima (that is,
of risk subsidies and compensatory risk taxes) – has been maintained
with tweaked parameters. And, within this system, bank shareholders,
bondholders and executives still have incentives that might herd them
towards excessive risk taking. The crisis scenario described at the
beginning of this report can be seen as a continuation, after a breathing
space provided by taxpayer-funded bailouts, of the 2008 crisis.

Of course, events will not unfold precisely as described in our scenario.
But the observable fragilities in the global economy suggest that it
would take little to create a renewed crisis. Our purpose is not to
promote defeatism, but a sense of urgency. As argued above, regulators
should put less effort into holding the lid down on banks and more
into addressing the financial market distortions that fuel the pressure
under the lid. And bankers should use scenario analysis to take an
honest look at the risks to which their strategies expose them and
their institutions’ ability to manage them.

We called our story an “avoidable history”. Unfortunately, future crises
are not avoidable, but being a victim of the next one is.

24                                             Copyright © 2011 Oliver Wyman
Oliver Wyman is an international management consulting firm that combines deep industry knowledge
with specialized expertise in strategy, operations, risk management, organizational transformation, and
leadership development.

Copyright © 2011 Oliver Wyman. All rights reserved. This report may not be reproduced or redistributed, in whole or in part, without the written
permission of Oliver Wyman and Oliver Wyman accepts no liability whatsoever for the actions of third parties in this respect.
The information and opinions in this report were prepared by Oliver Wyman.
This report is not a substitute for tailored professional advice on how a specific financial institution should execute its strategy. This report is not investment
advice and should not be relied on for such advice or as a substitute for consultation with professional accountants, tax, legal or financial advisers.
Oliver Wyman has made every effort to use reliable, up-to-date and comprehensive information and analysis, but all information is provided without
warranty of any kind, express or implied. Oliver Wyman disclaims any responsibility to update the information or conclusions in this report. Oliver Wyman
accepts no liability for any loss arising from any action taken or refrained from as a result of information contained in this report or any reports or sources
of information referred to herein, or for any consequential, special or similar damages even if advised of the possibility of such damages.
This report may not be sold without the written consent of Oliver Wyman.
For more information please contact the marketing department by email at info-FS@oliverwyman.com or by
phone at one of the following locations:

North America                       EMEA                                Asia Pacific
+1 212 541 8100                     +44 20 7333 8333                    +65 6510 9700
You can also read