THE FUTURE OF LOW-COST AIRLINES AND AIRPORTS - Eddy Van de Voorde Departement Transport en Ruimtelijke Economie Universiteit Antwerpen
←
→
Page content transcription
If your browser does not render page correctly, please read the page content below
THE FUTURE OF LOW-COST
 AIRLINES AND AIRPORTS

Eddy Van de Voorde
Departement Transport en Ruimtelijke Economie
Universiteit Antwerpen

1

                                       BASED ON
Macario, R., Reis, V., Viegas, J., Meersman, H.,
Monteiro, F., Van de Voorde, E., Vanelslander,
T., MacKenzie-Williams, P. and H. Schmidt

The consequences of the growing European low-
cost airline sector

European Parliament, December 2007

                       Prof. Eddy Van de Voorde
2

CORE CHARACTERISTICS OF LCAs
•   High aircraft utilisation
•   Internet booking
•   Use of secondary airports
•   Minimum cabin crew
•   Lower wage scales
•   Lower rates of unionisation among employees
•   One class of seating
•   Short ground turn-around times

                       Prof. Eddy Van de Voorde
3
CORE CHARACTERISTICS OF LCAs
• No cargo carried
• Very simple fare structures and price
strategies
• Strict yield-management techniques
• E-ticketing
• Often no seat allocation
• No frills
• Point-to-point services and no connections
Prof. Eddy Van de VoordeECONOMIC MODEL
4
Prof. Eddy Van de Voorde5
LIFE CYCLE FOR MARKET
DEVELOPMENT OF LCAs
Europe
CANAD UK Mainland East New Rest of the
Life cycle stages USA Asia Australia
A Europ Zealand world
e
1.Innovation ¦ ¦ ¦ ¦ ¦ ¦ ¦ ¦ ¦
2.Proliferation ¦ ¦ ¦ ¦ ¦ ¦ ¦
3.Consolidation ¦ ¦ ¦
4. 2ndphase of ¦
entrants
5. Consolidation ¦
6. Market maturity ¦
Prof. Eddy Van de Voorde6
KEY QUESTIONS
• Is the EU aviation sector moving in the right direction?
• Are the recently adopted EU measures sufficient to
address the recent developments in the EU aviation
sector?
• If not: how and through what measures can EU policy
contribute to achieve an optimal result for the aviation
sector and customers, taking into account safety and
environmental concerns as well as EU requirements
related to Competition Law and state aids?
• Does EU need a common approach towards airports,
their capacity and their infrastructure?
Prof. Eddy Van de Voorde7
TYPOLOGY
• The Southwest-copycats (e.g. easyJet)
• Subsidiaries (e.g. Snowflake)
• Cost-cutters (e.g. Aer Lingus)
• Diversified charter carriers (e.g. Thomsonfly)
• State-subsidised companies competing on
price (e.g. Alitalia)
Prof. Eddy Van de Voorde8
ADJUSTING BUSINESS MODELS
Legacy carriers
• Discouraging potential entry of LCAs (e.g.
price decrease, capacity increase,…)
• Acquisition of an LCA
• Creation of an LCA within traditional carrier
• Switch to more profitable markets
• Radical transformation of full service carrier
into an LCA
Prof. Eddy Van de Voorde9
ADJUSTING BUSINESS MODELS
LCAs
• Tendency towards consolidation (e.g. Air
Berlin); economies of scope?
• Revenue sources other than ticket sales (i.e.
LCA evolves into LFA)
• Lower workforce costs
• Financing from airports and/or local authorities
• Customer on-board service
Prof. Eddy Van de VoordeLCAs SOURCES OF COST ADVANTAGE 10
Cost reduction Cost per seat
Traditional Carrier 100%
Low Cost Carrier
Operating advantages
Higher seating density -16 84
Higher aircraft utilisation -2 82
Lower flight and cabin crew costs -3 79
Use cheaper secondary airports -4 75
Outsourcing maintenance /single aircraft type -2 73
Product / service features
Minimal station costs and outsourced handling -7 66
No free in-flight catering, fewer passenger services -5 61
Differences in distribution
No agents or GDS commissions -6 55
Reduced sales/reservation costs -3 52
Other advantages
Smaller administration and fewer staff / offices -3 49
Low Cost Carrier compared to a traditional carrier
Prof. Eddy Van de Voorde
49%11
COSTS PER SEAT-KM
Cost per seat-km Index (British Airways=100)
Traditional carriers
Austrian 16.12 129
Lufthansa 14.62 117
Air France 14.52 116
SAS 13.02 104
Alitalia 12.57 100
British Airways 12.57 100
Iberia 9.03 72
Low Cost Carriers
easyJet 6.9 55
Ryanair 4.81 38
Source: Doganis (2006)
Prof. Eddy Van de Voorde12
UNIT COSTS ON INTRA EUROPEAN
FLIGHTS (2003)
18,00
16,00
14,00
Cost per ASK (US cents)
12,00
10,00
8,00
easyJet
6,00
Ryanair
4,00
2,00
0,00
0 200 400 600 800 1000 1200 1400 1600 1800 2000
Prof.
Average Eddy
Sector Van
Length (km)de Voorde13
THE CURRENT LCA MARKET
European LCAs have benefited from a very
liberal legal framework and geo-political factors
such as:
• The Single European Aviation Act
• Underdeveloped air capacities
• The enlargement of the European Union
• Open-skies agreements
Prof. Eddy Van de Voorde14
WEEKLY PERCENTAGE SHARE OF
SEATS IN EUROPE (summer 2006)
Weekly % share of Seats in Europe ‘No-frills’: 3.1 millions weekly seats
Air Berlin
Other Ryanair
No-frills
(mainly charter) bmibaby 13%
18,4% Germanwings
Transavia
25,9% 31%
Jet2.com
ThomsonFly
Wizz 24%
Vueling
Virgin Express
SkyEurope
Helvetic Airways
Smartwings 6%
55,7% Hapag-Lloyd Express 26%
AEA airlingus.com
easyJet
Prof. Eddy Van de Voorde15
PRODUCTION INDICATORS FOR LOW-
FARES AIRLINES (2006)
Passengers Average load Number of daily Permanent Number of
Airline Number of routes
(million) factor (%) flights employees aircraft
Ryanair 40.5 83.0 750 440 3,500 120
EasyJet 33.7 84.6 765 278 4,220 121
Air Berlin 1 16,8 77,9 n.a. n.a. 4,000 62
Flybe 2 5.5 n.a. 270 116 1,700 36
Transavia.com 5.1 84.0 78 105 1,463 27
Norwegian 5.1 79.0 160 83 650 20
Hapag-Lloyd
4.6 79.3 n.a. n.a. n.a. 18
Express 3
Sterling 4.0 82.0 120 74 1,178 24
Wizzair 3.0 80.0 63 49 460 9
Sky Europe 2.7 77.0 59 79 850 16
Myair.com 1.1 73.0 24 37 190 5
Sverigeflyg 0.4 80.0 42 6 50 6
Prof. Eddy Van de Voorde16
AVOIDING MUTUAL COMPETITION?
• Ryanair: concentrates on smaller markets
and regional airports
• easyJet: focussing on bigger markets and
primary airports
• Important question: will potential overcapacity
result in a price war and/or a consolidation
wave?
Prof. Eddy Van de Voorde17
EVOLUTION OF EUROPEAN ROUTES
SERVED BY SINGLE CARRIERS
Prof. Eddy Van de Voorde18
GENERATION OF NEW PASSENGERS
THROUGH LOW FARES
Prof. Eddy Van de Voorde19
TRENDS IN THE LCA MARKET
• The European LCA market continues to grow
strongly: Ryanair (+23%) and easyJet
(+16%) in 2006
• Deusche Bank (May 2007): volume growth of
ca. 15% per annum, as a combination of share
shift, GDP growth and rising propensity to
travel
Prof. Eddy Van de Voorde20
ESTIMATED NUMBER OF AIRCRAFT
AND PASSENGERS CARRIED BY
EUROPEAN LCAs UNTIL 2012
2005 2006 2007 F 2008 E 2009 E 2010 E 2011 E 2012 E
Number of aircraft
easyJet 108 120 143 160 177 194 211 228
Ryanair 87 113 132 152 172 192 212 225
others 152 181 221 260 302 347 395 458
Total 347 414 495 572 651 733 818 910
Passengers (millions)
easyJet 28 34 38 42 46 51 55 60
Ryanair 31 41 48 55 62 69 76 81
others 45 56 67 79 92 106 122 141
Total 105 130 152 176 201 227 253 282
note: F - forecast; E - estimate
Prof. Eddy Van de Voorde21
ESTIMATED NUMBER OF AIRCRAFT
AND PASSENGERS (UNTIL 2012)
300
250
Passengers (millions)
200
150
100
50
0
2005 2006 2007 F 2008 E 2009 E 2010 E 2011 E 2012 E
Ryanair easyJet others Total
Prof. Eddy Van de Voorde22
SOME PRODUCTIVITY INDICATORS (06)
Airline Daily flights / Passengers / aircraft / Employees / aircraft Passengers /
aircraft day employee
Ryanair 6.25 925 29.2 11,571
easyJet 6.3 763 34.9 7,986
Flybe 7.5 419 47.2 3,235
Transavia.com 2.9 518 54.2 3,486
Norwegian 8.0 699 32.5 7,846
Hapag-Lloyd Express n.a. 700 n.a. n.a.
Sterling 5.0 457 49.1 3,396
Wizzair 7.0 913 51.1 6,522
Sky Europe 3.7 462 53.1 3,176
Myair.com 4.8 603 38.0 5,789
Sverigeflyg 7.0 183 8.3 8,000
Prof. Eddy Van de Voorde23
THE RISKS
Some inputs will become much more expensive,
because of:
• Current full order books of aircraft
manufacturers
• Pilots shortage
• Congested airports and airways
Crucial: the speed of adjustment!
Prof. Eddy Van de VoordeYear Airline Country Event
1999
24
AB Airlines UK Bankruptcy
Color Air Norway Bankruptcy
LCAs
Debonair UK Bankruptcy
2002 GO UK Bankruptcy
BANKRUPTCIES
2003 Air Lib France Bankruptcy
Buzz UK Merger with Ryanair
Goodjet Sweden Bankruptcy
2004 Air Polinia
Basic Air
Poland
Netherlands
Bankruptcy
Merger with Transavia
OR MERGERS
Duo Airways UK Bankruptcy
Flying Finn Finland Bankruptcy
Germania Express Germany Merged with dba
GetJet Poland Bankruptcy
Jetgreen Ireland Bankruptcy
Skynet Airlines UK Bankruptcy
V-Bird Netherlands Bankruptcy
VolareWeb Italy Bankruptcy
2005 Air Andalucia Spain Bankruptcy
Eujet Ireland Bankruptcy
Intersky Austria Bankruptcy
Maersk Air Denmark Merged with Sterling
2006 Air Tourquoise France Bankruptcy
Air Wales UK Bankruptcy
Budget Air Ireland Bankruptcy
dba Germany Merged with Air Berlin
Flywest France Bankruptcy
HiFly/ Air Luxor Portugal Bankruptcy
MyTravelite UK Reintegrated into MyTravel Airways
Snalskjusten Sweden Bankruptcy
2007
Prof. Eddy Van de Voorde
LTU Germany Merged with Air Berlin25
TYPOLOGY OF AIRPORTS
Primary Hub Secondary Hub Feeder/Regional Low-Cost Airport
airport
Size in passengers per year > 20 million >10 million < 10 million Not applicable *
Main airport of the national Yes No No No
flag carrier
Connections outside Yes Yes or No Yes or No Possible but
Europe untypical**
Examples Frankfurt, Charles Barcelona, London-City, Stansted, Luton,
de Gaulle, Gatwick, Bremen, Stuttgart Lübeck, Frankfurt-
Amsterdam, Copenhagen Hahn
Heathrow
Prof. Eddy Van de Voorde26
VARIOUS LOW-COST AIRPORT
BUSINESS MODELS
• Lower aeronautical charges, leading to lower
financial return, so that one looks for other
non-aeronautical revenue sources
• Airport’s hinterland influences bargaining
power and positioning
• Low-cost market is highly volatile
• Constant threat to abandon service
Prof. Eddy Van de Voorde27
OPERATING PROFIT PER PASSENGER
Operating Profit Operating Profit
(Airport (Airline Hub dominating
Airport Company
Performance Performance airline
Indicators 2006) Indicators 2006)
AENA (Spain) 19% 1.6% Iberia
Aéroports de Paris 17% 2.3% Air France/KLM
Amsterdam 22% 2.3% Air France/KLM
ANA (Portugal) 15% -0.7% TAP
Copenhagen 40% -2.7% SAS
Frankfurt 4% -0.4% Lufthansa
London-Gatwick 30% 8.3% British Airways
London-Heathrow 37% 8.3% British Airways
Munich 4% -0.4% Lufthansa
Stockholm 27% -2.7% SAS
Swedish Airports Group 4% -2.7% SAS
Vienna 32% -4.0% Austrian
Average 21% 0.6% Average
Prof. Eddy Van de Voorde28
UNDERSTANDING THE IMPACT OF LCA
GROWTH
• Impact on prices
• Impact on the environment
• Impact on regional economies
• Safety and security
• Freedom of movement of persons
• Competition in the air transport sector
• Competition and coorperation with other
modes of transport
Prof. Eddy Van de Voorde29
IMPACT OF ROUTE COMPETITION ON
AVERAGE FARES (2004)
Prof. Eddy Van de Voorde30
IMPACT ON REGIONAL ECONOMIES
Three main classes:
• Direct effects (e.g. employment in activities
directly related to air transport)
• Indirect effects (as a result of the increase in
flows of people)
• Catalyctic effects (e.g. incoming investment)
Prof. Eddy Van de Voorde31
BENEFITS FOR REGIONAL ECONOMIES
FROM THE LCA ACTIVITIES
Airport, Region Main findings
Passengers generated (2003): 253000;
Direct income: 8.4 millions €;
Carcassone, France (a) Indirect income: 135 millions €;
Induced income: 272.4 millions €.
Taxes paid 91 millions €;
Cost & productivity advantages for companies in region: 147.6
Cologne Bonn, Germany (b)
millions€;
Average spent per incoming passenger: 285.42€.
Passengers generated (2003): 316000;
Average spent per business incoming passenger: 431.40€.
Pisa, Italy (c) Average spent per tourism incoming passenger: 496.52€.
Total economic impact of foreign passengers: 149.2 millions €.
Prof. Eddy Van de Voorde32
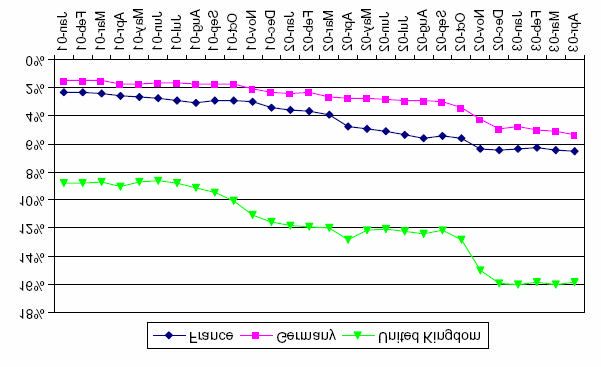
MARKET SHARE OF EUROPEAN LCA
OPERATIONS IN SOME COUNTRIES
Prof. Eddy Van de Voorde33
MODAL SHARE EVOLUTION BEFORE
AND AFTER INTRODUCTION OF HST
SERVICES
TGV, Paris - Lyon line AVE, Madrid - Seville line
Before (1981) After (1984) Change Before (1981) After (1984) Change
Aircraft 31 7 -24 40 13 -27
Train 40 72 32 16 51 35
Car and bus 29 21 -8 44 36 -8
Total 100 100 37 (ª) 100 100 35(b)
(ª) Total traffic increased by 37%. A total of 10% is related to the estimated trend of growth and 27% is considered as
induced traffic.
b
( ) bTotal traffic increased by 35%.
Prof. Eddy Van de Voorde34
CONCLUSIONS (1)
• Consolidation trend
• Contestability characteristics should be
guaranteed
• LCAs generate extra income from other
sources; any limit?
• Avoid abuse of support by airports to new
airlines
• Monitoring needed of all cost items
Prof. Eddy Van de Voorde35
CONCLUSIONS (2)
• Reaction of LCAs to the new European
regulations such as compensation of travellers
is not yet known
• Information is still insufficient on the possible
reactions of primary airports towards LCAs
• Some airports and airways are subject to
congestion, resulting in a shortage of good
slots
Prof. Eddy Van de Voorde36
CONCLUSIONS (3)
• Unlike the airline sector, the European airport
sector is expected to remain healthy and
profitable
• There is competition between airports of the
same size or role within the transport network
• Entries into the market are possible, most
obviously by redeveloping former military
airfields
Prof. Eddy Van de Voorde37
CONCLUSIONS (4)
• No evidence that LCAs are causing any
significant financial difficulty for larger airports
• It is clear that a unique LCA-model does not
exist, even if most of the European LCAs use
the southwest model as their basic reference
Prof. Eddy Van de VoordeYou can also read