The Green Bond Your insight into sustainable finance - 03 February 2022 - Cision
←
→
Page content transcription
If your browser does not render page correctly, please read the page content below

The Green Bond
                                        03 February 2022

Your insight into sustainable finance
Climate & Sustainable Finance Research                                                                                                                                          03 February 2022

In this issue
Biodiversity in the spotlight
Transition update.................................................................................................................................................................................... 3
The cost advantage of renewable energy continues to widen, and incoming data confirm a surge in investment. 2022 is likely to
see total transition investment exceed USD 1tn, doubling in just four years. However, to maintain hopes of completing the
decarbonization by 2050, it will have to double again both in the first and the second half of the 2020s.
Sustainable Debt Market Update ........................................................................................................................................................ 9
The market for sustainable debt grew an impressive 114% last year- compared to an average 52% annual growth between
2014 and 2020. This makes 2021 the fastest growing year for sustainable bonds and loans since 2014.
Moving beyond climate – Nature and biodiversity come into the spotlight in 2022 .............................................................. 18
Sustainability is more than climate. Experts have stressed that conservation and restoration of natural carbon sinks is vital to
achieving the Paris Agreement. This is about to become important for investors.
Taskforce on Nature-related Financial Disclosure: A framework for nature-related risks .................................................. 21
The Taskforce on Nature-related Financial Disclosures (TNFD) aims to address the information gap by developing and
delivering a risk management and disclosure framework for organizations to report and act on evolving nature-related risks.
Storebrand: Our commitment to nature .......................................................................................................................................... 23
Loss of biodiversity is creating risks for business, as it will affect the capacity of long-term economic growth and is likely to have
implications for long-term asset returns. For Storebrand biodiversity is part of the corporate engagement programme.
Corporates’ biodiversity action: Interview with Stora Enso, Vattenfall, and NCC.................................................................. 25
The three companies tell us why they consider biodiversity an important/material subject; how they are working to assess and
address their biodiversity impact today; and what kinds of developments they expect to see in the future.
Orkla: Assessing nature-related risks and addressing impacts .................................................................................................. 29
Food raw material is the corner stone in Orkla’s business, why biodiversity is both financially and socially important. In this
interview Orkla elaborates the risks and their initiatives to reduce negative environmental impact across the value chain.
The EU Commission’s Complementary Delegated Act on Gas and Nuclear ............................................................................. 31
Food raw material is the corner stone in Orkla’s business, why biodiversity is both financially and socially important. In this
interview Orkla elaborates the risks and their initiatives to reduce negative environmental impact across the value chain.
Commentary on the latest EU Taxonomy developments ............................................................................................................. 35
Cicero Shades of Green uses three Shades of Green to indicate a spectrum of climate risk, encouraging early steps in the
transition as well as rewarding the most ambitious actions, which allow them to consider nuclear energy and natural gas on a
case-by-case basis.
One foot in front of the other: Science-Based Targets and the march to net zero .................................................................. 38
The SBTi published a Corporate Net-Zero Standard in October 2021, and it has since seen exponential growth.
Science-based Targets initiative and its impact on capital flows............................................................................................... 42
SEB analysis shows that the Science Based Targets initiative has already become a mainstream benchmark.
Sustainable finance engineering making a change - first follow-up of the Health Impact Bond shows a positive result46
In June 2020, Region Stockholm issued a unique Health Impact Bond. The first follow-up shows positive results.
The Green Bond Editorial Team ......................................................................................................................................................... 47
Contacts at SEB ..................................................................................................................................................................................... 48

                                                                                                                                                                                                      2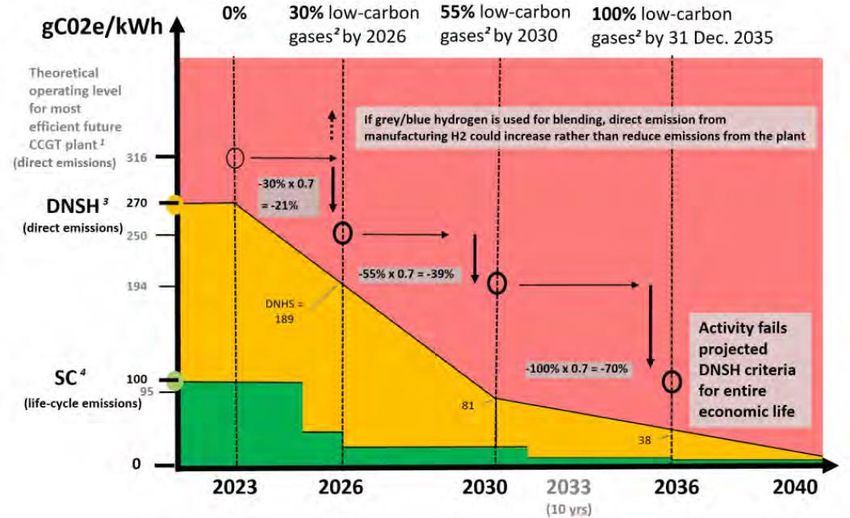
Climate & Sustainable Finance Research                                                                     03 February 2022

Transition update
We have lift-off

The cost advantage of renewable energy over fossil alternatives continues
to widen, and incoming data is starting to confirm a surge in energy
investment which will also accelerate the transition for energy using
sectors. 2022 is likely to be the first year where total transition investment
exceeds USD 1tn, doubling in just four years. However, if we are to
maintain hopes of completing the decarbonization by 2050, it will have to
double again both in the first and the second half of the 2020s.

In the December issue of The Green Bond, we suggested          According to Bloomberg New Energy Finance (BNEF),
that ‘2022 could be the year when the world finally breaks     global clean energy investment jumped more than 50% to
with a decade of stagnation in renewable energy                USD 125bn in Q4 2021, the highest quarterly spending on
investment and starts moving back to a more Paris-aligned      record. This took full-year investment to USD 350bn, also a
transition path’.                                              new record, despite weakness in the first three quarters of
                                                               the year.
This reason was that the long-term climate argument for
investing got some potent short-term support from a huge       The sudden surge may partly reflect pent-up demand from
cost advantage for renewables and a rising risk of energy      projects that were delayed during the Delta-wave of the
supply shortages. The data has since started to confirm this   pandemic last summer, but Q4 hardly constituted a major
hope, while the cost advantage has increased further.          turn for the better in pandemic terms.

Figure 1 Global clean energy investments

Source: Bloomberg New Energy Finance

Thomas Thygesen                                                Elizabeth Mathiesen
thomas.thygesen@seb.dk                                         elizabeth.mathiesen@seb.dk

                                                                                                                              3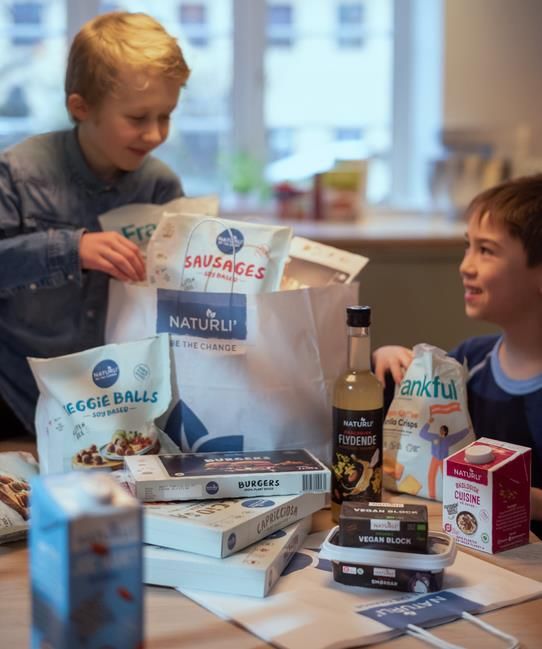
Climate & Sustainable Finance Research                                                                               03 February 2022

In our view, the bulk of the increase reflects a front-loading    corporate energy users to protect households from the
of long-term investment plans to increase short-term              impact. Since then, the crisis has eased in China due to
energy supply, not least in China, and a sudden increase in       powerful political intervention, but it has deteriorated in
the return on investment in new energy supplies. And while        Europe due to rising political tensions.
there may be some retracement in Q1, we therefore still
                                                                  The advantage of Europe’s market-based system is that
expect another increase of more than 25% in 2022.
                                                                  renewable energy now is extremely profitable both
This is not enough to lift us on to a Paris-aligned pathway,      compared to fossil alternatives and in absolute terms.
but it is the first significant step in the right direction in
                                                                  Figure 2 compares the European market price for electric
almost a decade. Increasing the supply of cheap, zero-
                                                                  power with the BNEF estimate of the levelized cost (LCOE)
emission electricity is also crucial to the acceleration of the
                                                                  of renewable energy, which means the total breakeven
transition in energy-using sectors, where access to
                                                                  cost including the cost of the initial investment. Right now,
sufficient supplies of clean energy is now a bigger
                                                                  you can produce renewable energy at a cost of around EUR
impediment to scaling than the cost.
                                                                  40/MWh. Following the explosion in European power
                                                                  prices, you can sell it at a price of EUR160bn, and even four
Cost advantage drives investment
The main reason for the timing of this surge in investment is     to five years out you can lock in a price in the new normal
the energy crisis that swept the world in the last part of        range of EUR 80-100/MWh. The large cost advantage is
2021. Like the other supply shocks in the wake of the             likely to spur private sector investment in renewable
pandemic, this was the result of a confluence of smaller          energy to complement the public investment drive, with
shocks. OPEC+ had curtailed production of oil and gas             solar energy well suited for decentralized supply.
during the pandemic and kept supplies low to support              Figure 3 China annual offshore wind installations
prices as the reopening increased demand.

At the same time, wind and hydropower supplies were
lower than usual due to weather variations, and Europe had
already reduced supplies of both nuclear power and
natural gas for political reasons. To top it off, Russian
supplies of gas to Europe started falling for reasons that
remain unclear but appear to have been political.

Figure 2 Renewable power prices

                                                                  Source: Bloomberg New Energy Finance, Nuclear Energy Agency

                                                                  In China, the outcome was not left to market forces. The
                                                                  immediate shortage of energy was resolved by a significant
                                                                  increase in coal production and coal imports, which helped
                                                                  push power prices back down over the course of Q4. This
                                                                  was not aligned with the long-term plan to decarbonize
                                                                  China’s economy, but it was the only available option within
                                                                  the timeframe required. However, China also took other
Source: Bloomberg New Energy Finance, Bloomberg                   significant steps to secure long-term supplies of zero-
                                                                  emission energy. As an example, see
The result was a sudden shortfall in the supply of energy.
By Q4, the risk of shortages had resulted in a spike in           Figure 3, China’s offshore wind installations quadrupled in
energy prices in Europe’s market-based system, while              2021, marking a complete trend break in China’s ambitions
China was forced to resort to rolling blackouts for               in this area.

                                                                                                                                   4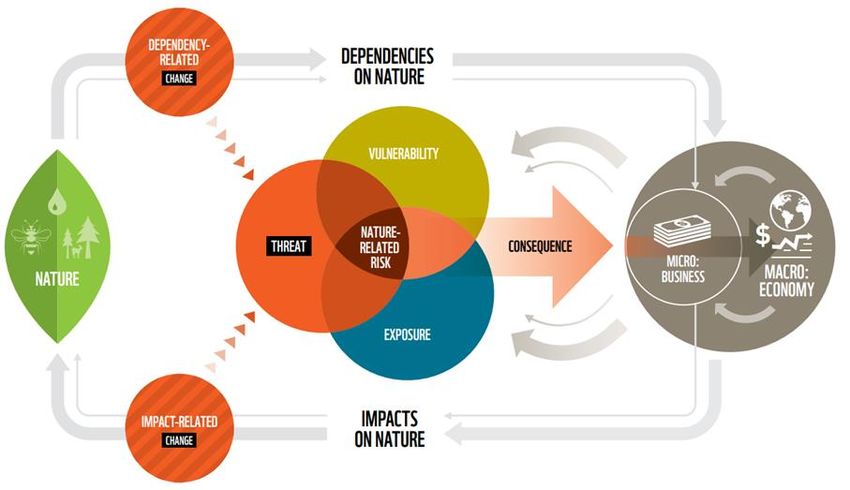
Climate & Sustainable Finance Research                                                                             03 February 2022

China’s pragmatic approach is also reflected in its decision     forces are likely to play a major role, it is the US. If
to order 150 nuclear power plants to form the stable             renewable energy becomes as profitable in the US as it is in
backbone of a new zero-emission power system. The                Europe, the US could start a rapid catch-up process. From a
experience from 2021 has shown that renewable energy             transition perspective, the real significance of a rapid ramp-
supply is too unpredictable to support the energy system         up in the supply of cheap zero-emission electricity is that it
unless it is supplemented with either a more stable              transmits into a faster transition for energy-using sectors.
alternative for off-times or significantly improved storage
                                                                 The automotive sector was the first sector to reach the
technology, and China appears to have singled out nuclear
                                                                 cost-parity tipping point and embark on the exponential
power to supply part of that stable backbone.
                                                                 and disruptive part of the diffusion process and is likely to
From this perspective, the EU’s introspection over whether       serve as a blueprint for the process in other sectors.
to put one label or another on gas and nuclear power for
                                                                 Figure 5 Battery EVs as % of total cars sold
use in this role is of limited practical significance. When it
comes to transition, the only real issue is how to make it
happen the fastest. China will scale nuclear power and may
singlehandedly revive the learning curve that was cut short
in the 1980s. Based on current technologies, this is likely to
offer a faster and less disruptive way to transition from one
energy system to another, and if that is the case then the
fast and massive investment will give China an economic
advantage. Other regions will have to emulate China or
come up with their own fast strategy.

Figure 4 Renewable share of total energy

                                                                 Source: Bloomberg New Energy Finance, Macrobond

                                                                 Modern-day EVs have had a long journey since the first
                                                                 prototypes emerged in the 1980s. The Toyota Prius
                                                                 (1997) and the Tesla Model S (2011) were major
                                                                 signposts, and by the late 2010s EVs had reached a
                                                                 combination of price, range and performance that was
                                                                 competitive without subsidies.

                                                                 The development since then has been explosive, and again
                                                                 with Europe in the lead. As Figure 5 shows, the EV share of
                                                                 all auto sales was less than 2% in 2018 but has doubled
Source: BP                                                       three times in the three following years and is now above
                                                                 12%. China has also reached double digits while the US
For now, however, Europe maintains a clear lead in the
                                                                 remains far behind at less than 3%.
transition to renewable energy (Figure 4). The share of
total energy consumption is almost twice as high as in both      The technology/cost advantage of EVs is likely to continue
China and the US, and the EU Commission’s green                  widening as the production scales up. The learning curve in
investment plan as well as the cost advantage provided by        batteries continues to deliver longer range at lower cost
the rising price of emission rights is likely to maintain a      every year, and this process is likely to continue for most of
growth rate fast enough to maintain that gap in the coming       the coming decade (Figure 6). The rising cost of fossil
years.                                                           energy alternatives will only accelerate this process.

The US may be more at risk of being left behind after a          At the current pace, the transition to 100% of all new cars
break with the rising trend under President Trump and with       being EVs is likely to be completed within a decade in
most of President Biden’s green infrastructure plan held up      Europe and China, which is at least twice as fast as most
in congress. However, if there is one country where market       auto producers expected three years ago.

                                                                                                                                 5
Climate & Sustainable Finance Research                                                                        03 February 2022

Figure 6 Price and demand of lithium-ion batteries             lead. Shipping, steel and heavy trucks are likely to be next
                                                               in line; the technologies are reaching cost parity faster due
                                                               to the rising cost of fossil energy and the main constraint on
                                                               the speed of the transition is the infrastructure required to
                                                               scale.

                                                               2022 is thus likely to be the first year where total transition
                                                               investment exceeds USD 1tn, doubling in just four years
                                                               (Figure 7). True, if we are to maintain hopes of completing
                                                               the decarbonization by 2050, it will have to double again
                                                               both in the first and the second half of the 2020s. It would
                                                               thus be wrong to say that we are on the pathway to Paris,
                                                               but nonetheless, for the first time in a decade, we are
                                                               moving in that direction

                                                               Increased competition for capital
                                                               While the technology and economic arguments for
                                                               transition have strengthened, there is still one big question:
Source: Bloomberg New Energy Finance                           how are we going to pay for all this investment and how
                                                               will it impact capital markets?
However, there is a problem: neither electricity supplies,
grids or networks of chargers are ready to accommodate         From an economic perspective, the resources required are
such a rapid diffusion. This is why the acceleration has to    not insurmountable. We estimate that around 5% of world
start with the primary energy supply and the problem does      GDP will be required to pay for all aspects of the transition
not stop with autos: other technologies that are further       including adaptation and damages from climate risks that
from cost parity with fossil alternatives need to be assured   have now become unavoidable.
not only that the cost is right but also that supply is
                                                               Nonetheless, if this happens while the rest of the economic
sufficient to justify early adoption of new technologies.
                                                               system continues to function, and it is required to function
Figure 7 Investments in transition technologies                to provide the input for the new infrastructure, then the
                                                               result is likely to be a secular shift in the balance between
                                                               saving and investment after a decade where investment
                                                               has declined despite high profits (Figure 8).

                                                               Figure 8 US corporate profits and investment

Source: Bloomberg New Energy Finance

The exponential pace of EV diffusion is evident in the surge
in total transition investment. According to BNEF, total
investment increased by USD140bn to USD 730bn, mostly
driven by investment in electrified transportation, which      Source: Macrobond

jumped from USD150bn to USD 275bn. In 2022, both
                                                               Governments have underinvested in infrastructure for
renewable energy and electric vehicle investment is likely
                                                               decades and also face challenges from under-funded
to surge, while other sectors are lining up to follow their
                                                               pension systems and unfavorable demographics.

                                                                                                                               6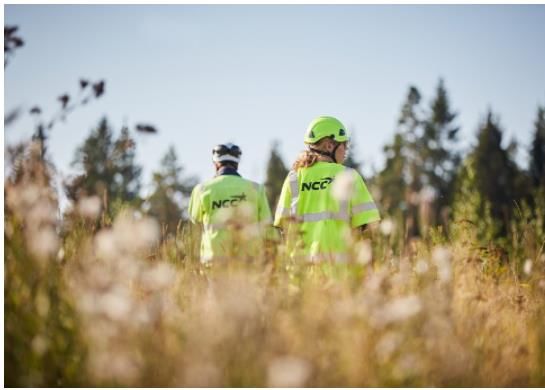
Climate & Sustainable Finance Research                                                                            03 February 2022

However, they will now be required to fund the new energy          How will we fund it?
infrastructure either by separating it from the usual budget       When it comes to ramping up the supply of zero-emission
restrictions or by assuming the risk in public-private             power, there are already encouraging signs that bond
partnerships.                                                      markets are ready to fund the investment either by buying
                                                                   green government bonds or by funding private-public joint
Energy-using sectors are likely to share the experience of
                                                                   ventures, provided that governments can assume the bulk
the energy and auto sectors; once the new technology
                                                                   of the risk (Figure 10).
gains a cost advantage, scale is the name of the game and
capital requirements in the early stages will likely turn out      Last year saw total sustainable debt issuance of USD
to be much higher than anticipated.                                1.64tn, more than twice as much as the total global
                                                                   transition investment. And the premium for green and other
And the sectors providing inputs for the transition will also
                                                                   labelled bonds appears to be rising, suggesting investors
need to expand supply of copper, steel, rare minerals and
                                                                   will forego a bit of their return to achieve a more favorable
all the other stuff that goes inside a brand-new capital
                                                                   outcome for the planet.
stock. Higher prices and increased profitability are the
market’s way of making sure such supply is available.              The task in this area is to establish an even closer link from
                                                                   sustainable debt to changes in investment to ensure that
A secular investment boom is also likely to mean full
                                                                   capital is allocated where it has the highest social return,
employment, which means companies in general will have
                                                                   but there does not seem to be any shortage of funds.
to rely on adding capital rather than labor if they want to
increase production. This is likely to lead to a more general      Figure 10 Bloomberg Green Bond Index share of total
increase in investment as a share of corporate profits and a
sustained increase in real wages.

Figure 9 Bond yields, inflation and unit labor cost

                                                                   Source: Bloomberg

                                                                   Things are more complicated when it comes to the private
                                                                   sector participants in the transition, as both energy
Source: Macrobond                                                  producers and users face a substantial risk in the transition
                                                                   with limited assurance of profitability. And in stock
This is likely to result in a sustained shift in the investment-
                                                                   markets, profitability is crucial.
savings balance and a turning point in the 40-year declining
trend for inflation and interest rates (Figure 9). For the first   ESG and low emission strategies are running into trouble as
time in decades, there will be competition for capital, and        rising real yields put pressure on growth stock multiples,
the cost of capital will be rising.                                which is the factor exposure typically offered by such
                                                                   strategies. At the same time as the MSCI Growth Index
There will accordingly be some crowding out of activities,
                                                                   relative performance broke its rising trend, the same thing
and the role of sustainable financing is likely to take on
                                                                   happened to the MSCI ESG Index’ relative performance.
added significance to ensure that transition investment is
provided preferential access to capital due to the high
social return of avoiding a climate disaster.

                                                                                                                                    7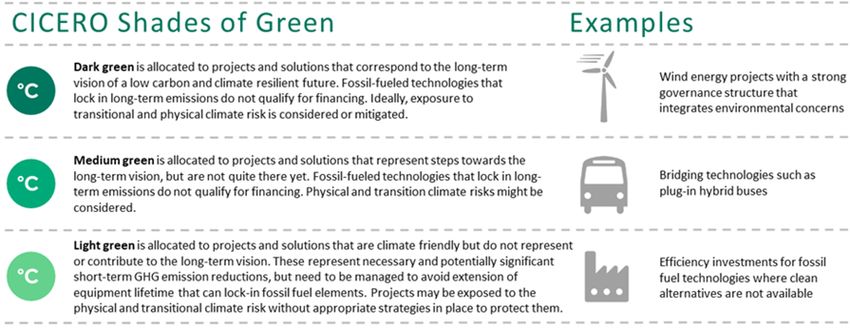
Climate & Sustainable Finance Research                                                                          03 February 2022

Figure 11 Investments in transition technologies                   The relative cost of SSAB’s zero-emission steel, for
                                                                   instance, has declined significantly in the past year and
                                                                   now appears to match the traditional steel, but the limited
                                                                   supply means buyers are willing to pay a premium to
                                                                   secure low Scope-3 emissions.

                                                                   Figure 12 MSCI World Materials and Cap goods vs. Index

Source: Bloomberg

The past year has also seen a huge reversal for the winners
in the first wave of transition-driven equity themes: buy
green energy producers and sell fossil-based energy
producers.
                                                                   Source: Bloomberg
The S&P global clean energy index did outperform the oil
index by 400% after the pandemic, but since the start of           The biggest challenge here is to open the door for funding
2021 the same trade has resulted in a 55% loss in part             from the same investor segments that provide transition
because oil companies are moving into renewable energy             capital in the bond market. Traditionally, equity investors
projects and squeezing the margins for everyone involved.          have seen shipping, steel, mining, and similar sectors as
                                                                   mature sectors where profits are taken out and
This is obviously good for society, since it means we get
                                                                   redistributed to sectors with more growth potential. They
more renewable energy for the same money, but it also
                                                                   are not convinced that they can rejuvenate themselves and
highlights how oversimplified investment narratives can go
                                                                   embark on a new secular growth story. Sustainability-
wrong in the stock market. What looked like a repricing of
                                                                   oriented investors are more likely to be willing to reward
future growth prospects and risks eventually turned out to
                                                                   companies for long-term investment but may struggle with
be unfounded when real yields rose, and margins started to
                                                                   the high reported emissions in transition companies.
compress in green energy and go up in fossil production.
                                                                   However, if you just want to focus on where the highest
This also suggests that similar green vs brown strategies
                                                                   return is likely to be found, As you can see in Figure 12,
are is likely to be too simplistic. It is not enough to identify
                                                                   capital goods and materials have been underperforming for
companies that are likely to have a faster decline in
                                                                   a decade during which governments have under-invested
emissions than their peers, you must also make sure that
                                                                   in energy and broader infrastructure and companies have
this is a profitable long-term strategy in the sector.
                                                                   reduced capital expenditure as a share of profits. If we are
Fortunately, this is unlikely to be a major issue once sectors
                                                                   embarking on a secular investment boom, we will have to
reach the tipping point and it is clear which technology that
                                                                   increase the supply of physical inputs to the transition, and
will dominate and scale.
                                                                   this suggests that there is underappreciated potential for a
There will be a widening production cost advantage for             long-term positive earnings surprise.
zero-emission products, and they may also command a
premium initially due to the low level of aggregate supply.

                                                                                                                                 8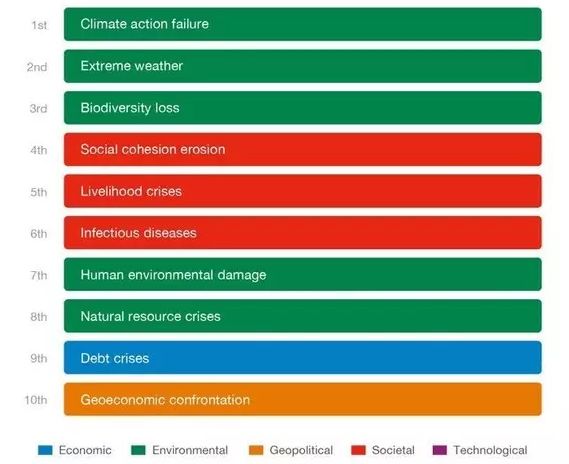
Climate & Sustainable Finance Research                                                                                                                        03 February 2022

Sustainable Debt Market Update
Record-breaking 2021 sign of what to expect from this year

The market for sustainable debt grew an impressive 114% last year-
compared to an average 52% annual growth between 2014 and 2020.
This makes 2021 the fastest growing year for sustainable bonds and loans
since 2014. Green bonds doubled in 2021, while sustainability-linked
bonds grew almost nine-fold. Corporates stood behind the growth in
performance-based bonds and loans.

As stated in our outlook report from last month, we expect                                 However, we are still confident that our growth
that sustainability-themed bonds to reach USD 1.5bn in our                                 expectations for sustainable bonds and loans will be met –
Baseline Scenario and USD 1.7bn in our Green Growth                                        and maybe even exceeded – this year. For this to happen,
Scenario – compared to 1.15bn in 2021. Adding loans                                        both old and new market segments need to grow of at least
would bring the total market size to between USD 2.3bn to                                  pre-pandemic levels – something that we believe is very
2.6bn. Risks from rate hikes, macro-economic uncertainty                                   likely given the momentum we have seen in the market last
and political tensions in Europe have only increased since                                 year.
we published our forecast a little over a month ago.

Figure 13 Cumulative sustainable debt transactions
          1,800

                                                                                                                                                                            1,643
          1,600
                                                                                                                                                              1,566

          1,400                                                                                                                                 1,417

                                                                                                                                  1,248
          1,200

                                                                                                                    1,051
          1,000
 USD bn

                                                                                                        982

           800                                                                            879
                                                                                                                                                                            765
                                                                            694
           600                                                                                                                                                              574
                                                              536

           400                                  417
                                                                                                                                                                            311
                                    216                                                                                                                                     244
           200
                                                                                                                                                                            144
                        111
             0
                  Jan         Feb         Mar           Apr           May           Jun           Jul         Aug           Sep           Oct           Nov           Dec
                                                      2016          2017          2018          2019      2020         2021

Source: Bloomberg New Energy Finance 31 December 2021

                                                                                          declined from 20% in 2020 to 13%. Sustainability Bonds
Product update
Looking at yearly records, we have seen USD 1.13tn in new                                 retained their market share of around 10% last year.
sustainability-themed bond issuance in 2021 – more than                                   Sustainability-linked Bonds saw the largest YOY increase in
double the amount of 2020. Green bonds took the                                           terms of market share, growing from just 1.5% in 2020 to
leadership position again in 2021 with 37% of the                                         6.6% in 2021.
sustainable debt marked. Social bonds remained in second                                  On the loan side, sustainability-linked loans accounted for
place when it comes to market share in 2021 even though it                                26% of the total sustainable debt market in 2021, up from

Gregor Vulturius, PhD                                                                      Filip Carlsson
gregor.vulturius@seb.se                                                                    filip.carlsson@seb.se

                                                                                                                                                                                    9
Climate & Sustainable Finance Research                                                                                                                           03 February 2022

17% market share the year before. On the other hand, the                                  Even stronger YOY growth was recorded in less developed
market share of green loans more than halved last year                                    markets. Oceania’s sustainable debt transactions increased
down to 5%.                                                                               by 292% to USD 40.25bn, South America recorded growth
                                                                                          of 204% to USD 40.5bn, the Middle East’s sustainable debt
Figure 14 Sustainable debt market by product type
                                                                                          market increased by 375% to USD 18.1bn and Africa saw
 1,800
                  Loan - Sustainability-linked                                            similar growth of 355% and USD 4.9bn in new use of
 1,600
                  Loan - Green                                                            proceeds and performance-based debt transactions.
                  Bond - Sustainability-linked
                  Bond - Sustainability
                                                                                          Finally, Supranationals accounted for USD 156bn of new
 1,400
                  Bond - Social                                                           sustainability-themed debt in 2021, up 81% compared to
 1,200            Bond - Green                                                            2020. Multilateral financial institutions retained their
                                                                                          market share of around 10% last year, showing that these
 1,000
                                                                                          institutions continue to play an important part in the
   800                                                                                    sustainable debt market.

   600
                                                                                          As mentioned in our 2022 outlook, we expect Europe
                                                                                          including the Nordics to remain the market leader. However,
   400                                                                                    Asia and the US will likely see faster growth and larger
                                                                                          market share at the end of this year.
   200

                                                                                          Figure 15 Sustainable debt market by region
       0
           2013       2014        2015    2016   2017   2018    2019    2020     2021              1,800
                                                                                                                  Supranationals
100%
                                                                                                                  South America
                                                                                                   1,600
                                                                                                                  Oceania
 90%
                                                                                                                  North America
                                                                                                   1,400
                                                                                                                  Nordics
 80%
                                                                                                                  Middle East
                                                                                                   1,200
 70%                                                                                                              Europe excl. Nordics
                                                                                                                  Asia
                                                                                                   1,000
 60%                                                                                                              Africa
                                                                                          USD bn

 50%                                                                                                800

 40%                                                                                                600

 30%                                                                                                400

 20%
                                                                                                    200

 10%
                                                                                                      0
                                                                                                             2013    2014       2015     2016    2017   2018   2019   2020   2021
  0%
           2013      2014         2015    2016   2017    2018    2019     2020     2021   100%

Source: Bloomberg New Energy Finance 31 December 2021                                       90%

Regional update                                                                             80%

Europe excluding the Nordics retained its market leadership                                 70%
with total new transactions of USD 640.4bn of
                                                                                            60%
sustainability-themed debt in 2021. This is an increase of
80% compared to 2020. The Nordics saw new sustainable                                       50%
bonds and loans worth USD 87.1bn last year (+64% YOY).
                                                                                            40%
Overall, Europe including the Nordics accounted for 44% of
the global sustainable debt market last year – an almost                                    30%

10% decrease compared to 2020.                                                              20%

Rapid growth in other markets explain the relative decline in                               10%
Europe’s market share. Geographic diversification of the
                                                                                               0%
sustainable debt market was driven in 2021 by Asia and                                                     2013     2014    2015       2016     2017    2018   2019   2020   2021
North America, which grew by 178% to USD 298.8bn and
by 166% to USD 357.0bn in new transactions, respectively.                                 Source: Bloomberg New Energy Finance 31 December 2021

                                                                                                                                                                                10
Climate & Sustainable Finance Research 03 February 2022
Corporate sector update However, data for 2021 suggests that future growth will be
Sustainable debt transactions by corporations driven by other market segments. The strongest annual
outperformed the general market growth rate and growth last year was recorded in technology reaching USD
increased by 144% in 2021. In total, corporations raised 51bn (+998% YOY), consumer staples with USD 69.1bn
more than USD 714bn in sustainable bonds and loans last (+538% YOY), materials with USD 76.9bn (+255% YOY)
year. and consumer discretionary achieving USD 69-1bn in
sustainable bonds and loans (+253% YOY). Notable
Figure 16 Corporate sustainable debt market by industry
transactions in these sectors include a sustainability-linked
800
Utilities
loan of USD 5bn by HP, a USD 1.75bn performance-based
Technology loan by Mexican construction company Cemex, and
700
Materials Walmart inaugural green bond of USD 2bn.
Industrials
600 Health care
Energy
Use of proceeds
500 Consumer staples
Green Bonds
Consumer discretionary
USD bn
Communications
Green bonds recorded another record-breaking year with
400
USD 619.45bn in new issuance in 2021. This means that
300
the green bond segment retained its traditional role as the
locomotive of the sustainable debt market last year.
200
Figure 17 Green bond market by sector
100 700
ABS/MBS/Project
Corporates
0 600
2013 2014 2015 2016 2017 2018 2019 2020 2021 Financials
SSA
100%
500
90%
400
80%
USD bn
70% 300
60%
200
50%
40% 100
30%
0
2013 2014 2015 2016 2017 2018 2019 2020 2021
20%
100%
10%
90%
0%
2013 2014 2015 2016 2017 2018 2019 2020 2021 80%
Source: Bloomberg New Energy Finance 31 December 2021 70%
The utility sector continued to take the largest share of the 60%
corporate sustainable debt market with 24%, reaching USD
50%
175bn in new transactions (+88% YOY). Sustainability-
linked loans by Enel, Dominion Energy and Evergy worth 40%
USD 11.9bn, USD 6bn and USD 2.5bn, respectively, made 30%
up the top three in this segment. Furthermore, energy and
20%
industrials, two other sectors which have historically been
responsible for major share of sustainable debt also 10%
increased last year to USD 89.7bn (+109%) and USD
0%
75.2bn (45%). 2013 2014 2015 2016 2017 2018 2019 2020 2021
Source: Bloomberg New Energy Finance 31 December 2021
11Climate & Sustainable Finance Research 03 February 2022
The largest single issuance of green bonds came from more than in 2020. Like in the first year of the Covid-19
sovereign issuers. In October last year, the European Union pandemic, sovereigns and supranational continue to lead
issued its first and the world’s largest green bond ever this market. The EU alone issued a total of USD 60.4bn in
worth EUR 12bn (USD 13.8bn). This bond, received more social bonds last year, followed by France’s social security
than 135 billion euros of demand, was issued to fund the debt reimbursement fund Caisse d'Amortissement de la
EU’s Covid-19 recovery program Next Generation Europe. Dette Sociale (CADES) with USD 43.1bn.
Thirty percent of the EU's up to EUR 800bn pandemic
As the world slowly emerges from the pandemic, sovereign
recovery scheme will go climate and environmental action.
issuances of social bonds are likely to stagnate in 2022. It
This will make the EU the largest green bond issuers for the
remains to be seen if corporates can fill the gap.
foreseeable future.
Sustainability Bonds
Social Bonds Sustainability bonds saw USD 184bn of new issuance in
Social bonds had witnessed a sudden explosion in 2020 as
2021, up 149% from the year before. Similar to the social
governments and supranational financial institutions
bond segment, this market is dominated by sovereign
scrambled to deal with the economic fallout of lockdowns
issuers which take 56%, followed by financial institutions
and to spur development and production of vaccines.
claiming 25% and corporates taking the remaining 19%.
Figure 18 Social bond market by sector The World Bank was the largest of issuers with cumulative
250 USD 39bn in new issuance of sustainability bonds in 2021.
Corporates
Financials Figure 19 Sustainability bond market by sector
SSA
200 200
Corporates
180 Financials
SSA
150 160
USD bn
140
100 120
USD bn
100
80
50
60
40
0
2013 2014 2015 2016 2017 2018 2019 2020 2021
20
100%
0
90% 2014 2015 2016 2017 2018 2019 2020 2021
100%
80%
90%
70%
80%
60%
70%
50%
60%
40%
50%
30%
40%
20%
30%
10%
20%
0%
2013 2014 2015 2016 2017 2018 2019 2020 2021
10%
Source: Bloomberg New Energy Finance 31 December 2021
0%
2014 2015 2016 2017 2018 2019 2020 2021
Surprisingly, the market for social bonds continued to grow
strongly in 2021, reaching USD 213.4bn which is 42% Source: Bloomberg New Energy Finance 31 December 2021
12Climate & Sustainable Finance Research 03 February 2022
Green Loans Performance-based
Note on data: The green loan market is a private market with
limited access to information. We use the loans listed in Sustainability-linked bonds (SLBs)
Bloomberg New Energy Finance which we think provides a 2021 has without a doubt been the year of sustainability-
good reflection of the overall market. linked bonds. Last year saw a total of USD 108.6bn in
performance-based bonds – almost nine times the amount
Green loans have been the problem child of the sustainable issued in 2020. Since corporates account for almost 90% of
debt market. While the overall sustainable market more this market, we focus our analysis on this segment
than doubled last year, green loans remained at almost the
same level as 2020 with USD 88.8bn in new transactions. Figure 21 Corporate sustainability-linked bond market
120
Notably, figures for 2021 and 2020 are both below the Utilities
record of USD 93.7bn set in 2019. Furthermore, the market Technology
for sustainable loans increased by 133% in 2021, with 100 Materials
Industrials
growth coming exclusively from sustainability-linked loans.
Health care
Together, this suggests that green loans, at least for the 80 Energy
moment, have reached a plateau and that new borrowers Consumer staples
from increasingly hard-to-abate sectors prefer Consumer discretionary
USD bn
60
performance-based borrowing over pure-play green loans. Communications
Figure 20 Green loan market by sector
40
100
SSA
90 Financials 20
Corporates
80
70 0
2018 2019 2020 2021
60 100%
USD bn
50 90%
40 80%
30 70%
20 60%
10 50%
0 40%
2013 2014 2015 2016 2017 2018 2019 2020 2021
100% 30%
90% 20%
80% 10%
70% 0%
2018 2019 2020 2021
60%
Source: Bloomberg New Energy Finance 31 December 2021
50%
Utilities raised USD 23.1bn in new capital through
40% sustainability-linked bonds in 2021, taking more than a fifth
30%
of the total market. Notable transactions included a total of
ten performance-based bonds by utility company Enel
20%
worth USD, 12.1bn and the first sustainability-linked bond in
10% India’s energy sector by Adani Transmission's Entity Adani
Electricity Mumbai worth USD 0.3bn.SLBs also appeared to
0%
2013 2014 2015 2016 2017 2018 2019 2020 2021
be particularly popular among companies in materials (USD
20bn), industrials (USD 16.6bn, technology (USD 2.6bn),
Source: Bloomberg New Energy Finance 31 December 2021
healthcare (USD 5.4bn), consumer discretionary (USD
12.9bn and consumer staples (USD 13.6bn).
13Climate & Sustainable Finance Research 03 February 2022
Sustainability-linked loans (SLLs)
100%
2021 has also been a breakout-year for sustainability-
linked loans which recorded USD 329.65bn in new 90%
transactions and more than 203% in YOY growth. Utilities, 80%
industrials, and energy companies claimed more than 50%
70%
market share in 2020, but the performance-based loan
market diversified considerably last year. 60%
In 2021, companies in the consumer discretionary sector 50%
led the market with USD 54.5bn of transactions, followed 40%
by consumer staples with USD 44.3bn, materials with USD
30%
46.55bn and utilities with USD 13.4bn. Notable
transactions include a EUR 1.3bn sustainability-linked 20%
revolving credit facility by Volvo Cars and an amendment to 10%
ArcelorMitall’s USD 5.5bn revolving credit facility.
0%
Figure 22 Corporate sustainability-linked loan market 2017 2018 2019 2020 2021
350 Source: Bloomberg New Energy Finance 31 December 2021
Utilities
Technology
300 Materials
Currency analysis
Industrials
Last year provided clear evidence that sustainable debt has
Health care
250
Energy become mainstream. Taken together, sustainability-themed
Consumer staples bonds claimed 11.7% of the EUR-denominated debt in
Consumer discretionary
200 2021 up from 6.5% in 2020, 11.9%of the GBP market up
USD bn
Communications
from 1.5%, 11% of the AUD market up from 2%, and
150 21.3% of the SEK market up from 16.2%.
The share of sustainable bonds of the total market also
100
increased in the USD denominated market from 0.8% in
2020 to 2.1 in 2021, and from 0.2% to 0.9% in the CNY
50
market.
0
2017 2018 2019 2020 2021
Figure 23 Green, social, sustainability and sustainability-linked issuances as % of total bond issuance
25%
20%
15%
10%
5%
0%
2017 2018 2019 2020 2021
USD AUD GBP CAD NOK JPY SEK EUR CNY
Source: Bloomberg New Energy Finance 31 December 2021
14Climate & Sustainable Finance Research 03 February 2022
Denmark’s green government bond gets large The trade and liquidity in the green bond is furthermore
‘greenium’ supported by existing initiatives established for
Written by Claus Hvidegaard, Head of FI Research Denmark at conventional government bonds which includes
SEB, claus.hvidegaard@seb.dk and Henrik Arp from Fixed participation in the government’s asset lending-
Income Research Denmark at SEB, henrik.arp@seb.dk arrangement like the government’s other government
bonds. In addition, Nationalbanken must always ensure that
On Wednesday 19 January 2022, the first Danish green
the total outstanding of green bonds, including security
government bond was introduced at auction in shape of the
lending does not exceed the amount of green expenses.
green Twin-bond-edition 0% DGB’31 GRN (992437) of the
existing “conventional” 0% DGB’31 (992419). As stated in At the opening-auction, the green DGB’31 sold with a
the comprehensive presentation material behind the first greenium of 5.2bps against its twin bond. This was larger
Danish green government bond, the bond is issued than earlier experiences had suggested.
according to the government bond’s Green Bond Figure 25 The development in Green premium in German
Framework which is classified ad as Dark Green shading green DBR vs twin-government bonds
and in accordance with the EU-taxonomy. At the same time,
10
the framework is expected to be in accordance with
proposals for EU’s coming Green Bond Standard. The 9
issuance volume is determined in the Finance Act with the 8
amount of qualified green expenses being an upper ceiling
7
and due consideration of the general issuance strategy.
Green premiums, bps
6
The Danish issuance follows the ”Twin Bond”-concept which
5
means that the green bond on all core data matches an
equivalent conventional bond, here DGB’31, like Germany’s 4
green program. And like the German setup, Nationalbanken 3
will offer a switch of the green bond to a conventional bond
2
in the scale of 1:1 which in reality puts a floor under the
1
green premium of 0bps like the German concept. But in
practice, the switch activity will hardly be attractive for the 0
Sep-20 Dec-20 Mar-21 Jun-21 Sep-21 Jan-22
coming investors in DGB’31 GRN who are expected to pay a
DBR'30 GRN DBR'25 GRN DBR'50 GRN DBR'31 GRN
green premium unless other conditions warrant the need for
switching DGB’31 GRN to the more liquid conventional Source: SEB Fixed Income Research
DGB’31.
An obvious comparison is the experience from the German
Figure 24 The green opening premium in DKK, EUR and
green government issuance which looks like the Danish
SEK govies over the last couple of years
green setup especially with the twin-bond-concept. Here,
6 the green government bonds were introduced during Q3
Jan-22
2020 where the first 10-year green twin-bond DBR’30 GRN
5 opened on a premium of 1.6bps (lower yield) vs the
conventional DGB’30. However, in the secondary market,
the 10-year German green bond is successively indicated
Green premiums at opening
4
Sep-21 around 5-7bps more expensive in terms of lower yield than
the conventional bond and is currently traded in the
3 May-21
secondary market in approx. 5-6bps in green premium.
Subsequently, the 5-year GRN 2025 Twin-bond opened in
2
Sep-20 November 2020 on an initially green premium around
Sep-20 Sep-20 Nov-20 1.2bps. In May 2021, the 30-year green government bond
1 DBR-50 GRN opened on an initial YTM equivalent to 2.7bps
below the conventional twin-bond DBR’50 and in
0 September 2021, the green version of DBR’31 opened on a
10Y GRN 10Y GRN 20Y GRN 5Y GRN 30Y GRN 10Y GRN 10Y GRN
DBR'30 SGB NLG DBR DBR'50 DBR'31 DGB'31 green premium of approx. 3.5bps in order to clear around
(SWED)
2.5bps recently in the secondary market.
Source: SEB Fixed Income Research
15Climate & Sustainable Finance Research 03 February 2022
In the issuance strategy for 2022, the German Finanz Since the opening, Riksbanken has purchased SEK 1.95bn
agency has announced a total sale of green German (equivalent to 9.8% of outstanding) and have paid the 4-
government bonds for 12-5bn EUR this year like the volume 5bps below the benchmark-curve. This is still the applicable
in 2021, which will be distributed on 4.5bn EUR in the two level in the price indications in the secondary market. NDO
respective 10-year GRN DBR 30/31 at auction, a in Sweden have not issued since the fall of 2020 but in their
syndicated sale of 3bn EUR in DBR’50 GRN in Q2 2022 and guidelines for this year, it looks like there might be an
the opening of a new 5-year GRN 2027 in Q3 2022 as twin issuance of green government bonds.
bond to BOBL 10/27.
Also, in France, Belgium and Spain there has been an
Figure 26 Green premiums in the 20-year Dutch and 10- issuance of green government bonds like Ireland and
year Swedish government issuance Austria and possibly more countries are expected to
7
introduce green government bonds during this year.
DKK market especially hungry for green assets?
6
While the initial green premium on DGB’31 GRN was higher
5 than in other government bond issuance, it was in line with
other developments on the Danish bond market, suggesting
Green premiums, bps
4
the DKK market has a particular appetite for green assets.
3 In Danish mortgage bonds, where the autumn has seen
issuance of especially green floaters take off and reach
2
almost DKK 25bn since September 2021, the secondary
1
pricing versus non-GRN floaters from the same capital
center and with same maturity have shown rising green
0 premiums from 1-2bps to most recently 4-6bps. The
interest in ESG-compliant assets is present in the market,
-1
May-19 Aug-19 Nov-19 Mar-20 Jun-20 Sep-20 Dec-20 Mar-21 Jun-21 Sep-21 Jan-22 but probably also supplemented by other investment
NLG GRN 20Y SGB (SWED) GRN 10Y objectives in the current market for short investment
mandates
Source: SEB Fixed Income Research, Bloomberg
Figure 27 The green premiums in the floater-market (vs
In the Netherlands, where they do not use the twin-bond-
non-GRN) have been strongly increasing
concept, already in the spring of 2019 there was an
issuance of the first green EUR-denominated government 7
bond 0.5% Nether 01/40 Green which cleared 2bps tighter 6
than the interpolated yield in the duration point from the 5
other conventional Dutch government bonds. As in the other 4
bps
markets, the green premium has been more expensive 3
throughout the last year in the secondary market but has 2
recently declined a few points to approx. 2-3bps currently 1
in the secondary market. This year, there is a prospect of 0
Oct-21 Nov-21 Dec-21 Jan-22
further issuance in the existing 20Y NLG 2040 of 5bn EUR FLT CB NDA GRN 07/24 premium vs. non-green FLT CB RD GRN 07/24 premium vs. non-green
in the Dutch government debt strategy. FLT CB NYK GRN 07/24 premium vs. non-green
In the Nordic markets, Sweden began with their first green Source: SEB Fixed Income Research
government bond issuance already in September 2020 It is rare that foreign investors issue bonds in DKK but in
where there was an issuance of SEK 20bn 1 September January, two international SSA-issuers have issued bonds in
2020 in 0.125% 2030 (XS2226974504). The syndicated DKK for a total of DKK 3bn: But what is the background for
issuance (with conditions approved by Riksbanken) was issuers issuing in DKK? And should we expect a larger
opened with a clearing equivalent to approx. 1bps below supply of this kind of issuances?
the conventional SGB-curve with bit-to-cover of 2.4,
In January 2022, the Nordic Investment Bank issued an 8-
distributed over 72 investors. The bond is a part of the
year DKK-bond and KfW have issued a bond matching the
purchase-range at Riksbanken included in the Swedish QE-
maturity of DGB’24. Both issuances have been green bonds.
program.
The green stamp seems to be an important factor in regard
to the demand for DKK-bonds.
16Climate & Sustainable Finance Research 03 February 2022
If we also look at where EUR-denominated SSAs typically Figure 28 EUR SSA indicative greeniums in the secondary
are cleared in the secondary market right now the price market
indications seem to be a green-premium structure of 6
approx. 0-3bps vs non-Green.
5
This has caused the SSAs with further green issuance-
opportunities to having an opportunity to issue in DKK. Since
Green premiums vs. conv., bps
4
matching of issuer- and investor-interest currently seems to
require a green issuance, we don’t expect that the first
3
issuances will indicate a greater wave of highly rated
issuers issuing in DKK.
2
1
0
0 5 10 15 20 25
-1
MOAD
KfW EIB
Source: SEB Fixed Income Research
17Climate & Sustainable Finance Research 03 February 2022
Moving beyond climate – Nature and biodiversity come into the
spotlight in 2022
Susanne Gløersen
Deputy Head of Sustainable Banking Norway
susanne.gloersen@seb.no
Gregor Vulturius, PhD
Advisor, Climate & Sustainable Finance
gregor.vulturius@seb.se
Sustainability is more than climate. Experts have stressed There is also increasing concern about the macro-economic
that conservation and restoration of natural carbon sinks is impacts of nature and biodiversity loss and the systemic-
vital to achieving the Paris Agreement1. But while the risk companies and investors face. IPBES (an
understanding of how corporates and investors can intergovernmental research body similar to IPCC for
manage climate risks has matured, awareness about the climate research) has estimated that land degradation
necessity of protecting and restoring nature and currently costs more than 10% of global GDP each year6.
biodiversity is still low. This is about to change as industry- Furthermore, the Dutch Central Bank has concluded that
driven initiatives and corporate action on nature-related financial institutions in the country have EUR 510bn in
risks and opportunities are gaining momentum. exposure to biodiversity risks.
Figure 29 Top 10 global risks severity the next 10 years
Nature and biodiversity loss pose increasing
and systemic risk for investors and companies
A pathbreaking review of the economics of biodiversity
released last year found that natural capital has declined
by 40% between 1992 and 20142. According to the World
Wildlife Funds (WWF) we have seen a 68% decline from
1970 to 2016 of different species such as mammals, birds
and reptiles3 – leading experts to believe that we are at the
precipice of the worlds “Sixth extinction” 4.
According to World Economic Forum (WEF), the loss of
biodiversity is one of the largest financial risks, topping the
list together with climate risk and natural disasters. Half of
global GDP – USD 44tn – consists of companies that are
moderately to highly dependent on nature and its services
to produce their goods5. Thus, they are also highly exposed
to the financial impact of biodiversity loss, reduction in Source: World Economic Forum Global Risks Report 2022
natural capital and weakening of ecosystem services.
1
Paris climate goals unattainable without rich biodiversity and ecosystems - Stockholm Resilience Centre
2
Final Report - The Economics of Biodiversity: The Dasgupta Review - GOV.UK (www.gov.uk)
3
Living Planet Report 2020 | Official Site | WWF (panda.org)
4
The Sixth Extinction: An Unnatural History, by Elizabeth Kolbert (Henry Holt) - The Pulitzer Prizes
5
WEF_New_Nature_Economy_Report_2020.pdf (weforum.org)
6
IPBES secretariat
18Climate & Sustainable Finance Research 03 February 2022
The double materiality of nature-related risks A large share of the global economy is either directly or
and opportunities indirectly impacted by nature and biodiversity10. Aside
Companies can both cause and suffer from the loss of from the food and agriculture, other sectors that are
biodiversity and nature. For instance, the food sector has exposed to nature-related risks – due to their dependence
and impact on nature – include forestry, fishery,
been the primary driver of nature and biodiversity loss over
aquaculture, hydropower, biomass-based heating, health
at the least the past 50 years according to the UN7. At the
sector, mining, oil and gas, real-estate or the textile
same time, food companies are highly dependent on
industry11. Financial institutions are indirectly exposed to
pollination for the sourcing of raw materials, and they are
the impacts on e.g. deforestation caused by their
hence vulnerable to the loss of pollinators as more than investees12.
75% of crops globally are dependent on pollination8.
Corporates’ impact and dependency on nature and Like the climate crisis, this is not only a story about risk.
biodiversity can result in nature-related risks. These risks Large global sustainability challenges also represent large
can be classified as9: business and investment opportunities. Protecting and
restoring nature is no exception. According to WEF,
• Physical risk arising from damage to infrastructure transactions enabling a “nature positive economy” could
and disruption of operations that can be either acute generate up to USD 10.1tn in annual business value and
(e.g. flooding) or “chronic” (e.g. drought) create 395 million jobs by 2030. For example, circular
• Regulatory and legal risk relate to laws, policies, business models and products – which only stand for 8.6%
regulations, and court actions lead to unexpected costs of the global economy13 – represent large opportunities for
of (non-)compliance and stranded assets companies.
• Market risk emerge from changing customer
preferences, purchaser requirements and financing
Action on nature and biodiversity is gaining
conditions that increase the cost and availability of momentum
Despite – or because of – the glooming state of the global
resources and capital
environment, we see an increased focus from the business
• Reputational risk relates to the public image of a
and investor community regarding the need to halt and
company and could result in a loss of sales
reverse nature and biodiversity loss. This is exemplified by
• Financial risk is an outcome of nature-related risks
a range of industry-driven initiatives and coalitions, such as
and affects business (e.g. increased cost of financing)
“We are Nature” and “Finance for Biodiversity Pledge” or
and financial institutions (e.g. loss of investment value)
the Taskforce for Nature-related Financial Disclosure
Figure 30 High level framework illustrating nature (TNFD)14. The TNFD will provide companies and investors
related risk to business with a framework to assess, manage and report on nature-
related financial risks and opportunities. Furthermore, CDP
will request information on forests and water security from
financial institutions from this year.
Together these collaborations and standards will support
companies and investors in their efforts to measure and
manage their exposure to nature and biodiversity risks and
in their development of new business ideas.
At the political stage, countries are expected to reach an
agreement on new goals for the protection and restoration
of biodiversity at the Fifteenth Meeting of the Conference
Source: WWF of the Parties to the Convention on Biological Diversity
(CBD COP15) which will conclude in May this year.
7
Our global food system is the primary driver of biodiversity loss (unep.org)
8
Why bees matter (fao.org)
9
The Nature of Risk | WWF (panda.org)
10
Nature is too big to fail | WWF (panda.org)
11
Nature is too big to fail | WWF (panda.org)
12
Trase Insights - Storebrand Asset Management deforestation risk assessment
13
CGR 2021 (circularity-gap.world)
14
TNFD – Taskforce on Nature-related Financial Disclosures
19Climate & Sustainable Finance Research 03 February 2022
Already in 2020, the EU published its biodiversity strategy, Tying action on nature and biodiversity to
aiming to be the most ambitious region accelerating the financing
efforts of reversing nature and biodiversity loss and As more and more companies set nature and biodiversity
achieving over time restoration15. targets, one can expect several of these targets to be tied
New international targets for nature and biodiversity to companies’ financing. This expectation is based on the
protection and restoration alongside better frameworks to rapid expansion of performance-based financing over the
understand and manage nature-related risks will increase last few years. Incorporating environmental targets into
expectations for companies and investors to set their own sustainability-linked bonds and loans is a way for
targets – like we have seen with the array net-zero targets companies to bolster their commitment to these targets
following the Paris agreement. The Science Based Targets and to share this commitment publicly with investors and
for Nature (SBTN) will offer companies a methodology to other stakeholders.
set such targets16 – and companies have started to set Investors will also increasingly address the systemic
targets. financial risk associated with nature and biodiversity loss in
Ørsted and Equinor for example, have come out with so- their portfolios. Asset owners and managers may act on
called “net nature positive targets”, moving beyond only these issues through active ownership, voting, and by
reducing their negative impact on nature but also restoring integrating nature and biodiversity risk and opportunities in
nature and biodiversity. During COP26, we also saw 95 investment analysis, valuations, and investment decisions.
large UK companies coming out stating they have These actions will be informed by the ever-improving
committed to net nature positive targets. On the asset access to data on investee’s exposure and management of
owner side, the Norwegian Pension Fund has set nature and biodiversity-related risk and opportunities18.
expectations how investee companies should take During the Covid-19 pandemic financial markets have
biodiversity and sustainable use of ecosystems into played a crucial role in making sure capital for vaccine
account in their business activities17. research and production was front-loaded and made
readily available. Similarly, financial institutions have the
capacity to support innovators and corporations in
protecting and restoring nature and biodiversity and in
taking advantage of new business opportunities.
Figure 31 Key terms
Biodiversity - The variability among living organisms from all sources including, inter alia, terrestrial, marine, and other
aquatic ecosystems and the ecological complexes of which they are part; this includes diversity within species, between
species and of ecosystems”
Ecosystem – A natural unit consisting of all the plants, animals, and microorganisms (biotic) factors in a given area,
interacting with all of the non-living physical and chemical (abiotic) factors of this environment.
Ecosystem services and functions – The contributions that ecosystems make to human well-being, including
provisioning services, regulating and maintenance services, and cultural services. Ecosystem services result from
ecosystem functions like biomass production, nutrient cycling, or water dynamics.
Nature – The natural world with all naturally occurring living and non-living entities that together comprise ecosystems
and deliver ecosystem services.
Natural capital – The stock of renewable and non-renewable natural assets (e.g. ecosystems) that yield a flow of
benefits to people (i.e. ecosystem services).
Source: Final Report - The Economics of Biodiversity: The Dasgupta Review - GOV.UK (www.gov.uk)
15
Biodiversity strategy for 2030 (europa.eu)
16
Guidance highlights – Science Based Targets for Nature
17
New expectation document on biodiversity and ecosystems (nbim.no)
18
E.g. the Trase Platform offers data-driven insights into the exposure of financial institutions to deforestation risks
20You can also read