THE HIGH MARGIN PRECIOUS METALS COMPANY - April 2022 Corporate Presentation
←
→
Page content transcription
If your browser does not render page correctly, please read the page content below

THE HIGH MARGIN
PRECIOUS METALS COMPANY

April 2022
Corporate Presentation
CAUTIONARY STATEMENTS
CAUTIONARY NOTE REGARDING FORWARD-LOOKING STATEMENTS
The information contained in this Presentation contains “forward-looking statements” within the meaning of the United States Private Securities
Litigation Reform Act of 1995 and “forward-looking information” within the meaning of Canadian securities legislation. There can be no assurance that
forward-looking statements will prove to be accurate, as actual results and future events could differ materially from those anticipated in such
statements.

Readers are strongly cautioned to carefully review the cautionary notes to this Presentation and in particular:

Note 1 at the end of this Presentation contains our cautionary note regarding forward-looking statements and sets out the material assumptions and
risk factors that could cause actual results to differ, including, but not limited to, fluctuations in the price of commodities, estimation of production,
estimation of mineral reserves and resources, the commencement, timing and achievement of construction, expansion or improvement projects by
Wheaton Precious Metal’s counterparties at Mining Operations, the impact of the COVID-19 virus pandemic, outcome of any audits by the CRA of
Wheaton Precious Metal’s tax filings, the absence of control over mining operations from which Wheaton Precious Metal purchases precious metals or
cobalt, and risks related to such mining operations and continued operation of Wheaton Precious Metal’s Counterparties. Readers should also consider
the risks identified under “Description of the Business – Risk Factors” in Wheaton’s Annual Information Form for the year ended December 31, 2020
and the risks identified under "Risks and Uncertainties" in Wheaton’s Management's Discussion and Analysis (“MD&A”) for the year ended December
3, 2021, both available on SEDAR and in Wheaton’s Form 40-F and Wheaton’s Form 6-K filed March 10, 2022, all available on EDGAR. Where
applicable, readers should also consider any updates to such “Risks and Uncertainties” that may be provided by Wheaton in any subsequently filed
quarterly MD&A.

Note 2 at the end of this Presentation contains our cautionary note regarding the presentation of mineral reserve and mineral resource estimates.

The full presentation is available on Wheaton’s website (www.Wheatonpm.com). All values referenced on the presentation are in US dollars unless
otherwise noted. In accordance with Wheaton Precious Metals™ Corp.’s (“Wheaton Precious Metals”, “Wheaton” or the “Company”) MD&A and
financial statements, reference to the Company includes the Company’s wholly owned subsidiaries.

                                                                                                                                                        2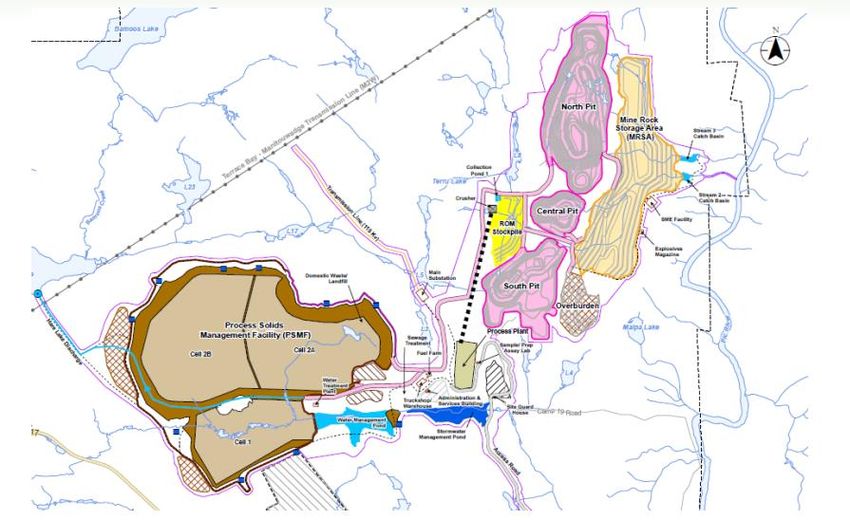
WHO IS WHEATON PRECIOUS METALS?
WHEATON PRECIOUS METALS
A MODEL DESIGNED TO BENEFIT ALL STAKEHOLDERS

   Our Vision         To be the world’s premier precious metals investment vehicle.

  Our Mandate         To deliver value through streaming to all of our stakeholders:
                                                   .

   To our Shareholders,               To our Partners,              To our Neighbours,
 by delivering low risk, high     by crystallizing value for      by promoting responsible
quality, diversified exposure      precious metals yet to      mining practices and supporting
  and growth optionality to             be produced             the communities in which we
       precious metals                                                 live and operate

                                                                    Wheaton Precious Metals   4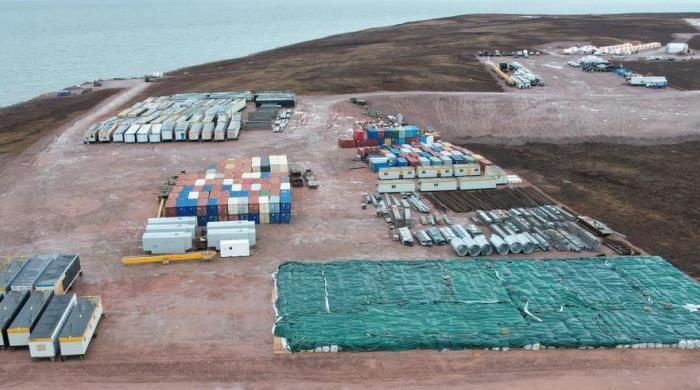
WHEATON’S STREAMING ADVANTAGE
THE SUSTAINABLE OPTION FOR PRECIOUS METAL INVESTING
                                                                                                                   EXPLORATION &
HIGH QUALITY ASSETS                                                                                             EXPANSION UPSIDE
Ninety percent of Wheaton’s current                                                                        High-margin assets receive the benefit
production comes from high-margin mines                                                                      from mine exploration and expansion
operating in the lowest half of their cost curve                                                            activities typically at no additional cost

                                                                                                                       COMMODITY
PREDICTABLE COSTS                                                                                                  PRICE LEVERAGE
                                                         LOW            WITH      HIGH                     Investors get leverage to the underlying
Contractually defined cost per ounce
typically protects streamers from                        RISKS                   UPSIDE               commodities as delivery payments per ounce
inflationary cost pressures                                                                            are pre-determined and made upon delivery

INNOVATIVE DIVIDEND                                                                                                         OPTIONALITY
Dividend policy provides shareholders a minimum                                                              Development projects not included in
floor payment while giving direct exposure to                                                                guidance have the potential of adding
Wheaton’s growth and commodity prices 11                                                                               >200,000 GEOs per year30

                                                   SUSTAINABLE FOUNDATION
                                                   Wheaton is committed to long-term sustainability

                                                                                                        Wheaton Precious Metals                     5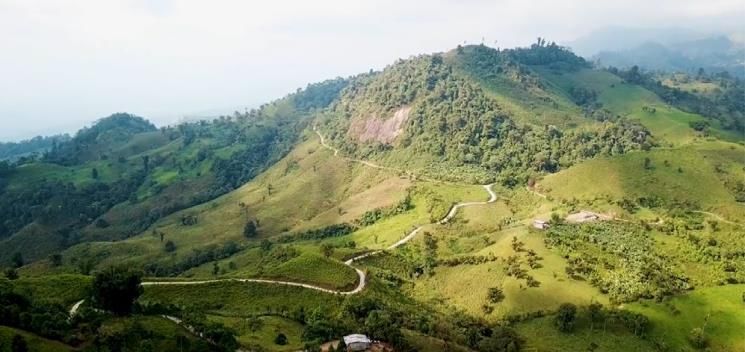
WHEATON PRECIOUS METALS
                    A YEAR OF GROWTH                                                                                                                   Leadership in sustainability:
                                     Strong corporate development momentum:
                              9 new streams and ~$1.5 bn in deals over the last 16 months                                                              • Commitment to Net-Zero Carbon
                                                                                                                                                         Emissions by 2050
                     Projects                                    Avg. GEO’s** produced per
                                                 Stream                                                                                                • Establishment of Climate Fund
                     (Partners)                                    year (5-year est.*)(koz)
RECENT HIGHLIGHTS

                     Cozamin                                                                                                                           • MSCI: “AA” (Upgrade from “A”)27
                                                                              Silver                                          11.4
                     (Capstone)
                                                                                                                                                       • Sustainalytics: #1 for Precious Metals and
                     Santo Domingo                                                                                                                       ESG Global 50 Top Rated Company28
                                                                               Gold                                           37.5
                     (Capstone)
                     Fenix                                                                                                                             Significant dividend growth leads to
                                                                               Gold                                            5.5
                     (Rio2)                                                                                                                            index inclusion:
                     Blackwater
                                                                        Gold & Silver                                         32.7
                     (Artemis)                                                                                                                         • Total dividends paid in 2021 increasing by
                     Marathon                                                                                                                            over 35% from 2020
                                                                     Gold & Platinum                                          23.8
                     (Generation Mining)
                     Curipamba                                                                                                                         • S&P/TSX Canadian Dividend Aristocrats
                                                                        Gold & Silver                                         24.7                       Index
                     (Adventus)
                     Goose Project
                                                                               Gold                                           11.7                     Notable changes to R&R in 2021
                     (Sabina)
                     Marmato Project
                                                                        Gold & Silver                                         +7.5                     • Increase in Proven & Probable Mineral
                     (Aris)(amendment)***
                                                        Total                                                                154.8                       Reserves by 13% on a GEO basis
                     *Based on the first 5 full years of production. Source information can be pulled from Wheaton Precious Metals news releases and
                     partners technical documents                                                                                                      • 20% increase in gold Reserves alone
                     ** $1,800 / ounce gold, $24 / ounce silver, $1000 / ounce platinum
                     ***Total Avg. GEO’s produced per year is ~ 22k GEO’s. Amendment accounts for ~ 34% of total GEO’s 35

                                                                                                                                                           Wheaton Precious Metals           6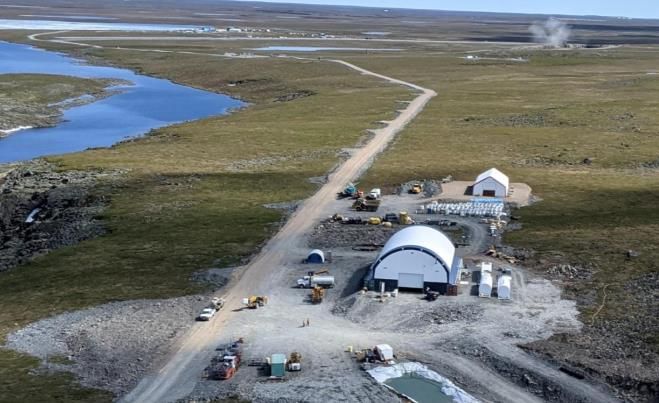
HIGH QUALITY ASSET BASE
DIVERSIFIED PORTFOLIO OF HIGH-QUALITY ASSETS                                                                          Partners:
                                                                                                                          Vale
                          Operating Mines (23)                                    Development Projects (13)            Glencore
                                                                                                                       Newmont
                  Keno Hill        Back River                                                                           Barrick
        Minto                                                                                                      Sibanye-Stillwater
                         Kutcho                                                         Zinkgruvan
                                                           Voisey’s Bay                                              Pan American
            Blackwater              777                                                                                  Lundin
                                  Marathon       Sudbury
                                                Coleman                    Aljustrel                                 First Majestic
                    Stillwater                  Copper Cliff                                                            Equinox
                    East Boulder                Creighton                                                               Artemis
                                                Garson                        Neves-Corvo
                 Rosemont
                                     Peñasquito Totten
                                                                                                                        Hudbay
                  San Dimas          Cozamin    Victor (Dev. project)                                                  Capstone
                                     Los Filos                                                                         Eldorado
                                                                                                                    Gran Colombia
                                       Marmato              Toroparu                                                    Sabina
                                  Curipamba                                                                            Aris Gold
                                                   Antamina       Salobo                                                 Alexco
                                    Yauliyacu
                                                      Constancia                                                          Rio2
                                    Cotabambas                                                                         Adventus
                                                       Santo Domingo                                               Generation Mining
                                                       Pascua-Lama                                                  Kutcho Copper
 Corporate Offices (2)                                 Fenix                                                            Panoro
                                                       Navidad                                                        Pembridge
                                                                                                                         Almina
                                                       Well-diversified with low political risk
                                                                                                     Wheaton Precious Metals        7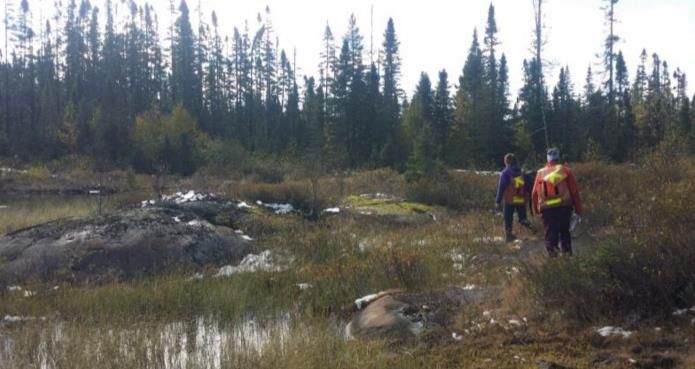
HIGH QUALITY ASSET BASE
LOW COST, LONG LIFE PRODUCTION
      2022 Forecast Production                                                Mine Life of Operating Portfolio1,2,3
         by Cost Quartile1,3
                                                                       70

                                                                       60
                 5%
                                                                       50                                          19

                                                   Mine Life (years)
           10%
                                                                       40
                          37%                                                                       11
                                                                       30

                                                                       20
                                        First                                      29
           48%                                                         10
                                        Second
                                        Third                           0
                                        Fourth                              Proven & Probable   Measured &       Inferred
                                                                                                 Indicated

  85% of Wheaton’s production comes from assets that fall in the lowest half of the cost curve,
    and the portfolio has over 29 years of mine life based on Proven and Probable Reserves

                                                                                                Wheaton Precious Metals     8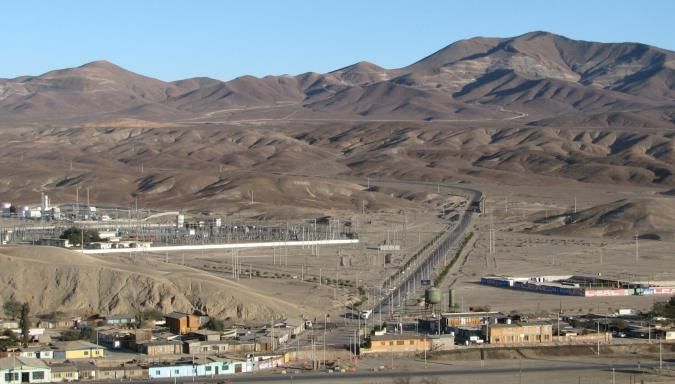
HIGH QUALITY ASSET BASE
                                     LONG TERM PRODUCTION OUTLOOK
                                         1,200                                                       Average Annual Production Guidance29:
1,4

                                                 2020 Actuals   2021 Actuals   2022 Guidance                                                                  Optionality
Gold Equivalent Production (GEO) (Koz)

                                                   GEOs:          GEOs:                GEOs:              5-year Average: 850,000 GEOs
                                         1,000     714Koz         750Koz            700 – 760Koz
                                                                                                          10-year Average: 910,000 GEOs     Stillwater
                                                                                                                Other Metals              Voisey’s Bay
                                                                 49.0 Koz       44 – 48Koz
                                          800      28.4Koz      Other Metals                                                                Marathon
                                                                                Other Metals
                                                 Other Metals                                                                                Salobo
                                                                                                                                          Constancia
                                          600                                                                                              San Dimas
                                                                   343.0
                                                                                                                    Gold
                                                    367.4                           350 – 380
                                                                                                                                            Sudbury
                                                                  Koz Au
                                                   Koz Au                            Koz Au                                                 Stillwater
                                          400                                                                                                Others
                                                                                                                                          Peñasquito
                                          200                      26.0                                                                   Constancia
                                                   22.9                              23 – 25
                                                                                                                    Silver
                                                  Moz Ag
                                                                  Moz Ag                                                                   Antamina
                                                                                     Moz Ag                                                 Other
                                            0
                                                   2020A          2021A              2022E                           2026E                          2031E     Optionality 30

                                                                           Silver                  Gold             Other Metal               Optionality
                                                         Wheaton forecasts 20% growth in production for 10-year annual average
                                                                                                                                             Wheaton Precious Metals        9
CASH OPERATING COSTS
                   PREDICTABLE COSTS AND HIGH MARGINS
                                         Total Cash Cost and Cash Operating Margins per Ounce1,5,6,7
                        $2,500
Gold Price (US$/0z)

                        $2,000
                        $1,500
                                                                                                                   76%    74%
                                          81%    79%                                                       70%
                        $1,000                           72%     69%     66%     69%     69%       68%
                                 75%
                         $500
                                 $300     $300   $362    $386    $386    $393    $391    $395      $409    $421    $426   $462       $444
                           $0
                                 2010     2011   2012    2013    2014    2015    2016    2017      2018    2019    2020   2021    2022-
Silver Price (US$/0z)

                          $40                                                                                                     2026E
                          $30
                          $20             88%    87%                                                                      77%
                                 81%                     83%     78%                                              75%
                          $10                                            73%     74%     74%      70%     69%
                           $0    $3.97   $3.99   $4.06   $4.12   $4.14   $4.17   $4.42   $4.49    $4.67   $5.02   $5.28   $5.66   $5.25
                                 2010     2011   2012    2013    2014    2015    2016    2017     2018    2019    2020    2021    2022-
                                                                                                                                  2026E
                                                         Total Cash Cost/oz                      Cash Operating Margins

                                                                                                           Wheaton Precious Metals     10
STRONG BALANCE SHEET
AMPLE CAPACITY TO CONTINUE GROWING
Cash Flow % Increase
Au Price Ag Price
$9,000 Balance Sheet as of December 31st , 20211 Sensitivity to from Base
$US/oz $US/oz
Commodity Price Case
$8,000
65% 50% $2,700 $36.00
$7,000
45% 35% $2,430 $32.40
$6,000 26% 20% $2,160 $28.80
Millions ($US)
$5,000 13% 10% $1,980 $26.40
$4,000
Base Case
$3,000 Gold @ $1,800 ~$1 billion in average
Silver @ $24.00 annual operating cash
$2,000 Palladium @ $2,100 flows generated at spot
Cobalt @ $33.00 commodity prices
$1,000
$0
Revolving Credit Cash Immediate Est. Op. Cash Flow 9
Facility Capacity (Rolling 5-yr forecast)
Cash flow sensitivities indicate a 50% increase in commodity prices
will result in a 65% increase to cash flows
Wheaton Precious Metals 11MARGINS AND CASH FLOW
OPTIONALITY TO HIGHER COMMODITY PRICES
Operating Cash Flow (Million US$) 19,21
$1,000 $1,000
$900 Over $2 billion of operating cash $900
$800
flow in excess of Wheaton’s original $800
Gold Equivalent Sales (koz)
expectation during the last upswing
$700 in the commodity prices cycle $700
$600 $600
$500 $500
Excess Cash Flow
$400 $400
$300 $300
Initial Cash Flow Estimate
$200 $200
$100 $100
$0 $0
2004 2005 2006 2007 2008 2009 2010 2011 2012 2013 2014 2015 2016 2017 2018 2019 2020 2021
GEO Sales Actual Stream Cash Flow Initial Stream Cash Flow Estimate Gold Price
Wheaton’s 2021 sales volumes are 85 percent higher than in 2012
during the prior high commodity price cycle
Wheaton Precious Metals 12INNOVATIVE AND SUSTAINABLE DIVIDEND11
▪ Quarterly Dividend Policy
• Dividends linked to operating cash flows Quarterly Dividend Declared
whereby approximately 30% of the average of
the previous four quarters’ operating cash flows
$0.15
$0.15
$0.15
are distributed to shareholders
$0.14
$0.16
•
$0.13
A floor of $0.15/share per quarter has been set
$0.12
for 2022 $0.14
Dividend per share ($US)
$0.10
$0.10
• Declared first quarterly dividend of 2022 of $0.12
$0.15/share, representing a 15% increase from $0.10
prior year
$0.08
▪ Benefits
$0.06
• Direct precious metals price exposure with
participation in robust organic production growth $0.04
• Sustainable and flexible $0.02
• ~$1.5 billion declared in dividends since $-
inception Q1'20 Q2'20 Q3'20 Q4'20 Q1'21 Q2'21 Q3'21 Q4'21
Declared dividend of $0.15/share represents a 15% increase relative to Q4 2020
13BENEFITS TO PARTNER MINING COMPANIES
PRECIOUS METALS STREAMING
THE BENEFITS TO THE PARTNER MINING COMPANY
                                                       Stream         Debt            Equity
Non-dilutive form of funding                            ✓               ✓
Initial value creation for both parties                 ✓
Improves project IRR                                    ✓
Crystalize future production of mining partner          ✓
Contractual relationship means support & flexibility    ✓
Endorses technical merits of mine / project             ✓
Share production and operating risk                     ✓                                ✓
Expedited due diligence & closing process               ✓                                ✓
No fixed payments                                       ✓                                ✓
                                                                Benefits to Mining Companies   15
PRECIOUS METALS STREAMING
THE BENEFITS TO THE PARTNER MINING COMPANY
Initial Value Creation
Opportunity exists to The market values
create value for both precious metal in a
parties Value of Future streaming company’s
Precious Metal portfolio greater than
Value of Future Stream precious metal produced
Precious Metal by a traditional miner
Production
Traditional Miner Streaming Company
Salobo Example22
Improves IRRs
The upfront payment
$1,158 contributes a larger
78% portion of capex than the
$863M
stream represents as a
percentage of revenue
23%
Upfront payment Stream as a % Vale's capex net of Vale's 2021 EBITDA
as a % of capex of mine EBITDA WPM's upfront payments from Salobo
Benefits to Mining Companies 16BENEFITS TO THE COMMUNITY
SUSTAINABILITY
A CORE VALUE

           Wheaton delivers sustainable, long-term value from
                 both a business and social perspective

                          Community                                  External &
       ESG Due                               Strong Policies
                          Investment                                  Voluntary
       Diligence                              & Practices
                           Programs                                 Commitments

          Wheaton has undertaken a broad range of sustainability initiatives and
            significantly increased disclosure around ESG risk management
                                                                   Benefits to the Community   18
COMMUNITY INVESTMENT PROGRAM
MAKING AN IMPACT
HEALTH EDUCATION ENVIRONMENT COMMUNITY
Community Investment Budget
(1.5% of average net income of previous four years)
(0.5%) (1%)
Local CSR Partner CSR
(Vancouver & Cayman) (Mining Communities)
Wheaton was the first streaming company with a formal community investment program
Benefits to the Community 19RECOGNITION FOR SUSTAINABILITY PERFORMANCE
▪ Top-rated among ESG analysts
▪ Rated an “AA” by MSCI ESG Research (upgraded from “A” in September 2020)27
▪ Ranked #1 for Precious Metals by Sustainalytics ESG Risk Ratings28
▪ Ranked in the Global Top 50 out of over 12,000 companies across sectors by Sustainalytics
▪ Classified as “Prime” by ISS ESG Corporate Rating
▪ Included within the Euronext Vigeo World 120 Indice powered by Vigeo Eiris
▪ Commitment to Net-Zero Carbon Emissions by 2050
▪ Engagement with our mining partners to encourage the emissions targets to support a 1.5° C trajectory at their operations
▪ Establishment of a fund to support our partners' efforts towards renewable energy sources and / or reduce emissions.
WPM made a $4 million initial commitment, representing 1% of its average net income of the previous four years
▪ Signatory to the World Gold Council’s Responsible Gold Mining Principles
▪ First streaming company to join UN Global Compact
Benefits to the Community 20WHY INVEST IN WHEATON PRECIOUS METALS?
THE WORLD’S PREMIER PRECIOUS METALS INVESTMENT
                                                           Other                         Precious Metal
                                           Wheaton       Streamers      Bullion / ETFs       Miners

>95% of revenue from precious metals17      ✓                                 ✓                 ?

No capital cost exposure                    ✓                ✓

No operating cost exposure12                ✓                ✓

Exploration upside
                                            ✓                ✓                                 ✓

Highly diverse asset base
                                            ✓                ✓

Sustainable dividend
                                            ✓                ?

Leverage to commodity prices
                                            ✓                ✓                                 ✓

                 Wheaton has a high-quality stream portfolio and is the only streamer with
                        >95% of revenue exposed to precious metals production
                                                              Why Invest in Wheaton Precious Metals?   22
WHEATON VERSUS OTHER STREAMERS
PRECIOUS METALS LEADING REVENUE GENERATION
2021 Revenue Mix by Streamer13,17
Total $1,201M
Total $1,300M PM’s $1,181M
$1,400 PM’s $996M
Total $605M
$1,200 PM’s $505M
$46
$1,000
$72
$173 $573
$800
$600 98%
$59
77%
$400 $751
83% $562
$200 $446
$0
Royal Gold Franco Nevada Wheaton
Gold Silver PGM Other Oil & Gas
Wheaton’s 2021 revenue was 98% precious metals (with the remaining 2% coming from cobalt).
Wheaton has the highest revenue generated from precious metals relative to our peers.
Why Invest in Wheaton Precious Metals? 23WHEATON’S TRACK RECORD
AS OF DECEMBER 31, 2021
Over $10 Billion invested in streams23
~$8.4 Billion of cash flow generated to date24
>$1.5 billion declared in dividends to date11
Strong annual cash flows expected at current commodity prices25
>40 years of reserve and resource mine life remaining1,2,3
High ratings recognizing Wheaton’s dedication to sustainability27,28
~20% average annualized after-tax return from the portfolio26
Why Invest in Wheaton Precious Metals? 24CONSISTENTLY OUTPERFORMED GOLD AND SILVER
Total Average Rolling Multi-Year Return Comparison as of February 11, 202214
200%
Average Total Return
150%
100%
50%
0%
-50% 1-Year 3-Year 5-Year 10-Year
Gold Silver Philadelphia Gold & Silver Index (XAU) VanEck Vectors Gold Miners ETF (GDX) Wheaton
Wheaton’s strong track record has resulted in consistently returning value to shareholders
Why Invest in Wheaton Precious Metals? 25WHEATON PRECIOUS METALS
IF YOU LIKE PRECIOUS METALS, WHEATON CHECKS ALL THE BOXES
Cost predictability
Significant expansion & exploration potential
High quality asset base
Long-life operations
Leverage to increasing precious metals prices
Dedication to sustainability
Innovative dividend
Why Invest in Wheaton Precious Metals? 26CONTACT
INVESTOR RELATIONS CONNECT WITH US
Tel: 604-684-9648 @Wheaton_PM
Toll Free: 1-844-288-9878
Email: info@wheatonpm.com @WheatonPM
TRANSFER AGENT @Wheaton Precious Metals Corp.
AST Trust Company (Canada)
Toll Free: 1-800-387-0825
International: 1-416-682-3860
Email: inquiries@astfinancial.com
www.wheatonpm.com
TSX: WPM NYSE: WPM LSE: WPM 27APPENDIX AND ENDNOTES
COMPANY ACQUISITION HISTORY
         Silver Wheaton (SLW)                                             Timeline Since Inception16
             Begins Trading

             2004               2005                2006                2007                      2008                2009                  2010                  2011              2012

          1) San Dimas                        4) Yauliyacu        5) Stratoni              7) Keno Hill              8-11) Silverstone 13) Rosemont                            14) Constancia
          2) Los Filos                                            6) Peñasquito                                      12) Barrick                                                   Silver
          3) Zinkgruvan                                                                                                                                                        15) 777
                                                                      Silver Stream       Gold & Silver Stream          Gold Stream
                                                                                                                                                    Production Payment                           Date of
                                                             Location            Upfront                     Attributable Production                                             Term of
        Precious Metal Interest        Mine Owner                                                                                                    as of Sep 30, 20211                         Original
                                                              of Mine          Consideration                    Silver       Gold                                               Agreement
                                                                                                                                                      Silver       Gold                         Contract
 1     San Dimas                       First Majestic        Mexico        $                             25% paid in gold           25%                            $618         Life of Mine    15-Oct-04
 2     Los Filos                          Equinox            Mexico        $          4,463                  100%                    0%              $4.53                       25 years       15-Oct-04
 3     Zinkgruvan                          Lundin            Sweden        $         77,866                  100%                    0%              $4.46                      Life of Mine    8-Dec-04
                                                                                                         100% up to 1.5Moz,
 4     Yauliyacu                         Glencore              Peru        $        285,000                                           0%             $8.982                     Life of Mine    23-Mar-06
                                                                                                             then 50%
 5     Stratoni                        Eldorado Gold         Greece        $         57,500                   100%                    0%             $11.543                    Life of Mine     23-Apr-07
 6     Peñasquito                        Newmont             Mexico        $        485,000                    25%                    0%              $4.29                     Life of Mine     24-Jul-07
 7     Keno Hill                          Alexco             Canada        $         50,000                    25%                    0%            Variable4                   Life of Mine     2-Oct-08
8-11   Silverstone Resources                                                                                                                                                                    21-May-09
                                                                                                                              100% up to 30Koz,
 8       Minto                          Pembridge            Canada        $         54,805                   100%                then 50%
                                                                                                                                                     $4.31        variable25    Life of Mine    20-Nov-08
 9       Neves-Corvo                      Lundin             Portugal      $         35,350                   100%                    0%             $4.38                       50 years        5-Jun-07
10       Aljustrel                        Almina             Portugal      $          2,451                   100%5                   0%          50% of spot26                  50 years        5-Jun-07
11       Navidad (Loma de La Plata)    Pan American          Argentina     $         43,2896                  12.5%                   0%             $4.00                      Life of Mine       n/a7
                                                               Chile/
12     Barrick - Pascua-Lama              Barrick                                                              25%                    0%             $3.90                      Life of Mine     8-Sep-09
                                                             Argentina
                                                                                              9
13     Rosemont                           Hudbay                US         $        230,000                   100%                 100%              $3.90          $450        Life of Mine    10-Feb-10
14     Constancia10,11                    Hudbay               Peru             $     429,900                 100%                 50%
         Constancia Silver                                                      $     294,900                 100%                                                  $6.08
         Constancia Gold                                                        $     135,000                                       50%                                             $412
15     77711                              Hudbay             Canada             $     455,100                 100%                  50%                             $6.32           $429

                                                                                                                                                                                      Appendix         29
COMPANY ACQUISITION HISTORY
Silver Wheaton Becomes Wheaton Precious Metals™ (WPM)
2013 2014 2015 2016 2017 2018 2019 2020 2021 2022
16) Salobo I 16) Salobo II 20) Cotabambas 21) Kutcho 22) Voisey’s Bay 24) Marmato 25) Cozamin 30) Curipamba
17) Sudbury 19) Antamina 16) Salobo III 23) Stillwater (amended in 2022) 26) Santo Domingo 31) Back River
14) Constancia Gold 27) Fenix
18) Toroparu 28) Blackwater
29) Marathon
Silver Stream Gold & Silver Stream Gold Stream Other Stream Gold & PGM Stream
Production Payment Date of
Precious Metal Location of Upfront Attributable Production As of Sep 30, 20211 Term of Original
Interest Mine Owner Mine Consideration Silver Gold Other Silver Gold Other Agreement Contract
16 Salobo12 Vale Brazil $ 3,059,360 0% 75% $412 Life of Mine 28-Feb-13
Salobo I $ 1,330,000 0% 25% 28-Feb-13
Salobo III $ 900,000 0% 25% 2-Mar-15
Salobo III13 $ 829,360 0% 25% 2-Aug-16
17 Sudbury14 Vale Canada $ 623,572 0% 70% $400 20 years 28-Feb-13
Coleman, Copper Cliff, Garson, Stobie, Creighton, Totten and Victor gold interests
18 Toroparu15 Gran Colombia Guyana $ 153,500 50% 10% $3.90 $400 Life of Mine 11-Nov-13
19 Antamina16,17 Glencore Peru $ 900,000 33.75% 0% 20% of Spot Life of Mine 3-Nov-15
20 Cotabambas18,19 Panoro Peru $ 140,000 100% 25% $5.90 $450 Life of Mine 21-Mar-16
21 Kutcho20,21 Kutcho Copper Canada $ 65,000 100% 100% 20% of Spot 20% of Spot Life of Mine 15-Dec-17
22 Voisey’s Bay Cobalt22 Vale Canada $ 390,000 42.4% / 21.2% 18% of Spot Life of Mine 11-Jun-18
23 Stillwater23 Sibanye-Stillwater USA $ 500,000 100% 4.5% / 2.25% / 1% 18% of Spot 18% of Spot Life of Mine 16-July-18
24 Marmato24 Aris Gold Colombia $ 110,000 100% 10.5% 18% of Spot 18% of Spot Life of Mine 05-Nov-20
25 Cozamin27 Capstone Mexico $ 150,000 50% 10% of Spot Life of Mine 19-Feb-21
26 Santo Domingo28 Capstone Chile $ 290,000 100% 18% of spot Life of Mine 24-Mar-21
27 Fenix29 Rio2 Chile $ 50,000 6% 18% of Spot Life of Mine 16-Nov-21
28 Blackwater30 Artemis Canada $ 441,000 8% 50% 18% of Spot 18% of Spot Life of Mine 13-Dec-21
29 Marathon31 Generation Mining Canada $ 240,000 100% 22% 18% of Spot 18% of Spot Life of Mine 22-Dec-21
30 Curipamba32 Adventus Mining Ecuador $ 175,500 75% 50% 18% of Spot 18% of Spot Life of Mine 17-Jan-22
31 Back River – Goose33 Sabina Canada $ 125,000 4.15% 18% of Spot Life of Mine 08-Feb-22
Appendix 30COMPANY ACQUISITION HISTORY
NOTES TO TIMELINE
1. Subject to an annual inflationary adjustment with the exception of Loma de La Plata and Sudbury.
2. Should the prevailing market price for silver or gold be lower than this amount, the per ounce cash payment will be reduced to the prevailing market price, with the exception of Yauliyacu where the per ounce cash payment
will not be reduced below $4.24 per ounce, subject to an annual inflationary factor.
3. In October 2015, in order to incentivize additional exploration and potentially extend the limited remaining mine life of Stratoni, Wheaton Precious Metals and Eldorado Gold agreed to modify the Stratoni silver purchase
agreement. The primary modification is to increase the production price per ounce of silver delivered to Wheaton Precious Metals over the current fixed price by one of the following amounts: (i) $2.50 per ounce of silver
delivered if 10,000 meters of drilling is completed outside of the existing ore body and within Wheaton Precious Metals' defined area of interest (“Expansion Drilling”); (ii) $5.00 per ounce of silver delivered if 20,000 meters of
Expansion Drilling is completed; and (iii) $7.00 per ounce of silver delivered if 30,000 meters of Expansion Drilling is completed. Drilling in all three cases must be completed by December 31, 2020, in order for the agreed
upon increase in production price to be initiated.
4. In March 2017, the Company amended its silver purchase agreement with Alexco Resource Corp. (“Alexco”) to make the production payment a function of the silver head grade and silver spot price in the month in which the
silver is produced. In addition, the area of interest was expanded to include properties currently owned by Alexco and properties acquired by Alexco in the future which fall within a one kilometer radius of existing Alexco
holdings in the Keno Hill Silver District. As consideration of the amendments, Alexco issued 3,000,000 shares to Wheaton Precious Metals.
5. Wheaton Precious Metals only has the rights to silver contained in concentrate containing less than 15% copper at the Aljustrel mine.
6. Comprised of $11 million allocated to the silver interest upon the Company’s acquisition of Silverstone Resources Corp. in addition to a contingent liability of $32 million, payable upon the satisfaction of certain conditions,
including Pan American receiving all necessary permits to proceed with the mine construction.
7. Definitive terms of the agreement to be finalized.
8. The Barrick transaction also included streams on Lagunas Norte, Pierina, Veladero which expired on March 31, 2018 The upfront consideration is net of the $373 million cash flows received relative to silver deliveries from
the Lagunas Norte, Veladero, and Pierina mines.
9. The upfront consideration is currently reflected as a contingent obligation, payable on an installment basis to partially fund construction of the Rosemont mine once certain milestones are achieved, including the receipt of key
permits and securing the necessary financing to complete construction of the mine.
10. Gold recoveries will be set at 55% for the Constancia deposit and 70% for the Pampacancha deposit until 265,000 ounces of gold have been delivered to the Company. Should there be a delay in achieving completion or
mining the Pampacancha deposit beyond the end of 2018, Wheaton Precious Metals would be entitled to additional compensation in respect of the gold stream.
11. Subject to an increase to $9.90 per ounce of silver and $550 per ounce of gold after the initial 40 year term.
12. Vale has completed the expansion of the mill throughput capacity at the Salobo mine to 24 million tonnes per annum (“Mtpa”) from its previous 12 Mtpa. If actual throughput is expanded above 28 Mtpa within a
predetermined period, and depending on the grade of material processed, Wheaton Precious Metals will be required to make an additional payment to Vale based on a set fee schedule ranging from $113 million if
throughput is expanded beyond 28 Mtpa by January 1, 2036, up to $953 million if throughput is expanded beyond 40 Mtpa by January 1, 2021.
13. Upfront payment consisted of $800 million cash & the amendment of the 10mil Wheaton Precious Metals common share purchase warrants previously issued to Vale in connection with the Sudbury precious metal purchase
agreement which expire on Feb. 28, 2023 to reduce the strike price from $65 to $43.75 per common share. The amendment to these warrants was valued at $29 million using a Black-Scholes option pricing model.
14. Includes Coleman, Copper Cliff, Garson, Stobie, Creighton, Totten & Victor gold interests. Upfront payment consisted of $570 million cash plus 10 million Wheaton Precious Metals common share purchase warrants with a
$65 strike and 10 year term.
15. Comprised of $16 million paid to date and $138 million to be payable on an installment basis to partially fund construction of the mine. Following the delivery of certain feasibility documentation or after December 31, 2017 if
the feasibility documentation has not been delivered to Wheaton Precious Metals by such date, Wheaton Precious Metals may elect not to proceed with the agreement or not pay the balance of the upfront consideration and
reduce the gold stream percentage from 10% to 0.909% and the silver stream percentage from 50% to nil. If Wheaton Precious Metals elects to terminate, Wheaton Precious Metals will be entitled to a return of the amounts
advanced less $2 million which is non-refundable on the occurrence of certain events. If Wheaton Precious Metals elects to reduce the streams, Gran Colombia may return the amount of the deposit already advanced less
$2 million to Wheaton Precious Metals and terminate the agreement.
Appendix 31COMPANY ACQUISITION HISTORY
NOTES TO TIMELINE
15. Glencore owns 33.75% of the Antamina mine through a joint venture. Wheaton Precious Metals is entitled to Glencore’s portion of the silver production.
16. Once the Company has received 140 million ounces of silver under the Antamina agreement, the Company’s attributable silver production to be purchased will be reduced to 22.5%.
17. Comprised of $4.75 million paid to date, $9.25 million which is payable on an installment basis spread out over a period of up to eight years and $126 million payable on an installment basis to partially fund construction of
the mine once certain conditions have been satisfied.
18. Once 90 million silver equivalent ounces attributable to Wheaton Precious Metals have been produced, the attributable production to be purchased will decrease to 66.67% of silver & 16.67% of gold production for the life
of mine.
20. Comprised of $7 million as an early deposit, payable in 2018. The balance of the $65 million would be payable in instalments during construction of the Kutcho Project.
21. Once 5.6 million ounces of silver and 51,000 ounces of gold have been delivered, the stream will decrease to 66.67% of the silver and gold production for the life of the mine.
22. Stream is effective January 1, 2021. Once 31 million pounds of cobalt are delivered, the stream drops to 21.2% of cobalt for the life of mine. Production payment is set at 18% of the cobalt spot price until the value of the
upfront cash consideration is reduced to zero, then the production payment is 22% of the cobalt spot price.
23. Stream is effective July 1, 2018. Wheaton will be entitled to an amount of palladium equal to: 4.5% of Stillwater palladium production up to 375 Koz: 2.25% of Stillwater palladium production between 375 Koz to 550 Koz
delivered: and 1% of Stillwater palladium production thereafter for the life of mine. Production payment is set at 18% of the gold and palladium spot price until the value of the upfront cash consideration is reduced to zero,
then the production payment is 22% of the gold and palladium spot price
24. Under the amended terms of the Marmato PMPA, Wheaton will purchase 10.5% of the gold production until 310,000 ounces have been delivered, after which the gold stream drops to 5.25% of the gold production for the
life of mine. This increases the gold stream from the original Marmato PMPA under which Wheaton was entitled to purchase 6.5% of the gold production until 190,000 ounces were delivered, after which the stream was to
drop to 3.25% of the gold production.The silver stream remains unchanged from the original Marmato PMPA The Company has amended the Minto PMPA such that the per ounce cash payment per ounce of gold
delivered will be 75% of the spot price of gold for each ounce of gold delivered under the Minto PMPA. This amended pricing will end on the earlier of (i) 14 months after the first delivery is due; or (ii) once 11,000 ounces of
gold have been delivered to the Company. Once this amended pricing ends, the per ounce cash payment per ounce of gold delivered will be $325, subject to an increase in periods where the market price of copper is
lower than $2.50 per pound.
25. 50% of amounts received under concentrate sales agreements.
26. Wheaton is entitled to 50% of silver production until 10 Moz have been delivered, thereafter dropping to 33% of silver production for the life of the mine.
27. Wheaton is entitled to 100% of the silver production until 285 thousand ounces have been delivered, thereafter dropping to 67% of payable gold production for the life of the mine. Wheaton International will make ongoing
payments for gold ounces delivered equal to 18% of the spot gold price until the value of gold delivered less the cumulative Production Payments is equal to the upfront consideration of US$290 million, at which point the
Production Payment will increase to 22% of the spot gold price. Closing of the transaction is expected to occur shortly following announcement and is subject to the completion of certain corporate matters and customary
conditions.
28. Under the terms of the proposed PMPA, the Company will acquire 6% of the gold production until 90,000 ounces have been delivered and 4% of the gold production until 140,000 ounces have been delivered, after which
the stream drops to 3.5% for the life of mine. In return, Wheaton International will make ongoing delivery payments equal to approximately 18% of the spot price until the value of gold delivered less the production payment
is equal to the upfront consideration of $50 million, at which point the production payment will increase to 22% of the spot gold price.
29. Wheaton will be entitled to receive 8% of the payable gold production until 279,908 ounces have been delivered, thereafter dropping to 4% of payable gold production for the life of the mine. Under the Silver Stream,
Wheaton will be entitled to receive 50% of the payable silver production until 17.8 million ounces ("Moz") have been delivered, thereafter dropping to 33% of payable silver production for the life of the mine.
30. Wheaton will purchase 100% of the payable gold production until 150 thousand ounces ("koz") have been delivered, thereafter dropping to 67% of payable gold production for the life of the mine and 22% of the payable
platinum production until 120 koz have been delivered, thereafter dropping to 15% for the life of mine.
31. Wheaton will purchase: (i) 50% of the payable gold production referenced from Curipamba, dropping to 33% for the life of mine once 150,000 ounces of refined gold have been delivered; and (ii) 75% of the payable silver
production referenced from Curipamba, dropping to 50% for the life of mine once 4.6 million ounces of refined silver have been delivered. Wheaton will make ongoing payments per ounce delivered equal to 18% of the spot
prices until the value of gold and silver delivered less the Production Payment is equal to the Deposit, at which point the Production Payment will increase to 22% of spot prices
32. 4.15% of the payable gold production from the Mine dropping to 2.15% of the payable gold production from the Mine after delivery of 130,000 ounces of gold and dropping to 1.5% of the payable gold production from the
Mine after delivery of 200,000 ounces of gold.
Appendix 32STREAMING THROUGHOUT THE CYCLE
SOME DAYS YOU REAP, SOME DAYS YOU SOW…
(amended in 2022)
Santo Domingo
Curipamba/ Goose
Spot Gold Prices vs. Long-Term Analyst Consensus18
Cozamin
Salobo 1/Sudbury
Stillwater Gold &
Constancia Ag
$2,500 $60
Blackwater
Kutcho
Marmato
Voisey's Bay Cobalt
Marathon
Toroparu
777 Au & Ag
Constancia Gold
Barrick / Pascua Lama
Cotabambas
Palladium
Silverstone
$50
Keno Hill
$2,000
Salobo 3
San Dimas & Los Filos
Antamina
Salobo 2
Peñasquito
Rosemont
$40
Silver Price (US$)
Gold Price (US$)
Stratoni
Yauliyacu
$1,500
Zinkgruvan
$30
$1,000
$20
Gold / Silver Price
$500
LT Consensus Gold / Silver Price $10
$0 Growth Harvest Recapitalize Growth? 1 $0
2004 2005 2006 2007 2008 2009 2010 2011 2012 2013 2014 2015 2016 2017 2018 2019 2020 2021 2022
Streaming Cycle looks to be re-entering growth phase
Appendix 33GROWTH
SANTO DOMINGO – ASSET OVERVIEW1
Operator Capstone Mining Corp.
Location Atacama Region, Chile
Stream Gold
Date of Contract March 24, 2021
Term of Stream1 Life of Mine
100% of gold(Au) production until 285 Koz have
Stream Parameters1 been delivered, thereafter dropping to 67% of Au
production for the life of the mine.
Upfront Consideration1 $290M
Delivery Payment / oz1 18% of spot gold
Fully permitted, construction scheduled to
Status commence in late 2021 with production forecast for
2024
First-quartile copper project with long mine life provides additional near-term growth opportunity
Appendix 34GROWTH
FENIX GOLD PROJECT – ASSET OVERVIEW1
Operator Rio2 Limited
Location Chile (North east of Copiapo)
Stream Gold
Announced July 20, 2021 (subject to customary
Date of Contract conditions, including negotiation of definitive
documentation)
Term of Stream1 Life of Mine
6% of Au until 90koz, 4% of Au until 140koz, 3.5% of
Stream Parameters1
Au thereafter
Upfront Consideration1 $50M in two equal installments
18% of spot gold until upfront deposit repaid,
Delivery Payment / oz1
22% of spot gold thereafter
Receipt of EIA approval outstanding. First gold
Status
production forecast for Q4, 2022.
Photo Source: Rio2 website
Near-term growth opportunity with strong production expansion potential
Appendix 35GROWTH
BLACKWATER GOLD PROJECT – ASSET OVERVIEW1
Operator Artemis Gold Inc.
Location Canada
Stream Silver & Gold
Date of Contract December 13, 2021
Term of Stream1 Life of Mine
50% of Ag until 17.8 Moz, thereafter 33% for life of
Stream Parameters1 mine, & 8% of Au until 279 koz thereafter 4% for life of
mine
For Au stream: Wheaton has paid New Gold $300M
Upfront Consideration1 For Ag stream: Wheaton will pay Artemis total $141M,
payable in four equal installments during construction
35% of spot gold price
Delivery Payment / oz1 18% of spot silver equal to the upfront cash
consideration, 22% of spot silver thereafter
Major construction to commence in Q2 of 2022, with
Status
production commencing in the Q1 of 2024. Photo Source: Artemis website
Further enhances and diversifies Wheaton's existing portfolio of low-cost, high-quality, long-life mines.
Appendix 36GROWTH
MARATHON PROJECT – ASSET OVERVIEW1
Operator Generation Mining Limited
Location Canada
Stream Gold & Platinum
Date of Contract December 22 2021
Term of Stream1 Life of Mine
100% of Au until 150koz, thereafter 67% for life of
Stream Parameters1 mine, & 22% of Pt until 120koz thereafter 15% for
life of mine
C$240M in C$40 million paid prior to construction.
Upfront Consideration1 Remainder payable in four staged installments
during construction
18% of spot until upfront deposit repaid,
Delivery Payment / oz1
22% of spot thereafter
Status Expected production start date: Q3 2024
Photo Source: Generation Mining Website
Recently projected to have one of the lowest operational carbon footprints of any mine in the world, once producing.
Appendix 37GROWTH
CURIPAMBA PROJECT – ASSET OVERVIEW1
Operator Adventus Mining Corporation
Location Ecuador
Stream Gold & Silver
Date of Contract January 17 2022
Term of Stream1 Life of Mine
50% of the payable Au dropping to 33% for the LOM
once 150 koz have been delivered and 75% of the
Stream Parameters1
payable Ag dropping to 50% for the LOM once 4.6
Moz have been delivered.
$175.5M. $13M of which is available pre-
construction and $500K US of which will be paid to
Upfront Consideration1
support certain local community development
initiatives around Curipamba
18% of spot until upfront deposit repaid,
Delivery Payment / oz1
22% of spot thereafter
Status Expected production start date: 2024
Photo Source: Adventus Mining Website
Forecasted to be a high quality, low-cost mine with significant exploration potential
Appendix 38GROWTH
BACK RIVER – GOOSE PROJECT – ASSET OVERVIEW1
Operator Sabina Gold & Silver Corp.
Location Nunavut, Canada
Stream Gold
Date of Contract February 8, 2022
Term of Stream1 Life of Mine
4.15% of the Au production dropping to 2.15% of the
Au production after delivery of 130koz of Au and
Stream Parameters1
dropping to 1.5% of the Au production from the Mine
after delivery of 200koz of Au
$125M in four equal installments during construction
Upfront Consideration1 of the Goose Project, subject to customary
conditions.
18% of spot until upfront deposit repaid,
Delivery Payment / oz1
22% of spot thereafter
Status Expected production start date: Q1 2025
Photo Source: Sabina Website
The Goose Project is forecast to be a high margin mine in the lowest half of the gold cost curve with a 15-year mine life
Appendix 39SHARES
CAPITAL STRUCTURE AS OF DECEMBER 31, 2021
Weighted average number of shares outstanding:
Basic: 449.5 million
Diluted15: 450.8 million
3 Month Average Daily Trading Volume:
TSX: 0.9 million shares
NYSE: 1.9 million shares
Appendix 40REVENUE EXPOSURE
HIGHLY DIVERSIFIED PORTFOLIO
2022-2026E Revenue Mix1,4
Cobalt PlatinumMARGINS AND CASH FLOW
STRONG CASH FLOW GENERATION DRIVEN BY COST CERTAINTY
Operating Cash Flow, Production Payment, G&A and Other Costs5,6,7
$1,400
$1,202
$1,200 $1,096
$1,000 $892
$850 $843 $861
Millions ($US)
$794
$800 $730 $706
$620 $649
$600
$423
$400
$239
$167
$200
$0
2008 2009 2010 2011 2012 2013 2014 2015 2016 2017 2018 2019 2020 2021
Production Payment Interest Cost & Other G&A Operating Cash Flow (before working capital) Revenue
Appendix 42 42STRONG TRACK RECORD OF ORGANIC GROWTH
EXPLORATION AND INFERRED CONVERSION
Reserves and Resources Growth2,8
10.2M GEOs 13.6M GEOs 13.9M GEOs
or 764M SEOs or 1,018M SEOs 15.9M GEOs
or 1,040M SEOs
or 1,193M SEOs
(M&I)
28.4M GEOs
or 2,129M SEOs
(P&P) 23.0M GEOs
or 1,722M SEOs
(P&P)
Total Acquired Total Mined Total Exploration & R&R
Inferred Conversion
Exploration and inferred conversion generated 13.9M GEOs
and significant exploration upside still exists across the stream portfolio
Appendix 43STRONG TRACK RECORD OF ACCRETIVE GROWTH
EXPANSION & GROWTH THROUGH EXPLORATION & ACQUISITIONS
Total attributable gold equivalent R&R per 100 shares since inception2,8
9.0
8.0 M&I P&P Mined
7.0
6.0
Gold Eq oz / 100 share
5.0
4.0
3.0
2.0
1.0
0.0
-1.0
-2.0
-3.0
-4.0
2004
2005
2006
2007
2008
2009
2010
2011
2012
2013
2014
2015
2016
2017
2018
2019
2020
2021
-5.0
Significant growth in reserves and resources per share since inception
Appendix 44CHANGES TO RESERVES AND RESOURCES
Mineral Dec 31, 2020 Dec 31, 2021
Change % Change
Category GEO (Kozs) GEO (Kozs)
Proven and Probable 20,375 22,984 2,609 13%
Measures and Indicated 14,471 15,833 1,362 9%
Inferred 11,297 11,685 388 3%
Wheaton grew Attributable Proven & Probable Reserves by 13% on a GEO basis,
driven by a 20% increase in Attributable Gold Reserves alone!
Wes Carson, Vice President Mining Operations 45ATTRIBUTABLE RESERVES & RESOURCES - GOLD
TOTAL PROVEN & PROBABLE (6)
December 31, 2021 December 31, 2020
Proven Probable Proven & Probable Proven & Probable
Tonnage Grade Contained Tonnage Grade Contained Tonnage Grade Contained Tonnage Grade Contained
Process Recovery
Asset Interest Mt g/t / % Moz / Mlbs Mt g/t / % Moz / Mlbs Mt g/t / % Moz / Mlbs % (7) Mt g/t / % Moz / Mlbs
Gold
Salobo (10) 75% 173.3 0.40 2.23 676.9 0.34 7.38 850.1 0.35 9.60 76% 867.8 0.31 8.59
Stillwater (13) 100% 8.2 0.41 0.11 60.1 0.33 0.63 68.3 0.34 0.74 69% 58.2 0.39 0.73
Constancia 50% 234.5 0.06 0.48 31.8 0.08 0.08 266.3 0.07 0.56 61% 266.3 0.07 0.56
Sudbury (11) 70% 11.4 0.46 0.17 11.4 0.45 0.17 22.8 0.45 0.33 75% 23.8 0.45 0.34
San Dimas (14) 25% 0.5 4.52 0.07 0.5 3.09 0.05 1.0 3.77 0.12 95% 1.0 3.77 0.12
Marmato (11,15) 6.5% 0.1 5.14 0.01 1.2 3.11 0.12 1.3 3.19 0.13 90% 1.3 3.19 0.13
777 50% 0.6 2.23 0.040 0.2 1.86 0.01 0.8 2.13 0.05 58% 0.8 2.13 0.05
Minto 100% - - - - - - - - - 75% 2.4 0.60 0.05
Blackwater (11,28) 8% 19.3 0.74 0.46 0.5 0.80 0.01 19.8 0.74 0.47 91% - - -
Toroparu (12,16) 10% 3.0 1.10 0.10 9.7 0.98 0.31 12.7 1.00 0.41 89% 12.7 1.00 0.41
Santo Domingo (11,26) 100% 65.4 0.08 0.17 326.9 0.03 0.34 392.3 0.04 0.51 61% 392.3 0.04 0.51
Marathon (11,29) 100% 85.1 0.07 0.191 32.6 0.06 0.06 117.7 0.07 0.26 71% - - -
Curipamba (11,30) 50% 1.6 2.83 0.14 1.7 2.23 0.12 3.2 2.52 0.26 53% - - -
Goose (11,31) 4.15% 0.3 5.54 0.06 0.4 6.29 0.09 0.8 5.97 0.14 93% - - -
Kutcho (12) 100% 6.8 0.37 0.08 10.6 0.39 0.13 17.4 0.38 0.21 41% 10.4 0.37 0.12
Fenix (11,27) 6% 3.1 0.51 0.05 3.8 0.47 0.06 6.9 0.49 0.11 75% - - -
Metates Royalty (17) 0.5% 1.4 0.70 0.03 4.1 0.45 0.06 5.5 0.52 0.09 91% 5.5 0.52 0.09
Total Gold 4.39 9.62 14.01 11.71
Appendix 46ATTRIBUTABLE RESERVES & RESOURCES - GOLD
TOTAL MEASURED, INDICATED AND INFERRED
December 31, 2021 (6)
Measured Indicated Measured & Indicated Inferred
Tonnage Grade Contained Tonnage Grade Contained Tonnage Grade Contained Tonnage Grade Contained
Interest Mt g/t / % Moz / Mlbs Mt g/t / % Moz / Mlbs Mt g/t / % Moz / Mlbs Mt g/t / % Moz / Mlbs
Gold
Salobo (10) 75% 22.7 0.17 0.12 329.6 0.25 2.65 352.3 0.24 2.77 201.7 0.29 1.88
Stillwater (13) 100% 15.1 0.40 0.19 19.9 0.39 0.25 35.0 0.39 0.44 113.6 0.34 1.24
Constancia 50% 68.3 0.06 0.12 62.2 0.05 0.10 130.5 0.05 0.22 28.4 0.09 0.08
Sudbury (11) 70% 0.9 0.30 0.01 6.0 0.63 0.12 6.9 0.59 0.13 2.0 0.54 0.03
San Dimas (14) 25% - - - - - - - - - 1.4 3.63 0.16
Marmato (11,15) 6.5% 0.1 5.95 0.02 2.2 2.77 0.19 2.3 2.94 0.22 1.0 2.59 0.08
777 50% 0.1 2.31 0.00 0.0 1.61 0.00 0.1 2.01 0.01 - - -
Minto 100% - - - 11.1 0.53 0.19 11.1 0.53 0.19 13.0 0.49 0.21
Blackwater (11,28) 8% 4.1 0.35 0.05 6.4 0.49 0.10 10.5 0.44 0.15 0.7 0.45 0.01
Toroparu (12,16) 10% 3.5 2.33 0.26 2.3 2.33 0.17 5.8 2.33 0.43 1.4 2.74 0.12
Santo Domingo (11,26) 100% 1.4 0.05 0.00 120.1 0.03 0.11 121.5 0.03 0.12 31.8 0.02 0.03
Marathon (11,29) 100% 19.4 0.08 0.05 66.6 0.06 0.13 86.0 0.07 0.18 22.7 0.05 0.04
Curipamba (11,30) 50% - - - 1.2 1.63 0.06 1.2 1.63 0.06 0.4 1.62 0.02
Goose (11,31) 4.15% 0.0 4.94 0.01 0.1 5.18 0.02 0.2 5.13 0.03 0.2 6.64 0.04
Kutcho (12) 100% 0.4 0.20 0.00 5.0 0.38 0.06 5.4 0.37 0.06 12.9 0.25 0.10
Fenix (11,27) 6% 2.9 0.34 0.03 9.3 0.33 0.10 12.3 0.33 0.13 4.8 0.32 0.05
Cotabambas (12,24) 25% - - - 29.3 0.23 0.22 29.3 0.23 0.22 151.3 0.17 0.84
Brewery Creek Royalty (25) 2% 0.3 1.06 0.01 0.5 1.02 0.02 0.8 1.03 0.03 1.0 0.88 0.03
Metates Royalty (17) 0.5% 0.3 0.23 0.00 0.7 0.23 0.01 1.0 0.23 0.01 0.3 0.32 0.003
Total Gold 0.88 4.50 5.39 4.96
Appendix 47ATTRIBUTABLE RESERVES & RESOURCES - SILVER
TOTAL PROVEN & PROBABLE December 31, 2021 (6) December 31, 2020
Proven Probable Proven & Probable Proven & Probable
Tonnage Grade Contained Tonnage Grade Contained Tonnage Grade Contained Process Recovery Tonnage Grade Contained
Asset Interest Mt g/t / % Moz / Mlbs Mt g/t / % Moz / Mlbs Mt g/t / % Moz / Mlbs % (7) Mt g/t / % Moz / Mlbs
Peñasquito (10) 25% 28.8 38.3 35.4 61.8 31.8 63.1 90.5 33.8 98.5 85% 97.0 34.1 106.4
Constancia 100% 468.9 3.0 45.1 63.6 3.4 7.0 532.5 3.0 52.0 70% 532.5 3.0 52.0
Antamina (11,18) 33.75%
Copper 44.9 7.1 10.2 27.6 8.4 7.5 72.5 7.6 17.7 71% 78.6 7.2 18.3
Copper-Zinc 17.9 13.1 7.5 23.0 14.6 10.8 40.9 14.0 18.4 71% 50.3 12.9 20.8
Zinkgruvan 100%
Zinc 3.1 80.0 7.8 7.2 88.0 20.4 10.3 85.6 28.3 83% 8.8 81.4 23.0
Copper 2.0 32.0 2.1 0.2 35.0 0.2 2.2 32.3 2.3 70% 3.1 30.3 3.0
Neves-Corvo 100%
Copper 4.4 34.0 4.8 20.7 30.8 20.5 25.1 31.4 25.3 24% 29.7 30.2 28.8
Zinc 3.8 69.0 8.4 21.0 62.0 41.8 24.8 63.1 50.2 30% 30.1 62.2 60.3
Yauliyacu (19) 100% 1.1 67.2 2.3 7.0 86.7 19.6 8.1 84.1 22.0 83% 8.2 97.4 25.6
Aljustrel (20) 100% 9.7 47.4 14.8 27.4 46.9 41.4 37.2 47.1 56.2 26% 37.2 47.1 56.2
San Dimas (14) 25% 0.5 367.8 5.6 0.5 295.5 5.0 1.0 329.7 10.6 94% 1.0 329.7 10.6
Cozamin (11,21) 50%
Copper - - - 6.3 44.4 9.0 6.3 44.4 9.0 86% 6.3 44.4 9.0
Zinc - - - 0.7 44.3 1.1 0.7 44.3 1.1 86% 0.7 44.3 1.1
Keno Hill - Underground 25% - - - 0.4 804.3 9.3 0.4 804.3 9.3 96% 0.3 804.5 7.6
Los Filos 100% 26.2 3.5 3.0 78.1 10.2 25.5 104.2 8.5 28.5 10% 104.2 8.5 28.5
Marmato (11,15) 100% 0.8 22.1 0.6 18.9 6.2 3.8 19.7 6.9 4.4 34% 19.7 6.9 4.4
777 100% 1.1 31.4 1.1 0.4 30.0 0.4 1.5 31.0 1.5 45% 1.5 31.0 1.5
Minto 100% - - - - - - - - - 45% 2.4 5.6 0.4
Stratoni 100% - - - - - - - - - 45% 0.6 148.0 2.7
Rosemont (22) 100% 408.6 5.0 66.2 108.0 3.0 10.4 516.6 4.6 76.7 76% 516.6 4.6 76.7
Blackwater (11,28) 50% 161.9 5.8 30.1 4.6 5.8 0.9 166.5 5.8 31.0 61% - - -
Kutcho (12) 100% 6.8 24.5 5.4 10.6 30.1 10.2 17.4 27.9 15.6 46% 9.9 34.6 11.0
Curipamba (11,30) 75% 2.4 41.4 3.1 2.5 49.7 4.0 4.9 45.7 7.1 63% - - -
Metates Royalty (17) 0.5% 1.4 17.2 0.8 4.1 13.1 1.7 5.5 14.2 2.5 66% 5.5 14.2 2.5
Total Silver 254.4 313.5 567.9 550.3
Appendix 48ATTRIBUTABLE RESERVES & RESOURCES - SILVER
TOTAL MEASURED, INDICATED AND INFERRED
December 31, 2021 (6)
Measured Indicated Measured & Indicated Inferred
Tonnage Grade Contained Tonnage Grade Contained Tonnage Grade Contained Tonnage Grade Contained
Interest Mt g/t / % Moz / Mlbs Mt g/t / % Moz / Mlbs Mt g/t / % Moz / Mlbs Mt g/t / % Moz / Mlbs
Silver
Peñasquito (10) 25% 7.9 25.7 6.5 44.2 26.4 37.4 52.0 26.3 43.9 22.5 28.0 20.2
Constancia 100% 136.6 2.3 10.3 124.3 2.2 8.8 260.9 2.3 19.1 56.7 2.9 5.3
Antamina (11,18) 33.75%
Copper 28.5 7.2 6.6 107.8 8.5 29.4 136.2 8.2 36.0 218.2 9.0 63.1
Copper-Zinc 12.2 20.7 8.1 50.5 18.1 29.4 62.7 18.6 37.5 100.5 15.5 50.1
Zinkgruvan 100%
Zinc 3.1 58.2 5.8 8.2 60.0 15.9 11.3 59.5 21.7 14.2 81.0 37.0
Copper 1.8 34.8 2.0 0.3 34.7 0.4 2.1 34.8 2.3 0.2 27.0 0.2
Neves-Corvo 100%
Copper 4.8 51.3 7.9 31.2 50.7 50.9 36.0 50.8 58.8 12.7 34.0 13.9
Zinc 7.0 62.6 14.0 37.7 58.8 71.2 44.6 59.4 85.3 4.1 64.0 8.4
Yauliyacu (19) 100% 5.6 119.7 21.6 7.5 131.2 31.7 13.1 126.3 53.3 12.9 259.9 107.6
San Dimas (14) 25% - - - - - - - - - 1.4 340.7 15.1
Aljustrel (20) 100% 4.3 67.3 9.3 3.9 58.9 7.4 8.2 63.3 16.7 15.7 46.2 23.3
Cozamin (11,21) 50%
Copper 0.2 53.3 0.3 4.5 36.9 5.3 4.7 37.5 5.6 2.0 40.9 2.6
Zinc - - - 2.2 31.2 2.3 2.2 31.2 2.3 2.6 37.5 3.2
Keno Hill 25%
Underground - - - 0.8 490.0 12.1 0.8 490.0 12.1 0.5 494.0 8.2
Elsa Tailings - - - 0.6 119.0 2.4 0.6 119.0 2.4 - - -
Los Filos 100% 88.5 5.3 15.2 133.7 8.1 35.0 222.2 7.0 50.2 98.2 6.1 19.4
Marmato (11,15) 100% 1.3 27.9 1.2 22.8 6.3 4.6 24.1 7.5 5.8 15.4 3.3 1.6
777 100% 0.1 39.0 0.2 0.1 30.7 0.1 0.2 35.5 0.2 - - -
Minto 100% - - - 11.1 4.7 1.7 11.1 4.7 1.7 13.0 4.5 1.9
Stratoni 100% - - - 1.4 153.0 6.6 1.4 153.0 6.6 1.7 162.2 8.9
Stillwater (13) 4.5% 0.15 11.2 0.05 0.2 10.7 0.07 0.4 10.9 0.12 1.1 9.5 0.35
Appendix 49ATTRIBUTABLE RESERVES & RESOURCES - SILVER
TOTAL MEASURED, INDICATED AND INFERRED
December 31, 2021 (6)
Measured Indicated Measured & Indicated Inferred
Tonnage Grade Contained Tonnage Grade Contained Tonnage Grade Contained Tonnage Grade Contained
Interest Mt g/t / % Moz / Mlbs Mt g/t / % Moz / Mlbs Mt g/t / % Moz / Mlbs Mt g/t / % Moz / Mlbs
Silver Cont.
Rosemont (22) 100%
Rosemont 112.2 3.9 14.1 358.0 2.7 31.5 470.2 3.0 45.6 68.7 1.7 3.7
Copper World - - - 180.0 2.7 15.6 180.0 2.7 15.6 91.0 3.8 11.1
Blackwater (11,28) 50% 33.7 4.7 5.1 52.9 8.7 14.8 86.6 7.1 19.9 5.6 12.8 2.3
Kutcho (12) 100% 0.4 28.0 0.4 5.0 25.7 4.1 5.4 25.9 4.5 12.9 20.0 8.3
Curipamba (11,30) 75% - - - 1.8 38.4 2.2 1.8 38.4 2.2 0.7 31.6 0.7
Pascua-Lama 25% 10.7 57.2 19.7 97.9 52.2 164.4 108.6 52.7 184.1 3.8 17.8 2.2
Loma de La Plata 12.5% - - - 3.6 169.0 19.8 3.6 169.0 19.8 0.2 76.0 0.4
Toroparu (12,16) 50% 55.4 1.1 2.0 37.0 0.8 1.0 92.5 1.0 3.0 6.9 0.4 0.1
Cotabambas (12,24) 100% - - - 117.1 2.7 10.3 117.1 2.7 10.3 605.3 2.3 45.4
Metates Royalty (17) 0.5% 0.3 6.2 0.1 0.7 6.2 0.1 1.0 6.2 0.2 0.3 9.0 0.1
Total Silver 150.1 616.5 766.6 464.0
Appendix 50ATTRIBUTABLE RESERVES & RESOURCES - OTHER
TOTAL PROVEN & PROBABLE
December 31, 2021 (6) December 31, 2020
Proven Probable Proven & Probable Proven & Probable
Tonnage Grade Contained Tonnage Grade Contained Tonnage Grade Contained Process Recovery Tonnage Grade Contained
Asset Interest Mt g/t / % Moz / Mlbs Mt g/t / % Moz / Mlbs Mt g/t / % Moz / Mlbs % (7) Mt g/t / % Moz / Mlbs
Palladium
Stillwater (13) 4.5% 0.2 12.0 0.09 1.8 9.4 0.53 2.0 9.7 0.63 90% 1.8 11.2 0.64
Total Palladium 0.09 0.53 0.63 0.64
Platinum
Marathon (11,29) 22% 18.7 0.2 0.13 7.2 0.2 0.04 25.9 0.2 0.17 84% - - -
Total Platinum 0.13 0.04 0.17 -
Cobalt
Voisey's Bay (11,23) 42.4% 4.9 0.13 13.5 6.5 0.12 17.8 11.4 0.12 31.4 84% 12.1 0.12 31.7
Total Cobalt 13.5 17.8 31.4 31.7
TOTAL MEASURED, INDICATED AND INFERRED
December 31, 2021 (6)
Measured Indicated Measured & Indicated Inferred
Tonnage Grade Contained Tonnage Grade Contained Tonnage Grade Contained Tonnage Grade Contained
Interest Mt g/t / % Moz / Mlbs Mt g/t / % Moz / Mlbs Mt g/t / % Moz / Mlbs Mt g/t / % Moz / Mlbs
Palladium
Stillwater (13) 4.5% 0.15 11.2 0.05 0.2 10.7 0.07 0.4 10.9 0.12 1.1 9.5 0.35
Total Palladium 0.05 0.07 0.12 0.35
Platinum
Marathon (11,,29) 22.0% 4.39 0.2 0.03 15.0 0.1 0.07 19.4 0.2 0.10 5.1 0.1 0.02
Total Platinum 0.03 0.07 0.10 0.02
Cobalt
Voisey's Bay (11,23) 42.4% 1.7 0.04 1.5 - - - 1.7 0.04 1.5 2.5 0.12 6.8
Total Cobalt 1.53 - 1.5 6.8
Appendix 51ATTRIBUTABLE RESERVES & RESOURCES
ENDNOTES
1. All Mineral Reserves and Mineral Resources have been estimated in accordance with the 2014 Canadian Institute of Mining, Metallurgy and Petroleum (CIM) Standards for Mineral Resources and Mineral
Reserves and National Instrument 43-101 – Standards for Disclosure for Mineral Projects (“NI 43-101”), or the 2012 Australasian Joint Ore Reserves Committee (JORC) Code for Reporting of Exploration
Results, Mineral Resources and Ore Reserves.
2. Mineral Reserves and Mineral Resources are reported above in millions of metric tonnes (“Mt”), grams per metric tonne (“g/t”) for gold, silver, palladium and platinum, percent (“%”) for cobalt, millions of
ounces (“Moz”) for gold, silver, palladium and platinum and millions of pounds (“Mlbs”) for cobalt.
3. Qualified persons (“QPs”), as defined by the NI 43-101, for the technical information contained in this document (including the Mineral Reserve and Mineral Resource estimates) are:
a. Neil Burns, M.Sc., P.Geo. (Vice President, Technical Services); and
b. Ryan Ulansky, M.A.Sc., P.Eng. (Vice President, Engineering),
both employees of the Company (the “Company’s QPs”).
4. The Mineral Resources reported in the above tables are exclusive of Mineral Reserves. The Cozamin mine, San Dimas mine, Minto mine, Neves-Corvo mine, Zinkgruvan mine, Keno Hill mines, Aljustrel
mines, Santo Domingo project, Blackwater project, Kutcho project, Marathon project, Fenix project, Curipamba project, Goose project and Toroparu project (gold only) report Mineral Resources inclusive of
Mineral Reserves. The Company’s QPs have made the exclusive Mineral Resource estimates for these mines based on average mine recoveries and dilution.
5. Mineral Resources which are not Mineral Reserves do not have demonstrated economic viability.
6. Other than as detailed below, Mineral Reserves and Mineral Resources are reported as of December 31, 2021 based on information available to the Company as of the date of this document, and therefore
will not reflect updates, if any, after such date.
a. Mineral Resources for Aljustrel’s Feitais mine are reported as of July 2020, Moinho & St João mines as of August 2020 and the Estação project as of July 2018.
b. Mineral Resources for the Blackwater project are reported as of May 5, 2020 and Mineral Reserves as of September 10, 2021.
c. Mineral Resources for the Brewery Creek project are reported as of January 18, 2022.
d. Mineral Resources for the Cotabambas project are reported as of June 20, 2013.
e. Mineral Resources and Mineral Reserves for the Cozamin mine are reported as of October 31, 2020.
f. Mineral Resources for the Curipamba project are reported as of October 26, 2021 and Mineral Reserves as of October 22, 2021.
g. Mineral Resources and Mineral Reserves for the Fenix project are reported as of August 15, 2019.
h. Mineral Resources for the Goose project are reported as of December 31, 2020 and Mineral Reserves as of January 15, 2021.
i. Mineral Resources for Keno Hill’s Elsa Tailings project are reported as of April 22, 2010, Bellekeno mine Indicated Mineral Resources as of January 1, 2021, Mineral Resources for the Lucky
Queen, Flame & Moth and Onek mines as of January 3, 2017 and Bermingham mine as of November 30, 2021. Mineral Reserves are reported as of May 26, 2021.
j. Mineral Resources for the Kutcho project are reported as of July 20, 2021 and Mineral Reserves are reported as of November 8, 2021.
k. Mineral Resources for the Loma de La Plata project are reported as of May 20, 2009.
End Notes 52ATTRIBUTABLE RESERVES & RESOURCES
ENDNOTES (CONTINUED)
l. Mineral Resources and Mineral Reserves for the Los Filos mine are reported as of October 31, 2018.
m. Mineral Resources for the Marathon project are reported as of June 30, 2020 and Mineral Reserves as of September 15, 2020.
n. Mineral Resources Marmato mine are reported as of June 30, 2021 and Mineral Reserves as of March 17, 2020.
o. Mineral Resources Metates royalty are reported as of May 18, 2021 and Mineral Reserves as of April 29, 2016.
p. Mineral Resources for the Minto mine are reported as of March 31, 2021.
q. Mineral Resources and Mineral Reserves for the Neves-Corvo and Zinkgruvan mines are reported as of June 30, 2021.
r. Mineral Resources and Mineral Reserves for the Rosemont project are reported as of March 30, 2017 and Mineral Resources for Copper World as of December 1, 2021.
s. Mineral Resources for the Santo Domingo project are reported as of February 13, 2020 and Mineral Reserves as of November 14, 2018.
t. Mineral Resources and Mineral Reserves for the Stratoni mine are reported as of September 30, 2021.
u. Mineral Resources for the Toroparu project are reported as of November 1, 2021 and Mineral Reserves are reported as of March 31, 2013.
7. Process recoveries are the average percentage of gold, silver, palladium, platinum, or cobalt in a saleable product (doré or concentrate) recovered from mined ore at the applicable site process plants as reported by
the operators.
8. Mineral Reserves are estimated using appropriate process and mine recovery rates, dilution, operating costs and the following commodity prices:
a. Aljustrel mine – 3.5% zinc cut-off for the Feitais, Moinho and St João mines and 3.0% zinc cut-off for the Estação project.
b. Antamina mine - $6,000 per hour of mill operation cut-off assuming $3.03 per pound copper, $1.07 per pound zinc, $9.40 per pound molybdenum and $18.32 per ounce silver.
c. Blackwater project – CAD $13.00 per tonne NSR cut-off assuming $1,400 per ounce gold and $15.00 per ounce silver.
d. Constancia mine - $1,375 per ounce gold, $17.00 per ounce silver, $3.10 per pound copper and $11.00 per pound molybdenum.
e. Cozamin mine - NSR cut-offs of $48.04 per tonne for conventionally backfilled zones for 2020-2022, $51.12 per tonne for conventionally backfilled zones for 2023 and onward, $56.51 per tonne for paste
backfilled zones of Vein 10 and $56.12 per tonne for paste backfilled zones of Vein 20, all assuming $2.75 per pound copper, $17.00 per ounce silver, $0.90 per pound lead and $1.00 per pound zinc.
f. Curipamba project - NSR cut-off of $32.99 per tonne assuming $1,630 per ounce gold, $21 per ounce silver, $3.31 per pound copper, $0.92 per pound lead and $1.16 per pound zinc.
g. Fenix project – 0.24 grams per tonne gold cut-off assuming $1.250 per ounce gold.
h. Goose project:
i. Umwelt – 1.72 grams per tonne for open pit and 3.9 grams per tonne for underground.
ii. Llama – 1.74 grams per tonne for open pit and 4.1 grams per tonne for underground.
iii. Goose Main – 1.70 grams per tonne for open pit and 4.1 grams per tonne for underground.
iv. Echo – 1.60 grams per tonne for open pit and 3.5 grams per tonne for underground.
Endnotes 53You can also read