THE IMPACT OF A SECOND ROUND OF STIMULUS ON THE CPG DEMAND CURVE - COVID-19 Emerging Point of View - IRi

 
CONTINUE READING
THE IMPACT OF A SECOND ROUND OF STIMULUS ON THE CPG DEMAND CURVE - COVID-19 Emerging Point of View - IRi
COVID-19 Emerging Point of View

THE IMPACT OF A SECOND
ROUND OF STIMULUS ON
THE CPG DEMAND CURVE
July 30, 2020
THE IMPACT OF A SECOND ROUND OF STIMULUS ON THE CPG DEMAND CURVE - COVID-19 Emerging Point of View - IRi
Executive Summary                     IMPACT OF SECOOND STIMULUS
In March 2020, the $2.2 trillion      CHECK ON CPG DEMAND
Coronavirus Aid, Relief, and          • Consumers are likely to spend most of the
                                        stimulus check on essentials (e.g., rent,
Economic Security Act (CARES Act)       utilities) or discretionary categories (e.g.,
stimulus bill was passed, and           electronics, home amenities etc.) or savings /
included $1,200 per adult whose         investments
income was less than $99,000, as      • About a third of consumers (mostly lower
                                        income) will use the extra money to buy
well as an extra $600 per week on       groceries; value channels are likely to benefit
top of states’ unemployment
benefits; that benefit is scheduled   EFFECT OF REDUCED
to end July 31. Congress in May       UNEMPLOYMENT BENEFITS
approved a $3 trillion stimulus       As benefits are reduced, recessionary spending
package, the Heroes Act, to extend    behaviors are likely to take hold: lower income
economic support through January      shoppers will stick to the basics; middle income
                                      shoppers will revert to lower-income behavior;
31, 2021. The Senate is currently     highest earners may catch the “fear fever” and
negotiating a separate $1 trillion    save, rather than spend.
package, the HEALS Act. In this       • Discretionary spending would suffer
report, we anticipate likely impact   • Shoppers will seek value in economically
of the second stimulus check and        valuable, larger pack sizes, as well as smaller
                                        pack sizes required by tight budgets
reduced unemployment benefits         • Price / value perceptions will matter even more
on the CPG Demand Curve.                in choice of brands and retailers

                                                                                          © 2020 Information Resources Inc. (IRI). Confidential and Proprietary.   2
THE IMPACT OF A SECOND ROUND OF STIMULUS ON THE CPG DEMAND CURVE - COVID-19 Emerging Point of View - IRi
What Happens July 31st?
The $2.2 trillion CARES Act, which included a one-time check to individuals earning less than
$99,000, an additional weekly unemployment benefit of $600, as well as hundreds of billions of
dollars in forgivable small business loans worked to bolster an economy hit by shuttered
businesses and massive unemployment, all fallout of the deadly coronavirus. Intended to carry
consumers and the economy through the pandemic, these benefits are set to expire July 31.
With dramatically increasing cases of COVID-19 and 18 straight weeks of more than 1 million
individuals applying for unemployment benefits, it’s clear that support beyond July is needed.
Who is impacted?
• 51.3MM Americans have filed for unemployment due to COVID-19.**
• 25MM people currently receive the $600 unemployment booster check each week.*
• The eviction moratorium for those living in federally backed mortgages or receiving
  government assisted housing expires on July 25 (with some extensions to August 31),
  impacting 40MM.*
Two-Thirds of Americans Say They Need Additional Stimulus Support
• Job losses among low-wage workers represent 56% of total unemployment.**
• About 61% of middle-income Americans have cut spending in the wake of the pandemic.**
• About 78% of U.S. workers are living paycheck to paycheck.*
• More than a quarter of U.S. households missed last month’s rent or mortgage payment and
  there is a lack confidence in the ability to pay next month.

                                                                                      Source: *CNBC; **USA Today
                                                © 2020 Information Resources Inc. (IRI). Confidential and Proprietary.   3
THE IMPACT OF A SECOND ROUND OF STIMULUS ON THE CPG DEMAND CURVE - COVID-19 Emerging Point of View - IRi
More Than Half of Consumers Fear Losing Their
Job; 35% Fear Loss of Employment Income
Household Pulse Survey – Total U.S.
                                                 51.1%
47.0%

                                                           38.8%
                                                                                                                                       35.2%

             Loss in Employment Income                               Expected Loss in Employment Income
  Week 1     Week 2   Week 3   Week 4   Week 5   Week 6   Week 7    Week 8        Week 9         Week 10         Week 11         Week 12
  April 23                                                                                                                       July 23

                                                              Source: U.S. Census Bureau; % of adults in households where someone had a loss in employment income since March 13, 2020
                                                                                                                      © 2020 Information Resources Inc. (IRI). Confidential and Proprietary.   4
THE IMPACT OF A SECOND ROUND OF STIMULUS ON THE CPG DEMAND CURVE - COVID-19 Emerging Point of View - IRi
More Than a Quarter of U.S. Households Missed Last Month’s Rent or
      Mortgage Payment; There is a Lack of Confidence in Ability to Pay Next Month
      United States Housing Scarcity by Week
                    50                                                                                                                                                                     26.4              26.5          27
         MILLIONS

                    45                                                                                                                               25.9
                                                        25.4                                                                                                                                                               26
                                                                                                                                                                        25.3
                    40
                          24.6          24.7                                                                                          24.5                                                                                 25
                    35
                                                                       23.6            23.7                                                                                                                                24
                    30                                                                                                23.2
                    25                                                                                                                                                                                                     23
                                                                                                      22.1
                    20                                                                                                                                                                                                     22
                    15
                                                                                                                                                                                                                           21
                    10
                     5                                                                                                                                                                                                     20

                     0                                                                                                                                                                                                     19
                            1             2               3              4               5               6              7               8               9                 10                11                 12
                         April 23                                                                            WEEKS                                                                                          July 23
Measure Definition: % of adults who missed last month’s rent or mortgage payment, or who have slight or no confidence that their household can pay next month’s rent or mortgage on time / Timeframe: April 23 – July 23, 2020

                                                                                                                                                              Source: https://www.census.gov/data-tools/demo/hhp/#/
                                                                                                                                                  © 2020 Information Resources Inc. (IRI). Confidential and Proprietary.    5
THE IMPACT OF A SECOND ROUND OF STIMULUS ON THE CPG DEMAND CURVE - COVID-19 Emerging Point of View - IRi
A Second Stimulus Check is on the Table; the First Check Was
Saved, Used for Rent / Mortgage and Spent on Groceries
$2.2 trillion CARES Act: Sales took off in mid-April when many Americans began to receive their $1,200
stimulus checks. Within 10 days of receiving their stimulus checks, households spent around one quarter to
one third of it, research shows, including rent, bills, food, personal care and nondurables.
Uses of Stimulus Payment
                                                                              4/3 - 4/5           4/10 - 4/12             4/17 - 4/19                4/24 - 4/26               5/1 - 5/3
  48%48%
          41%       43% 44%
        41% 42%       40%   40%
                          38%        35% 34%
                                   34%
                                       32% 30%

                                                                                                                                                                                18%
                                                                                                                                                                            16%   17%
                                                                                                                                                                              16%
                                                        11% 12%
                                                              10%
                                                                                                                                                                          13%
                                                      9% 9%                             8%
                                                                                  7%6%7% 5%                     5%5%5%
                                                                                                              5%      3%
                                                                                                                                            2%1%1%1%1%

   To Pay Rent,     To Add to My    To Buy More           To Pay                To Buy Furniture,                  To Buy                 To Pay for Child                        Other
  Mortgage, Taxes    Savings or    Groceries and         Healthcare              Appliances or                     Clothing                  Care or a
    or Utilities     Investment    Other Everyday          Bills                   Electronics                                             Caregiver for
                      Accounts     HH Essentials                                                                                             an Adult

                                                Source: MarketWatch, IRI Consumer Network™ Panel Survey representing Total U.S. Primary Grocery Shoppers, base ~1,200 adults aged 18+
                                                                                                                     © 2020 Information Resources Inc. (IRI). Confidential and Proprietary.   6
THE IMPACT OF A SECOND ROUND OF STIMULUS ON THE CPG DEMAND CURVE - COVID-19 Emerging Point of View - IRi
Stimulus Spending Shifts Based on Household Income; Lowest Income
       Households Focused on Necessities of Food, Utilities, Household Supplies
       Percentage of Recipients Allocating Economic Impact Payment Toward Specific Expenses,
       Among Those Who Used the Stimulus to Mostly Pay Expenses, by Household Income

Note: Population weights applied. This figure represents adults over the age of 18 who responded to the income and economic impact payment questions.

                                                                                                                   Source: American Enterprise Institute Analysis of U.S. Census Bureau. “Week 8 HH Pulse Survey: June 18-23, July 1, 2020
                                                                                                                                                                       © 2020 Information Resources Inc. (IRI). Confidential and Proprietary.   7
THE IMPACT OF A SECOND ROUND OF STIMULUS ON THE CPG DEMAND CURVE - COVID-19 Emerging Point of View - IRi
Tracking the Stimulus Spend
IRI’s weekly consumer surveys reveal the majority            According to the
of stimulus money went to housing expenses,                National Bureau of
savings and grocery bills. Retailers experienced          Economic Research,
an upsurge in sales of discretionary categories,            households spent
including electronics, clothes and toys.                   about $0.25 - $0.35
                                                         more for each stimulus
Retailers Reporting Increases                                dollar in the first
                                                            10 days after they
                   TVs, electronics, gaming equipment,   received the payment.
                   sporting goods, apparel, bicycles
                                                         Researchers found that
                   TVs, electronics, gaming equipment,   consumers spent more
                   apparel and cosmetics
                                                         than 40% of the money
                                                          from the checks after
                                                             a week or two.

     TVs              TVs            Uptick in ALL
  Electronics     Electronics         Products
                Sewing Machines

                                                                            © 2020 Information Resources Inc. (IRI). Confidential and Proprietary.   8
THE IMPACT OF A SECOND ROUND OF STIMULUS ON THE CPG DEMAND CURVE - COVID-19 Emerging Point of View - IRi
As Unemployment Benefits Decrease, Recessionary Behaviors Will Increase
                               Shopping Behaviors of Past Recessions

                                Spend Less on
        Spend Less on             Personal            Buy Smaller          Buy at Lower                      Buy at Value
          Eating Out            Services, e.g.,        Amounts                Prices                          Channels
                                  Hair, Nails

                                                           Buy Fewer          Purchase More                           Shopped
               Buy More               DIY Nail Care                                                                 Retailers That
           Affordable Treats                               Individual-         Private Label
                                     Sales Increase     Serving Packages         Products                               Offer
                                                                                                                     More Value

           Fewer Prepared                                 Buy Smaller                                                Stock Up at
             Meals, More            Home Hair Color       Amounts of         Plan Trip to Stick                     the Beginning
           Scratch Cooking           Sales Increase      Favorite Treats     To List / Budget                        of the Month

                                                          Cut Back on           Use More                            Buy Less at
                                                         Non-Essential        Coupons; Look                         Convenience
                                                           Groceries            for Deals                             Stores

                        CLICK HERE for More on Recessionary Behaviors with IRI’s “Recession Proof Your Business” Series

                                                                                                                                    Source: IRI analysis
                                                                                   © 2020 Information Resources Inc. (IRI). Confidential and Proprietary.   9
THE IMPACT OF A SECOND ROUND OF STIMULUS ON THE CPG DEMAND CURVE - COVID-19 Emerging Point of View - IRi
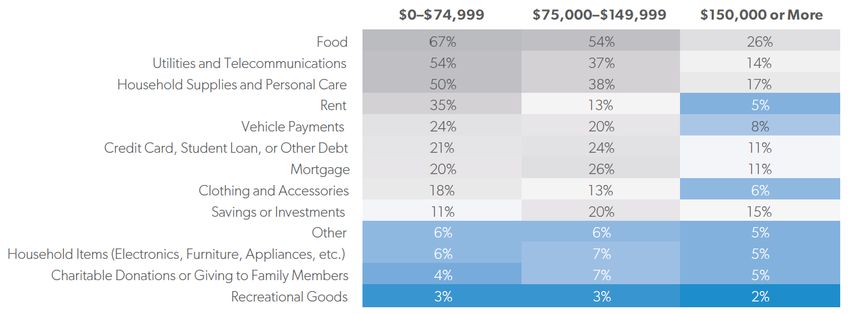
Comparing House’s Heroes Act and Senate’s HEALS Act vs. CARES Act
                                               CARES Act                                            HEROES Act                                                        HEALS Act
  Stimulus Package Cost                         $2.2 trillion                                          $3 trillion                                                       $1 trillion
        Stimulus Check        $1,200 to single filers earning under $75k per                       Same as CARES                                                    Same as CARES
      Maximum Payment            year, $2,400 for joint filers under $125k
        Stimulus Money                                                                 $1,200 for dependents, maximum of three                         $500 for all dependents, no age limit
                                  $500 for all dependents 16 and under
Received for Dependents                                                                                                                            Initially $200 per week, then up to $500
Enhanced Unemployment               $600 per week plus state benefits                              Same as CARES                                    per week to match 70% of lost wages
               Benefit                                                                                                                                    when added to state benefits
Enhanced Unemployment                                                                       January 2021 for most workers                      $200 per week bonus through September, then
                                              Expires July 31                                                                                  70% matching of lost wages; expires 12/31/20
             Duration
                             $659B in forgivable loans for small businesses,           Expands eligibility, eliminates 75% payroll             $190B into the PPP fund; allows businesses to
    Paycheck Protection      who must use 75% on payroll to be eligible for              requirement and extends application                     request a second loan; expands approved
              Program                  forgiveness; expires 8/8/20                                period to 12/31/20                                    use of funds for loan forgiveness
                                                                                          Increases tax credit to 80% of up to                   Increases tax credit to 65% of up to $30,000
    Employee Tax Credit        Tax credit on 50% of up to $10,000 in wages                        $15,000 in wages
 Eviction Protection and      Bans late fees until 7/25, evictions until 8/24 on        Expands to cover rent, extends eviction                                    Does not address
             Moratorium      properties backed by federal mortgage programs        moratorium, allocates $200B for housing programs
                                                                                                                                                 $70B to K-12 that open for in-person classes,
      School Reopening                       Does not address                      $58B for grades K-12, $42B for higher education.               $29B for higher education, $1B to Bureau of
                                                                                                                                                     Indian Education, $5B state discretion
 Liability Protection from                                                                                                                          5 year liability shield to prevent schools,
                                             Does not address                                      Does not address                               businesses, hospitals, from being sued over
      Coronavirus Illness
                                                                                                                                                           coronavirus related issues
    Coronavirus Testing                      Does not address                                          $75 billion                                                   $16 billion

                                                                                                                           © 2020 Information Resources Inc. (IRI). Confidential and Proprietary.   10
Insights and Strategic
Guidance for Better Decisions
IRI’s Online Resources Include Real-Time
Updates and Weekly Reports That Track
the Impact of the Virus on CPG and Retail
The IRI COVID-19 lmpact
Includes COVID-19 impact analyses, dashboards
and the latest thought leadership on supply chain,
consumer behavior and channel shifts for the U.S.
AND international markets.

IRI CPG Economic Indicators, Including
the IRI CPG Demand Index™, IRI CPG
Supply Index™ and IRI CPG Inflation
Tracker™
Accessible through the insights portal
to track the daily impact of COVID-19.
This includes top-selling and out-of-stock
categories across the country and
consumer sentiment on social media.

                                                     © 2020 Information Resources Inc. (IRI). Confidential and Proprietary.   11
NOW INCLUDES

IRI CPG Demand Index™
                                                                                            U.S., UK, FRANCE, ITALY,
                                                                                           GERMANY & NETHERLANDS

The IRI CPG Demand Index™ provides a
standard metric for tracking changes in spending
on consumer packaged goods. It measures
weekly changes in consumer purchases, by
dollar sales, against the year-ago period across
departments, including fixed and random weight
products, grocery aisles and retail formats. The
IRI CPG Demand Index™ is available for eight
U.S. regions, all U.S. states, UK, France, Italy,
Germany and the Netherlands.

                                                                                         CLICK HERE FOR MORE!

                                                    © 2020 Information Resources Inc. (IRI). Confidential and Proprietary.   12
The Latest COVID-19 Reports and Insights from IRI (click to see full report)
      IRI COVID-19 IMPACT           THE CHANGING SHAPE
     ASSESSMENT REPORTS          OF THE CPG DEMAND CURVE               RECESSION PROOF YOUR BUSINESS

                                                           © 2020 Information Resources Inc. (IRI). Confidential and Proprietary.   13
IRI Global Headquarters
 CONTACT US   150 North Clinton Street
              Chicago, IL 60661-1416
   FOR MORE   IRI@IRIworldwide.com
              +1 312.726.1221
INFORMATION   Follow IRI on Twitter: @IRIworldwide

                                                       © 2020 Information Resources Inc. (IRI).
                            © 2020 Information Resources Inc. (IRI). Confidential
                                                                     Confidential and
                                                                                  and Proprietary.
                                                                                      Proprietary.   14 14
You can also read